
There are so many questions that we get from our advisors and clients about the regional banking crisis, in addition to the debt ceiling (which Ryan covered in another blog). Here’re some answers to some of the common questions.
What is happening with regional banks?
The crisis erupted with Silicon Valley Bank (SVB) in early March. SVB hit the end of the road with a classic run on the bank, i.e. depositors rushing out the door, even as the bank’s asset values had deteriorated due to long-term bond holdings that lost value as interest rates surged over the past year. The FDIC eventually took over the insolvent bank, along with Signature Bank and First Republic (in late April). So regional banks have been under pressure over the past 2 months, as investors extrapolated some of the problems that plagued the three troubled banks to others.
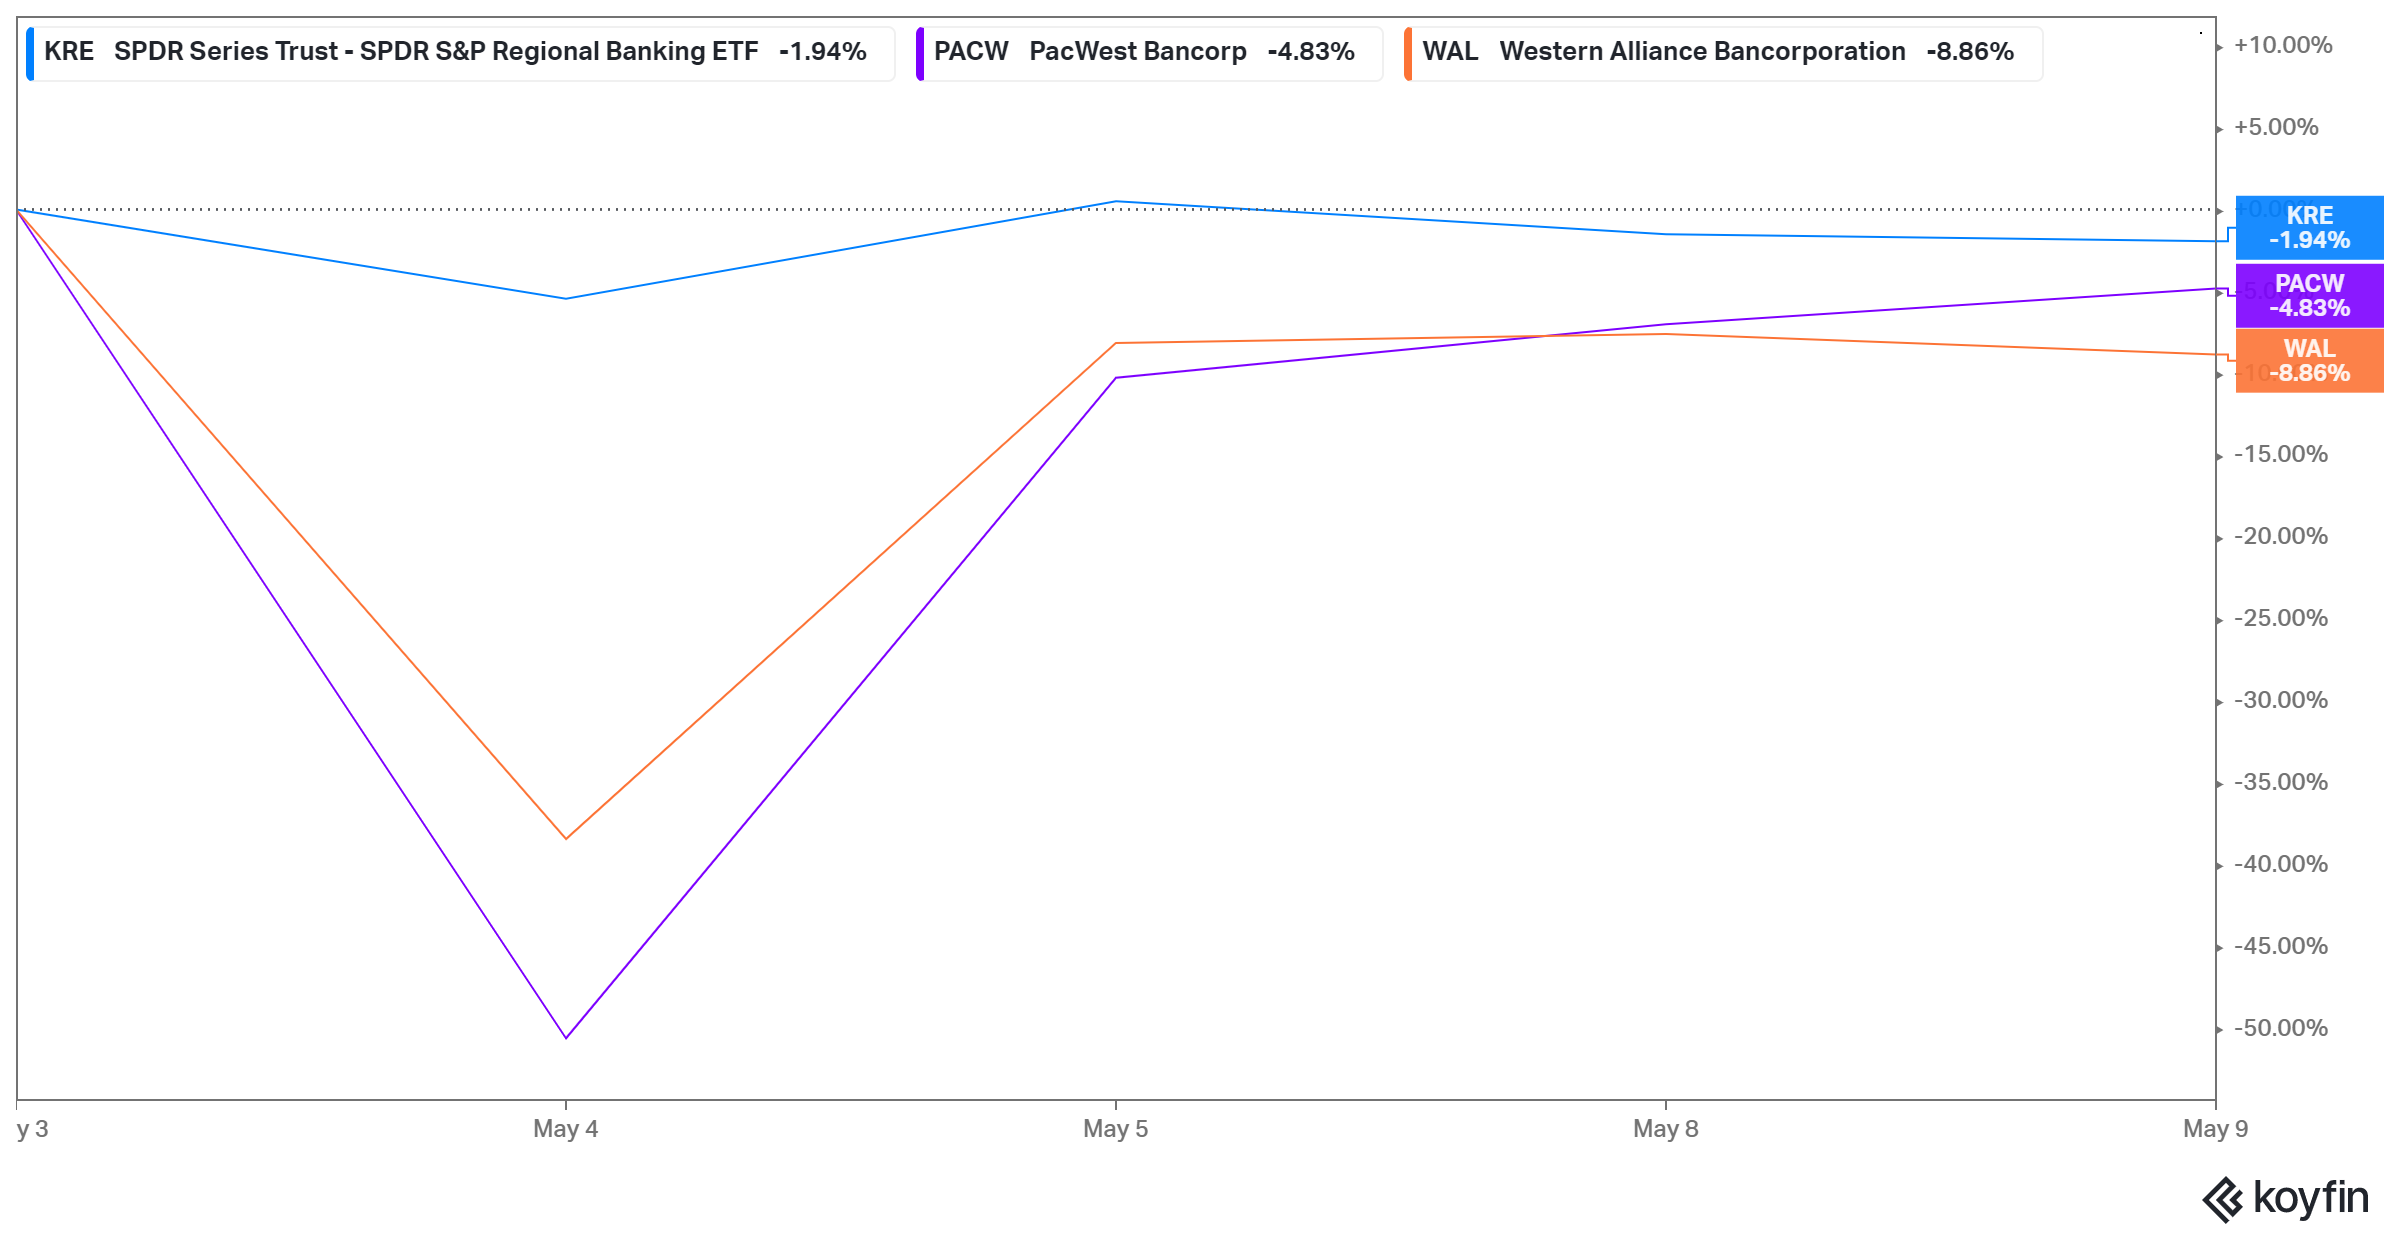
Then last week saw renewed selling pressure on regional bank stocks. On May 4th, PacWest Bancorp fell 51.6% and Western Alliance Bancorp fell 41%. The SPDR S&P Regional Banking ETF (KRE) fell 7.2% just on that day. Now, as you can see in the chart below, there’s been quite a recovery since then, but prices are still down significantly since the crisis started. The KRE ETF is down almost 34.6% since March 8th, when the crisis started.
Why are small bank stock prices still under pressure?
It helps to understand how a bank works. They make money by borrowing money from depositors (yes, when you put money in a bank, you’re lending money to it) and lending money to consumers and businesses. The difference between the interest rate they charge borrowers and the rate they pay depositors is their “net interest margin” (NIM), or profit. Right now, the fear is that profitability has reduced as banks, especially smaller ones, have to increase the rates they pay depositors to keep them from fleeing. However, what’s important to know is that reduced profitability is different from insolvency, which is what happened to the 3 banks that went under.
Stay on Top of Market Trends
The Carson Investment Research newsletter offers up-to-date market news, analysis and insights. Subscribe today!
"*" indicates required fields
What’s different from SVB and some of these other regional banks?
The main problem for SVB was that more than 90% of their deposits were uninsured. When news spread that their assets were impaired, and they were looking to raise capital, these depositors fled as they were worried that they wouldn’t get their money back. We wrote about it in depth at the time.
In contrast, banks like PacWest and Western Alliance have a much smaller percent of deposits that are uninsured (about 25%) – making them potentially less prone to a run.
So why did the stock prices for these banks crash on May 4th?
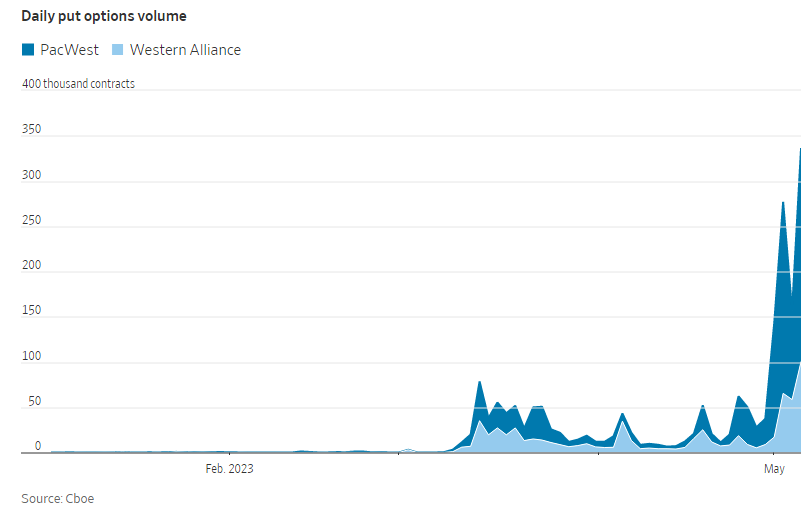
As I wrote above, there doesn’t appear to be any fundamental solvency issues with these banks, other than perhaps reduced profitability. Instead, what happened last week was driven by stock market speculation. Case in point, short selling and put option activity on PacWest and Western Alliance surged recently. Put options allow investors to profit from lower stock prices. In this case, market makers and dealers who sold these positions were “long” stocks and had to hedge that by shorting. This pushed prices lower, and eventually led to dealers having to sell even more shares short, especially as investors bought even more puts.
Wait, is this something like the meme stock frenzy?
In a sense, yes. If you remember, back in early 2021 stock prices for meme stocks surged on speculative activity, particularly call option buying. Dealers who sold these options were essentially “short” the stock. So, they had to hedge to be directionally neutral, which they did by buying stock, pushing prices higher. And as the social media frenzy picked up, prices surged as dealers had to buy even more stock.
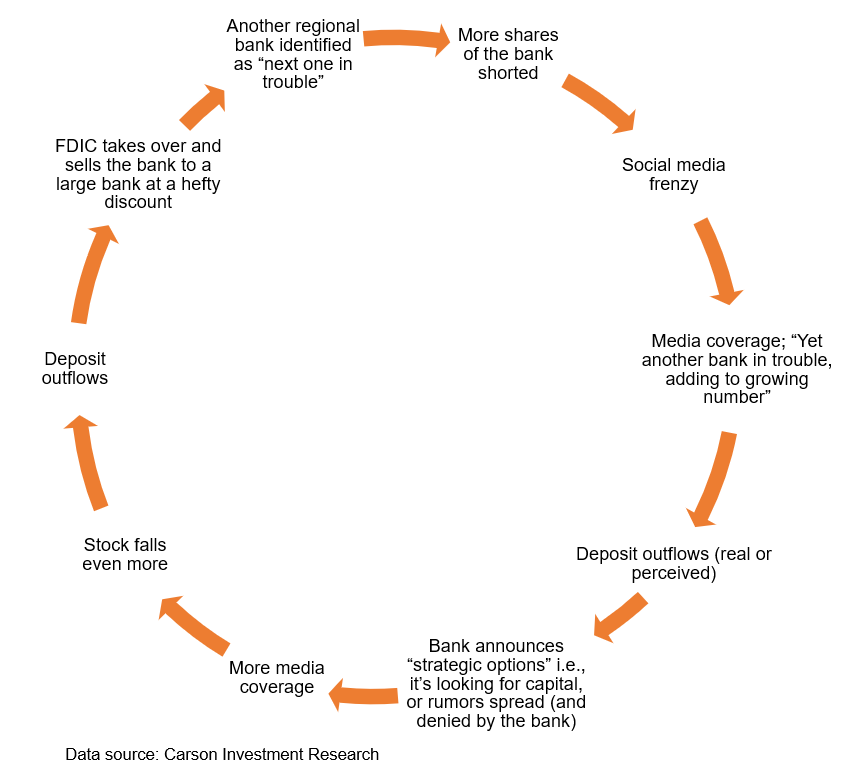
I made the following schematic to illustrate what happened with regional banks last week. Now historically bank runs have been triggered by news events, and that can potentially happen a lot quicker these days because of social media. Speculators were betting that the bank in trouble will see deposits flee, and eventually be taken over by the FDIC, an event that would wipe out shareholders and result in profits for investors betting on these bank stock prices crashing. The good news is that the negative feedback loop was broken pretty quickly.
Could this be the canary in the coalmine, and can the crisis spread?
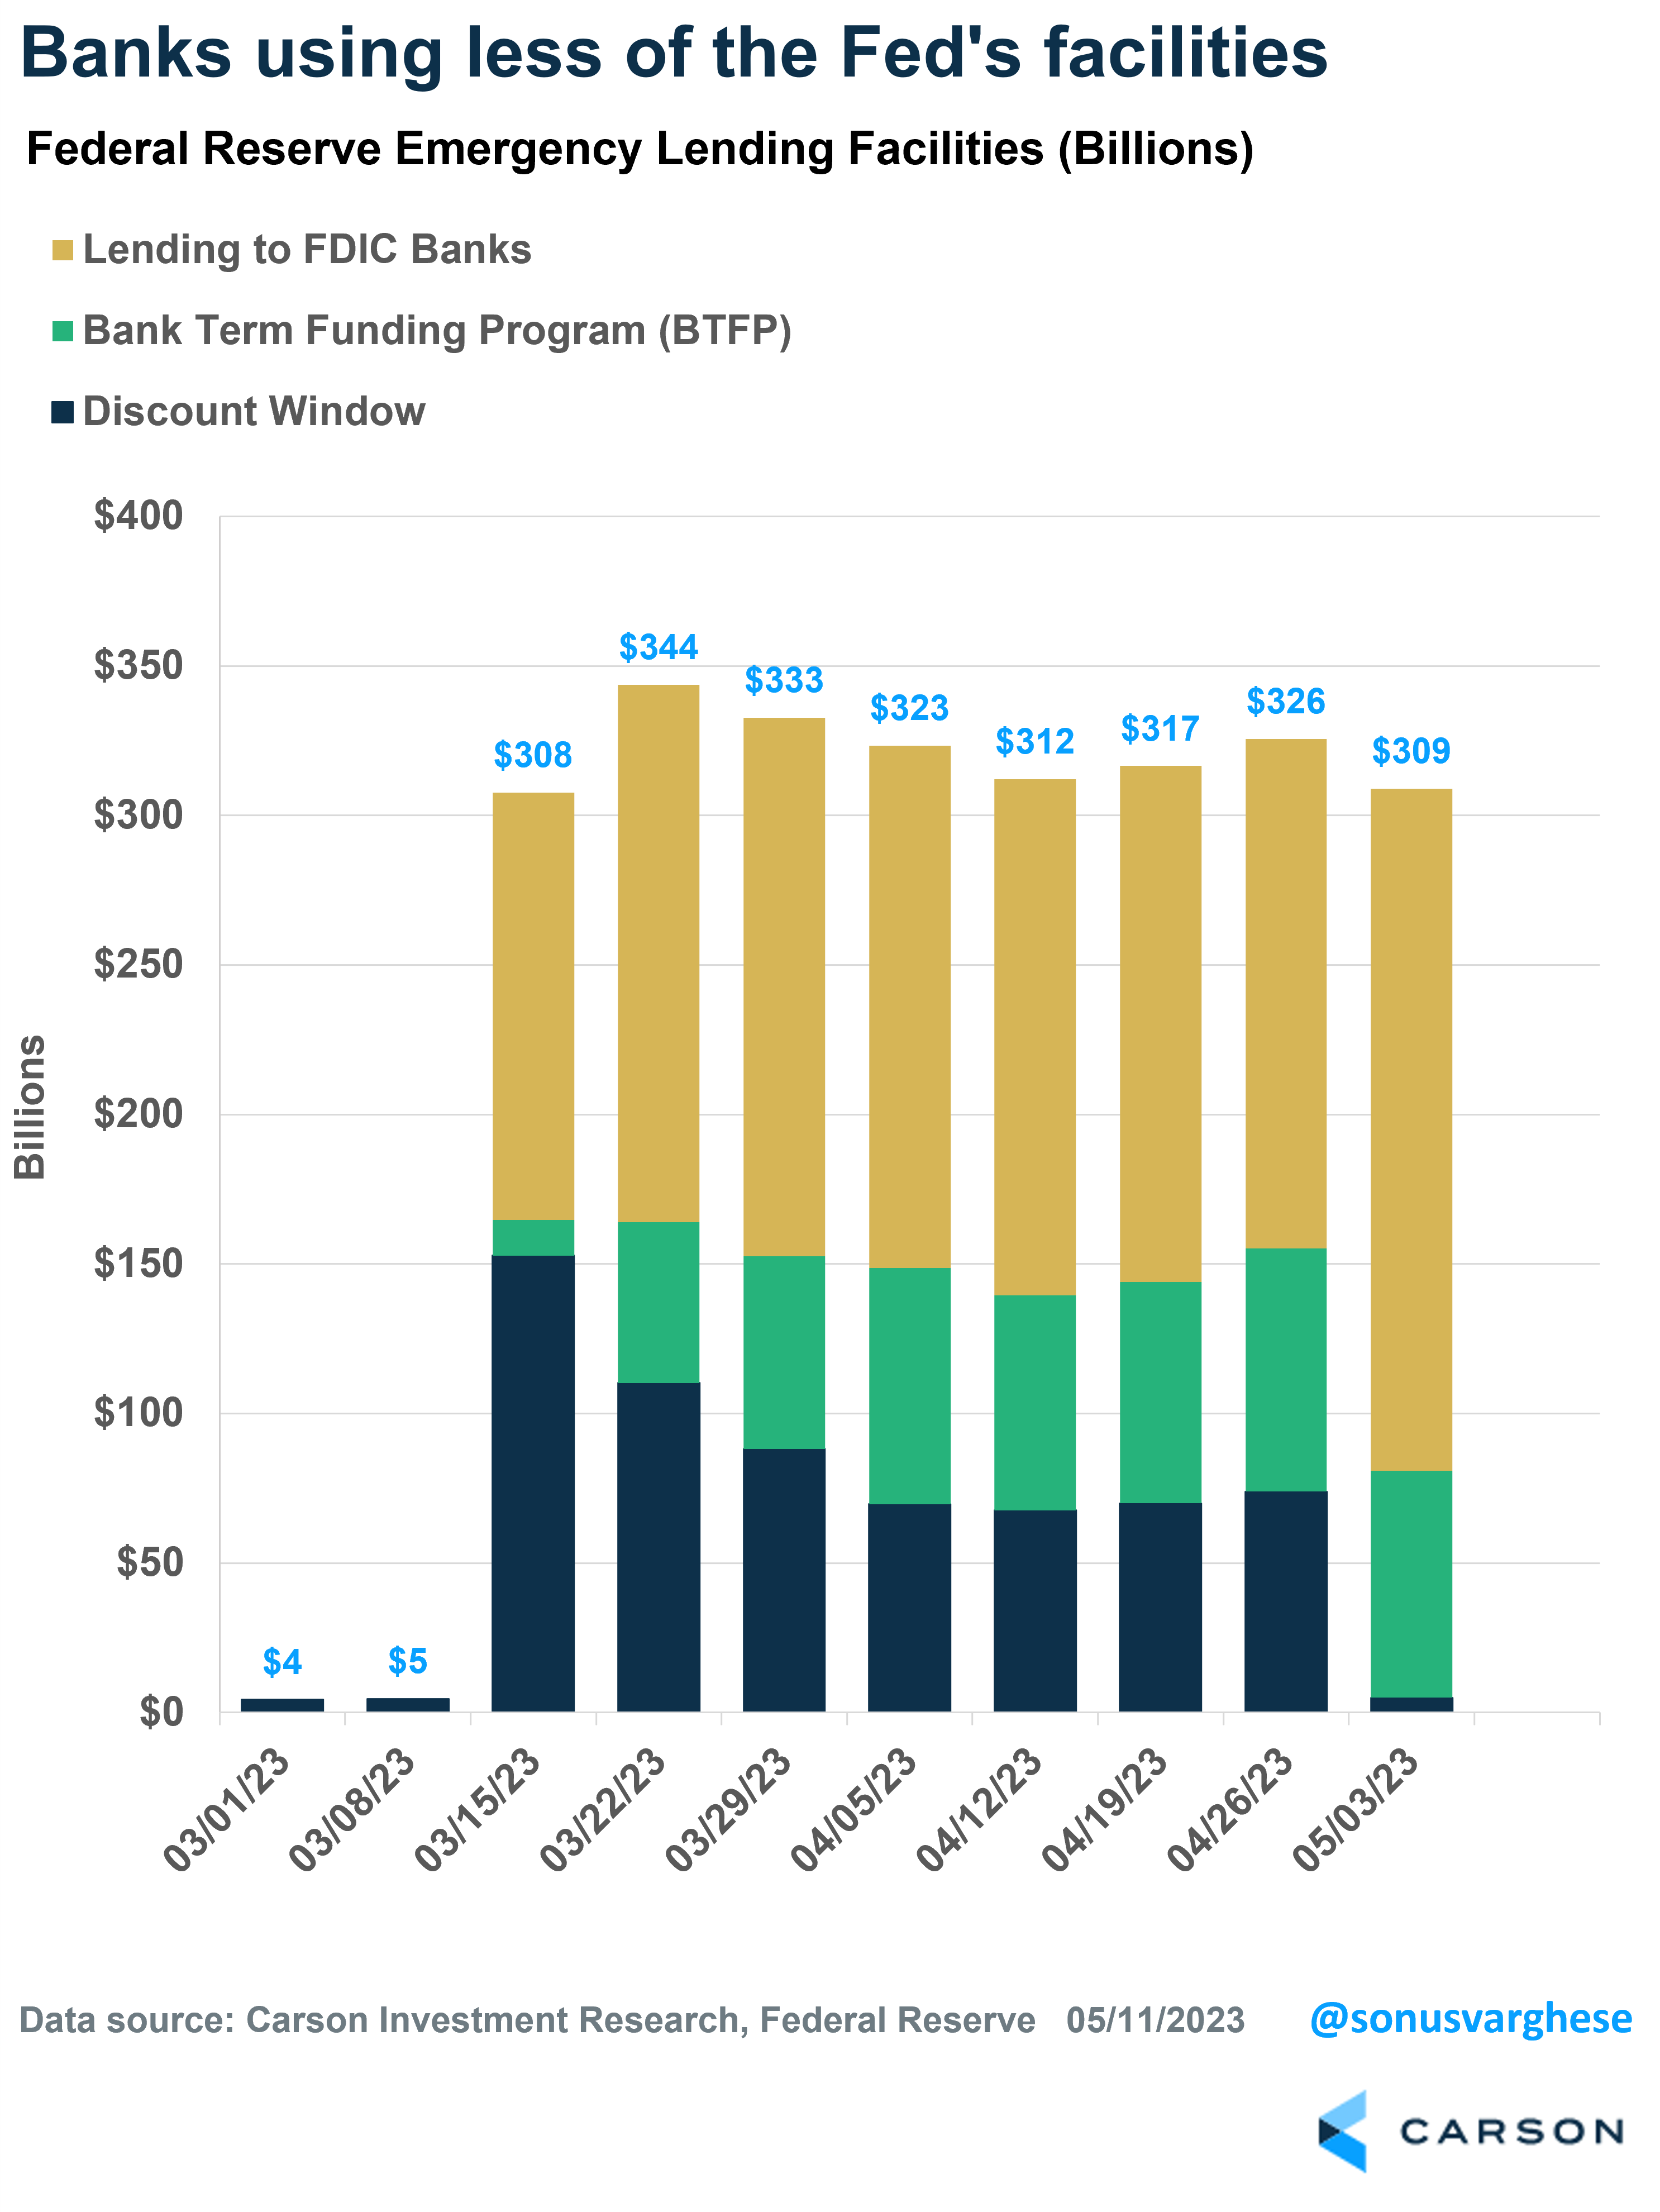
Never say never in the investment business. But one big sign that trouble is not spreading is that banks are not accessing the Federal Reserve’s (Fed) liquidity facilities to the extent they were a few weeks ago. Loans to banks via the Fed’s facilities are at the lowest level in 7 weeks. There are three pieces here:
- Lending to FDIC depository institutions (yellow bar in the chart below) – These are loans extended to banks that were subsequently taken over by the FDIC, like SVB, Signature and First Republic. This increased in the latest data because First Republic was just taken over.
- Discount window (dark blue bars) – Banks can use this to access liquidity in exchange for collateral (like US treasuries). It’s fallen from $153 billion to $5 billion over the last month, which is close to where it was before the SVB crisis.
- Bank term funding program (green bar) – This is a new facility that the Fed set up in March after the SVB crisis. Banks can access liquidity here by exchanging securities at their full par value. This has dropped from a peak of $81 billion to $76 billion, which is a very positive sign.
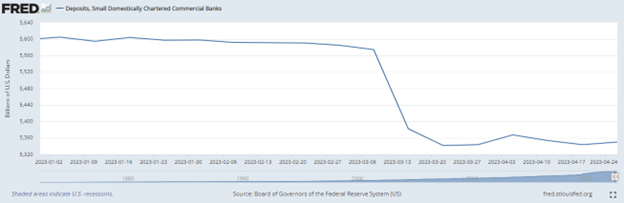
Another positive sign: the latest data from the Fed shows that deposits at small commercial banks in the US have stabilized over the past month. Deposits at these banks cratered over the two weeks after the SVB crisis, and the worry was that this would continue.
Will there be a broader economic impact, due to a credit crunch?
The latest Fed survey of loan officers from showed that banks tightened credit at the start of the second quarter. However, the net percent of survey respondents saying they tightened standards for commercial and industrial loans did not increase significantly, rising from 44.8% in January to 46% in April. But here’s the other side of that: 54% said that standards “remained basically unchanged”.
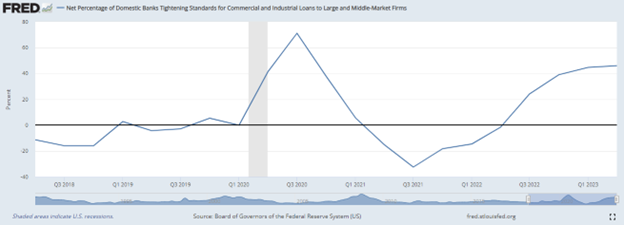
Make no mistake, credit standards have tightened over the past year. But that was already the case before the SVB crisis, and it really hasn’t had much of an impact on the economy as we saw from the recent GDP growth data for Q1.
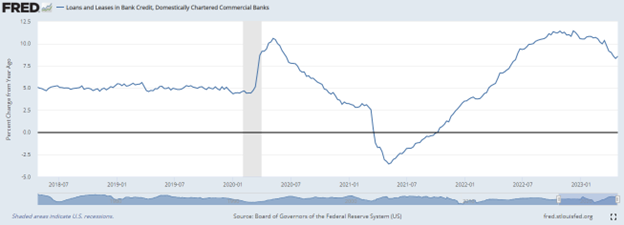
Note that banks are still making loans. In fact, bank lending is up 8.5% over the past year – it was running at a pace of around 5% before the pandemic. Now a big part of that is due to inflation, as higher prices mean loans are larger. But bank lending doesn’t look to have completely collapsed.
Ultimately, what is important with respect to the current economic expansion (since 2020) is that this is NOT a credit driven cycle. This contrasts with the late 1980s, late 1990s and mid-2000s. During those periods, credit growth drove business and real estate investment, and consumer spending. Eventually, when losses on loans spread, credit was pulled back and the economy went into a recession.
Right now, economic growth is being driven by strong incomes, because of strong employment and wage growth. And so far, there’s no reason to believe that will not continue.
For more on our overall macro and investment thoughts, listen to our latest Facts vs. Feelings podcast: