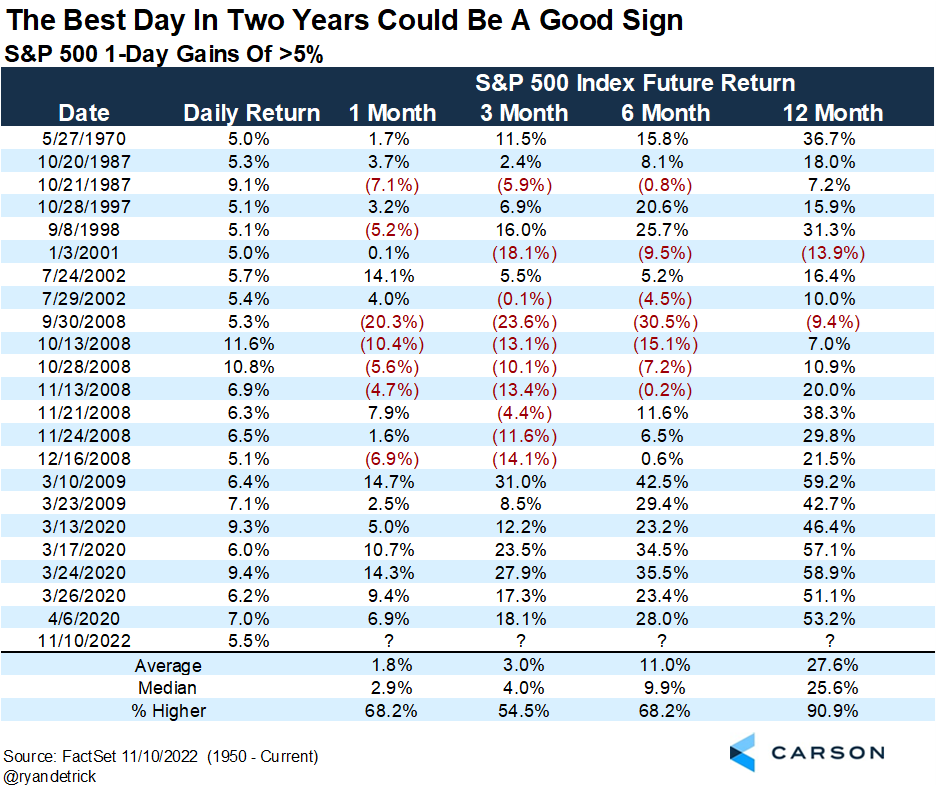
What a day for markets yesterday. The S&P 500 Index gained 5.5%, its best day since April 2020. Here’s a chart from my colleague Ryan Detrick, showing some historical perspective for days that saw more than 5% gains. A year later markets were up 91% of the time, with an average return of almost 28%.
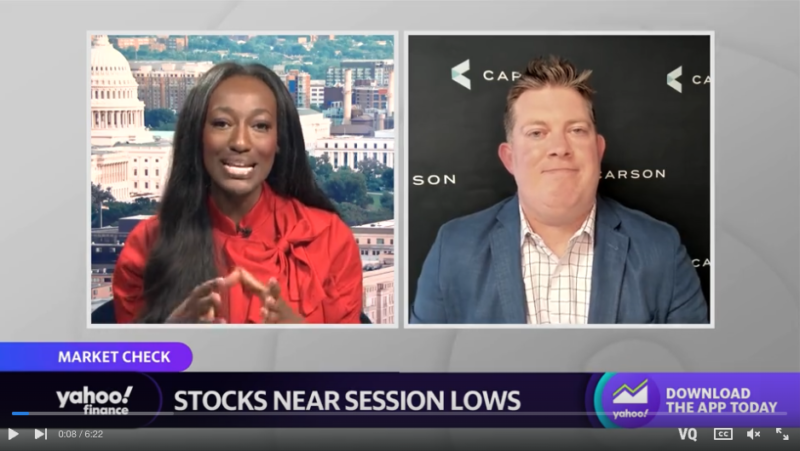
The catalyst was a softer-than-expected core inflation print. My colleague Ryan Detrick was on Yahoo Finance Wednesday, the day after the election. Markets were dropping amid the crypto mess and post-election uncertainty about the exact makeup of Congress. But, as he said,
“We need to see better inflation data. Maybe that starts tomorrow … we think it’ll come in better than expectations”
That’s exactly what we got yesterday, and markets were off to the races.
It just goes to show how much negativity and expected hawkishness from the Fed, has been priced in. A soft report was like a pressure release valve.
We Need Time, And The Inflation Data Bought Us Time
As I wrote yesterday, one month does not make a trend. But it’s still a very positive report. Several leading indicators of prices have been showing a deceleration in prices – we’ve written quite a lot about this (here and here). The official data is clearly lagging but the timing of the inflection point was uncertain. And it looks like we may have just gotten it.
This report is important for two main reasons:
One, the goods deflation we saw in October offset the upward pressure from strong services price increases, which is primarily rents. It effectively buys time for official rental data to catch up to the private data, which are showing a rapid decline in rents. Rents make up 40% of core inflation and so a deceleration would make a significant dent in inflation numbers. But it’ll take several months to show up.
Two, it buys time for the Federal Reserve (Fed). If this was yet another hot inflation print, that would have put enormous pressure on the Fed to go for a 75 bps (0.75%) increase in December. But now, it looks like a 50 bps increase is the most likely scenario, assuming the November CPI report doesn’t surprise us by coming in hot. Investor expectations have shifted significantly. The probability of a 50 bps hike has gone from a near coin flip (57%) to 85%.

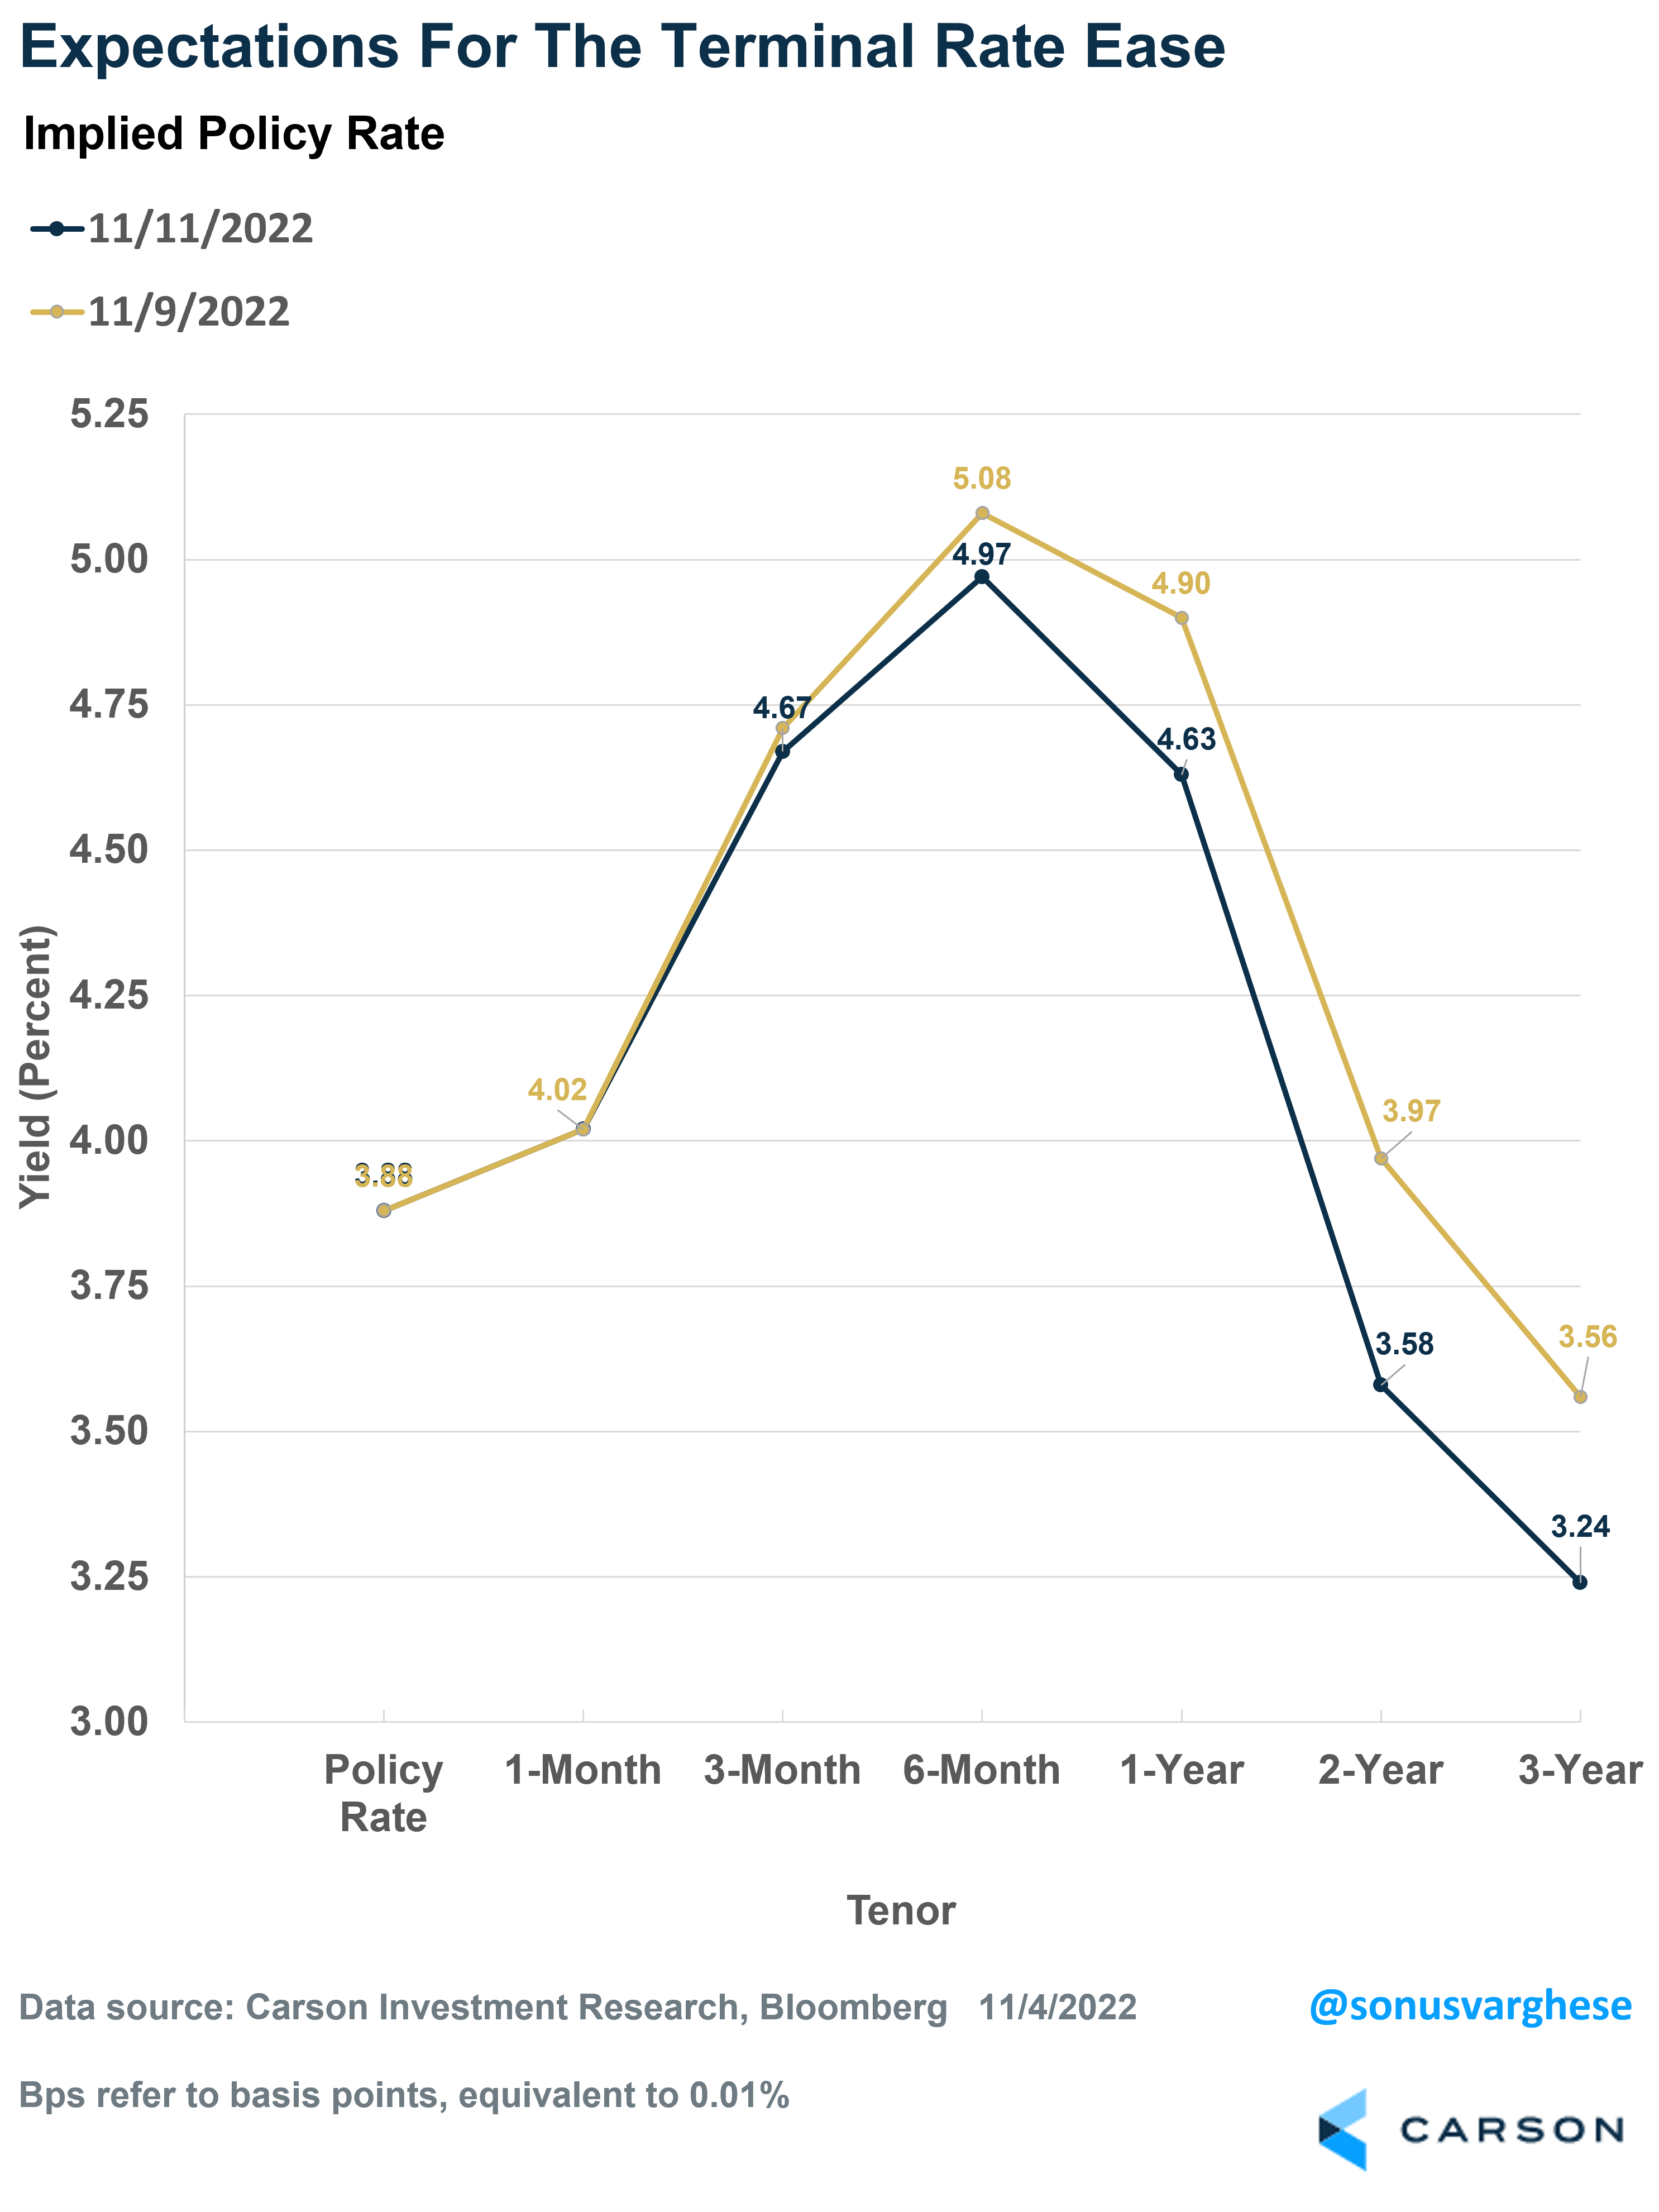
An interesting point Fed Chair Powell made last week was that slower inflation data is not a pre-condition for stepping down the pace of rate hikes. Instead, it’s the terminal rate that matters – the terminal rate is the highest rate the Fed will hike up to this cycle, and in their September meeting, they released projections estimating it to be around 4.6%. Markets have been expecting this number to move close to 5% when the Fed releases new projections at their December meeting. If the October inflation numbers had come in hot, there would have been a lot of pressure on Fed officials to take the terminal rate projection well above 5%. But this report eases that, and investors are currently looking at a terminal rate just shy of 5%.
We also saw a marked downshift in policy rate expectations 1-3 years from now. That kind of makes sense. If inflation decelerates quickly, then rates don’t have to be as high as previously expected. Of course, there’s a lot that will happen between now and then. This is why it’s probably better to focus on the near term as far as investor expectations go, and the same for Fed projections. They can change a lot.
We’ve had a big week with some major events, including the Midterm elections and the crypto mess. But we were once again reminded that the over-arching concern right now is what the Fed does, and for that, look to inflation.