
Talk about a mixed picture from the October payroll report. Two headline numbers stand out:
- Nonfarm payrolls rose by 261,000 in October, more than an expected increase of 200,000
- The unemployment rate rose to 3.7%
The first headline suggests that employment is strong, and the economy is resilient to higher interest rates, so far. This means we could see the Federal Reserve (Fed) push interest rates even higher than what’s currently expected. The logic is: strong employment = more incomes = more spending = persistent inflation. And so more rate hikes are needed to reverse this process.
The second headline suggests the labor market is weakening. This means the Fed should be on track to pause soon, as weak employment should eventually result in lower inflation.
Which number do you believe?
Well, what’s important to understand here is that the two headline numbers I quoted above come from two different employment reports. If you didn’t know there were two employment reports, well, now you do.
One is the so-called “establishment survey,” and that is where the nonfarm payrolls data (along with hours worked and wages data) come from. It’s a survey of about 131,000 non-agricultural businesses and government agencies, representing about 670,000 worksites.
The other survey is the “household survey,” and that is where the unemployment rate comes from, along with several other ratios, like the “labor force participation rate” and the “employment-population ratio”. It’s a survey of about 60,000 households and gathers information on employment, unemployment, and other labor force-related data (e.g. age, education, part-time/full-time jobs, etc.).
The household survey is smaller than the establishment and as a result, the numbers tend to be more volatile. It tends to be more useful for tracking ratios like the unemployment rate and another advantage is that it doesn’t get revised. The establishment data can get revised, and we’ve seen large revisions to payrolls in the past – typically, well after the fact though (like years).
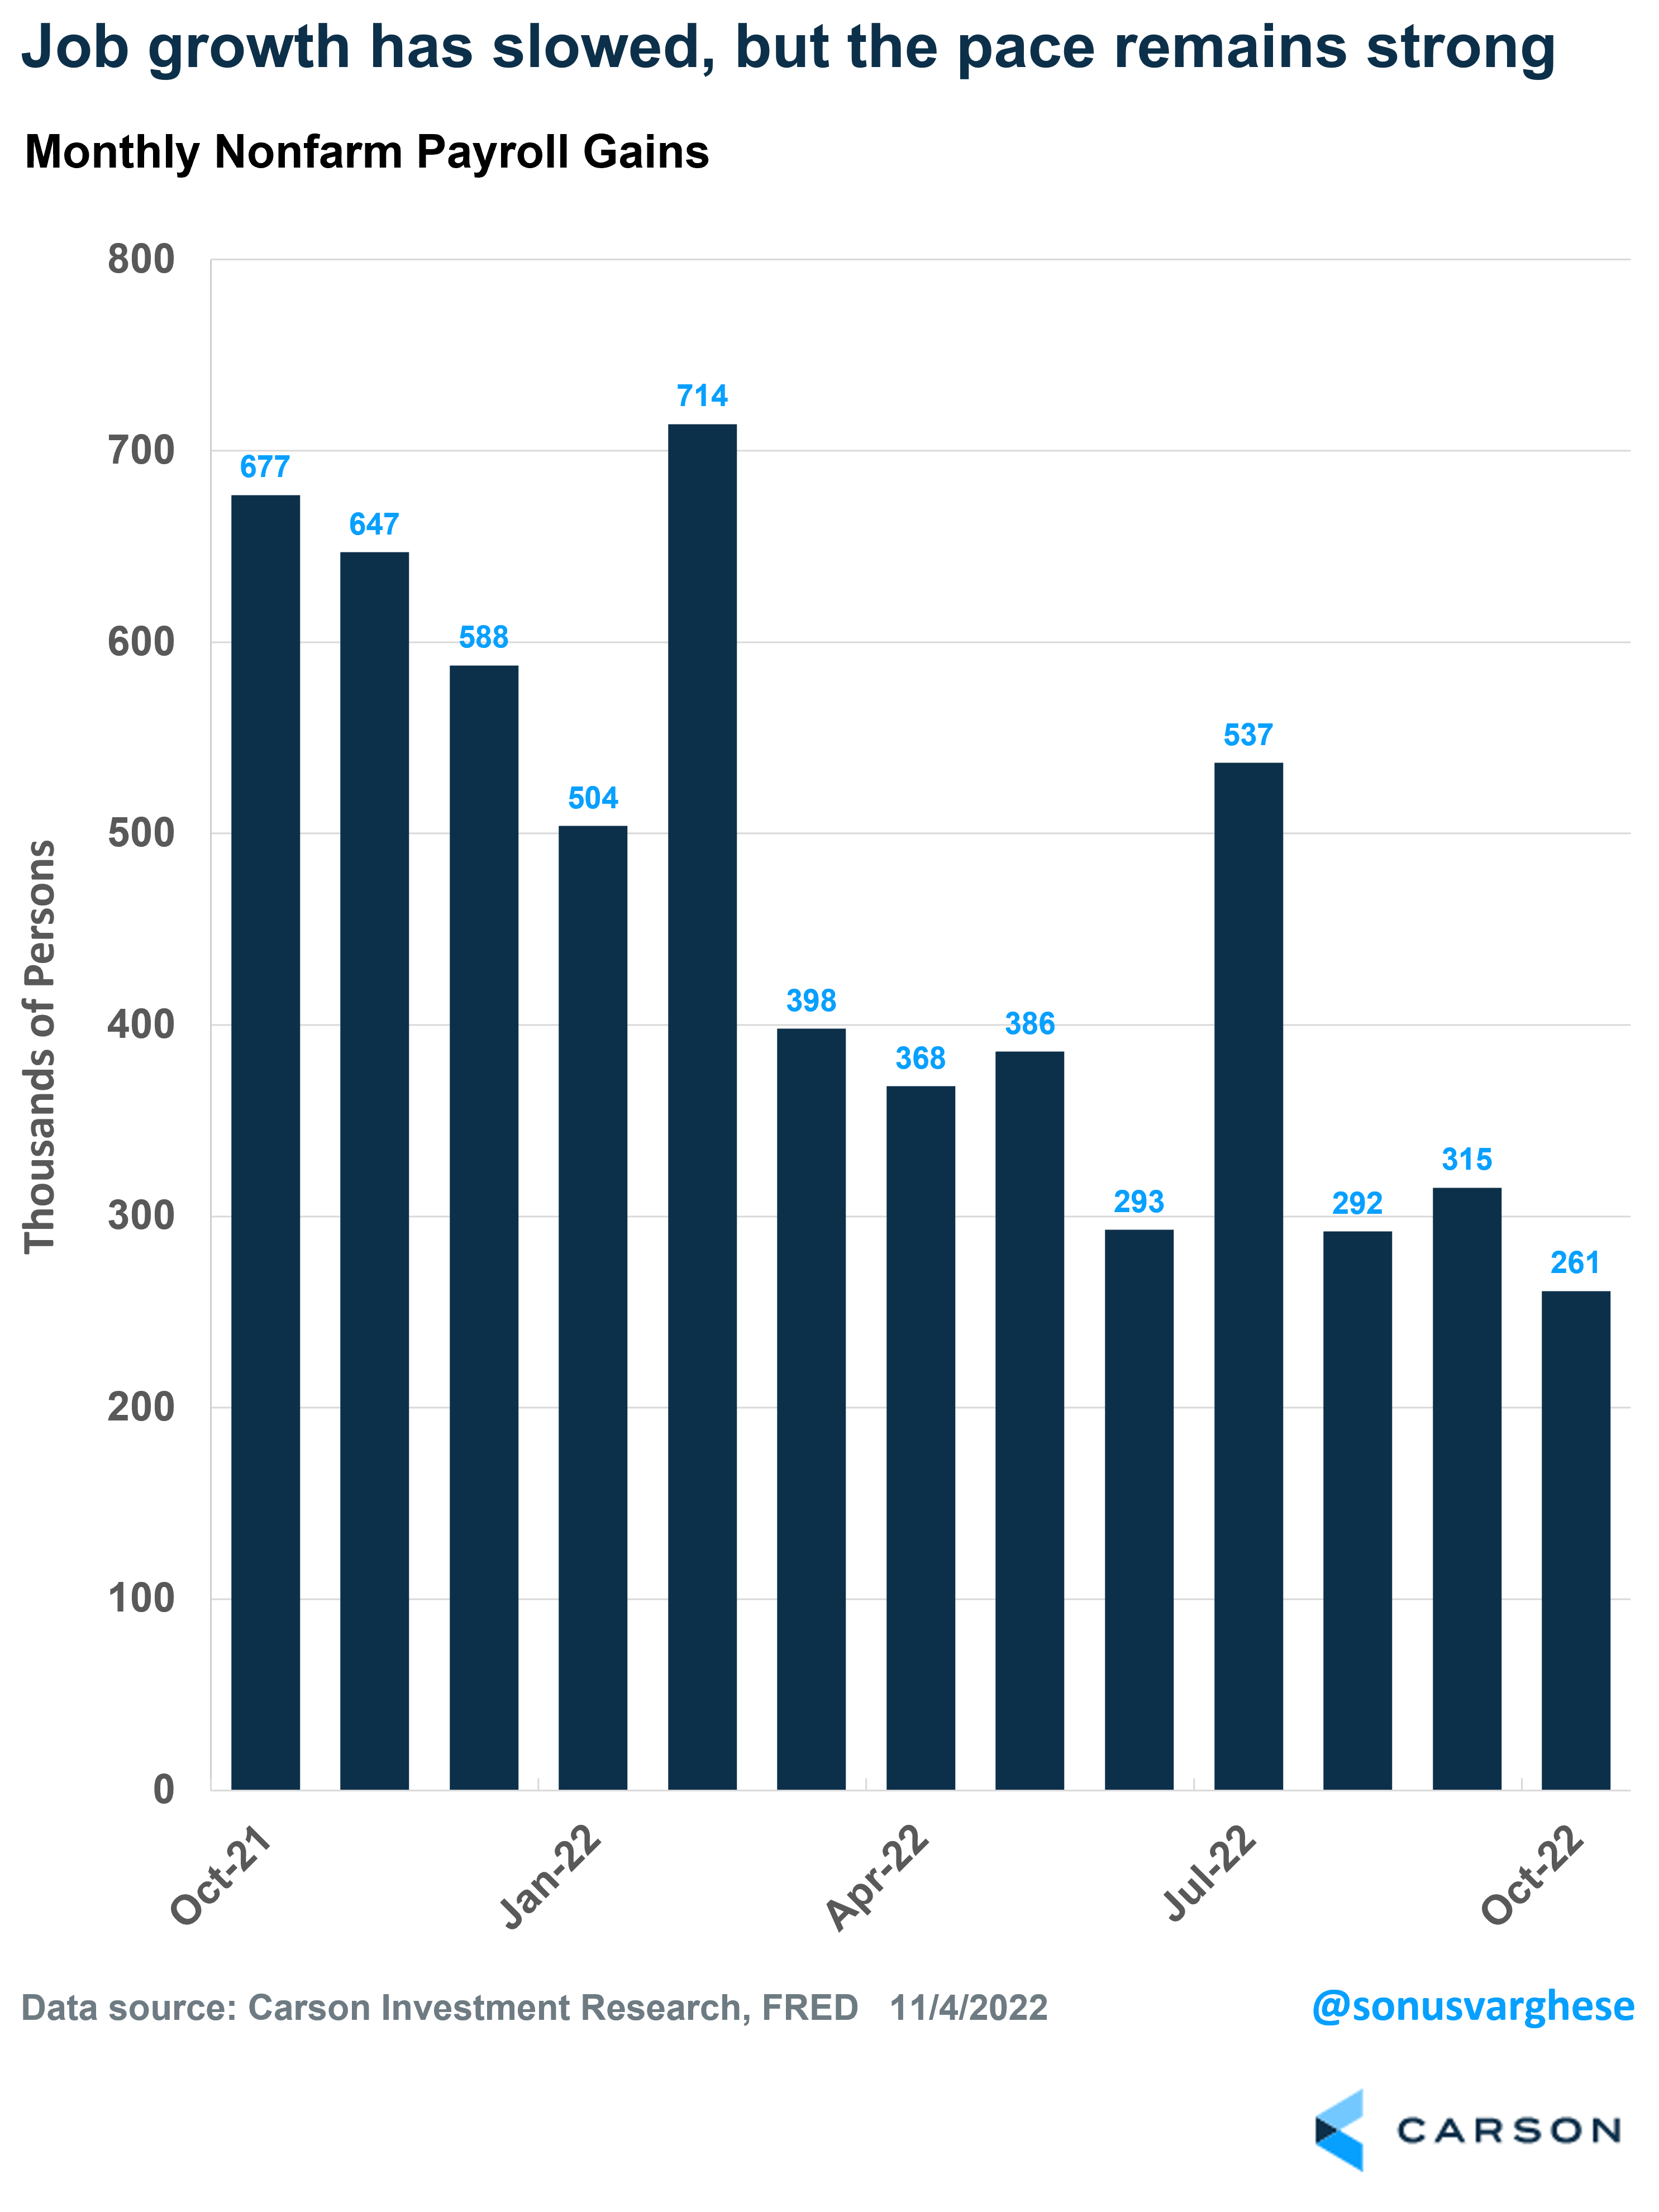
Coming to the October data, the unemployment rate rose because the household survey showed that the number of unemployed persons rose. The survey also showed that the number of employed workers fell by 328,000, which is the opposite of what the establishment report showed (+261,000). That’s a massive difference of almost 600,000. But this is not unusual as the chart below illustrates.

As you can see, the difference between employment gains reported by the two surveys was larger in April and June of this year. In April, nonfarm payrolls rose by 368,000 while the household survey reported employment fell by 353,000. In June, nonfarm payrolls rose by 293,000 but the household survey saw employment falling by 315,000. But it goes the other way too. In January, the household survey saw employment rise by 1.2 million, while nonfarm payroll rose “only” 504,000.
Ultimately, what’s key is that over time, both surveys reveal a similar picture.
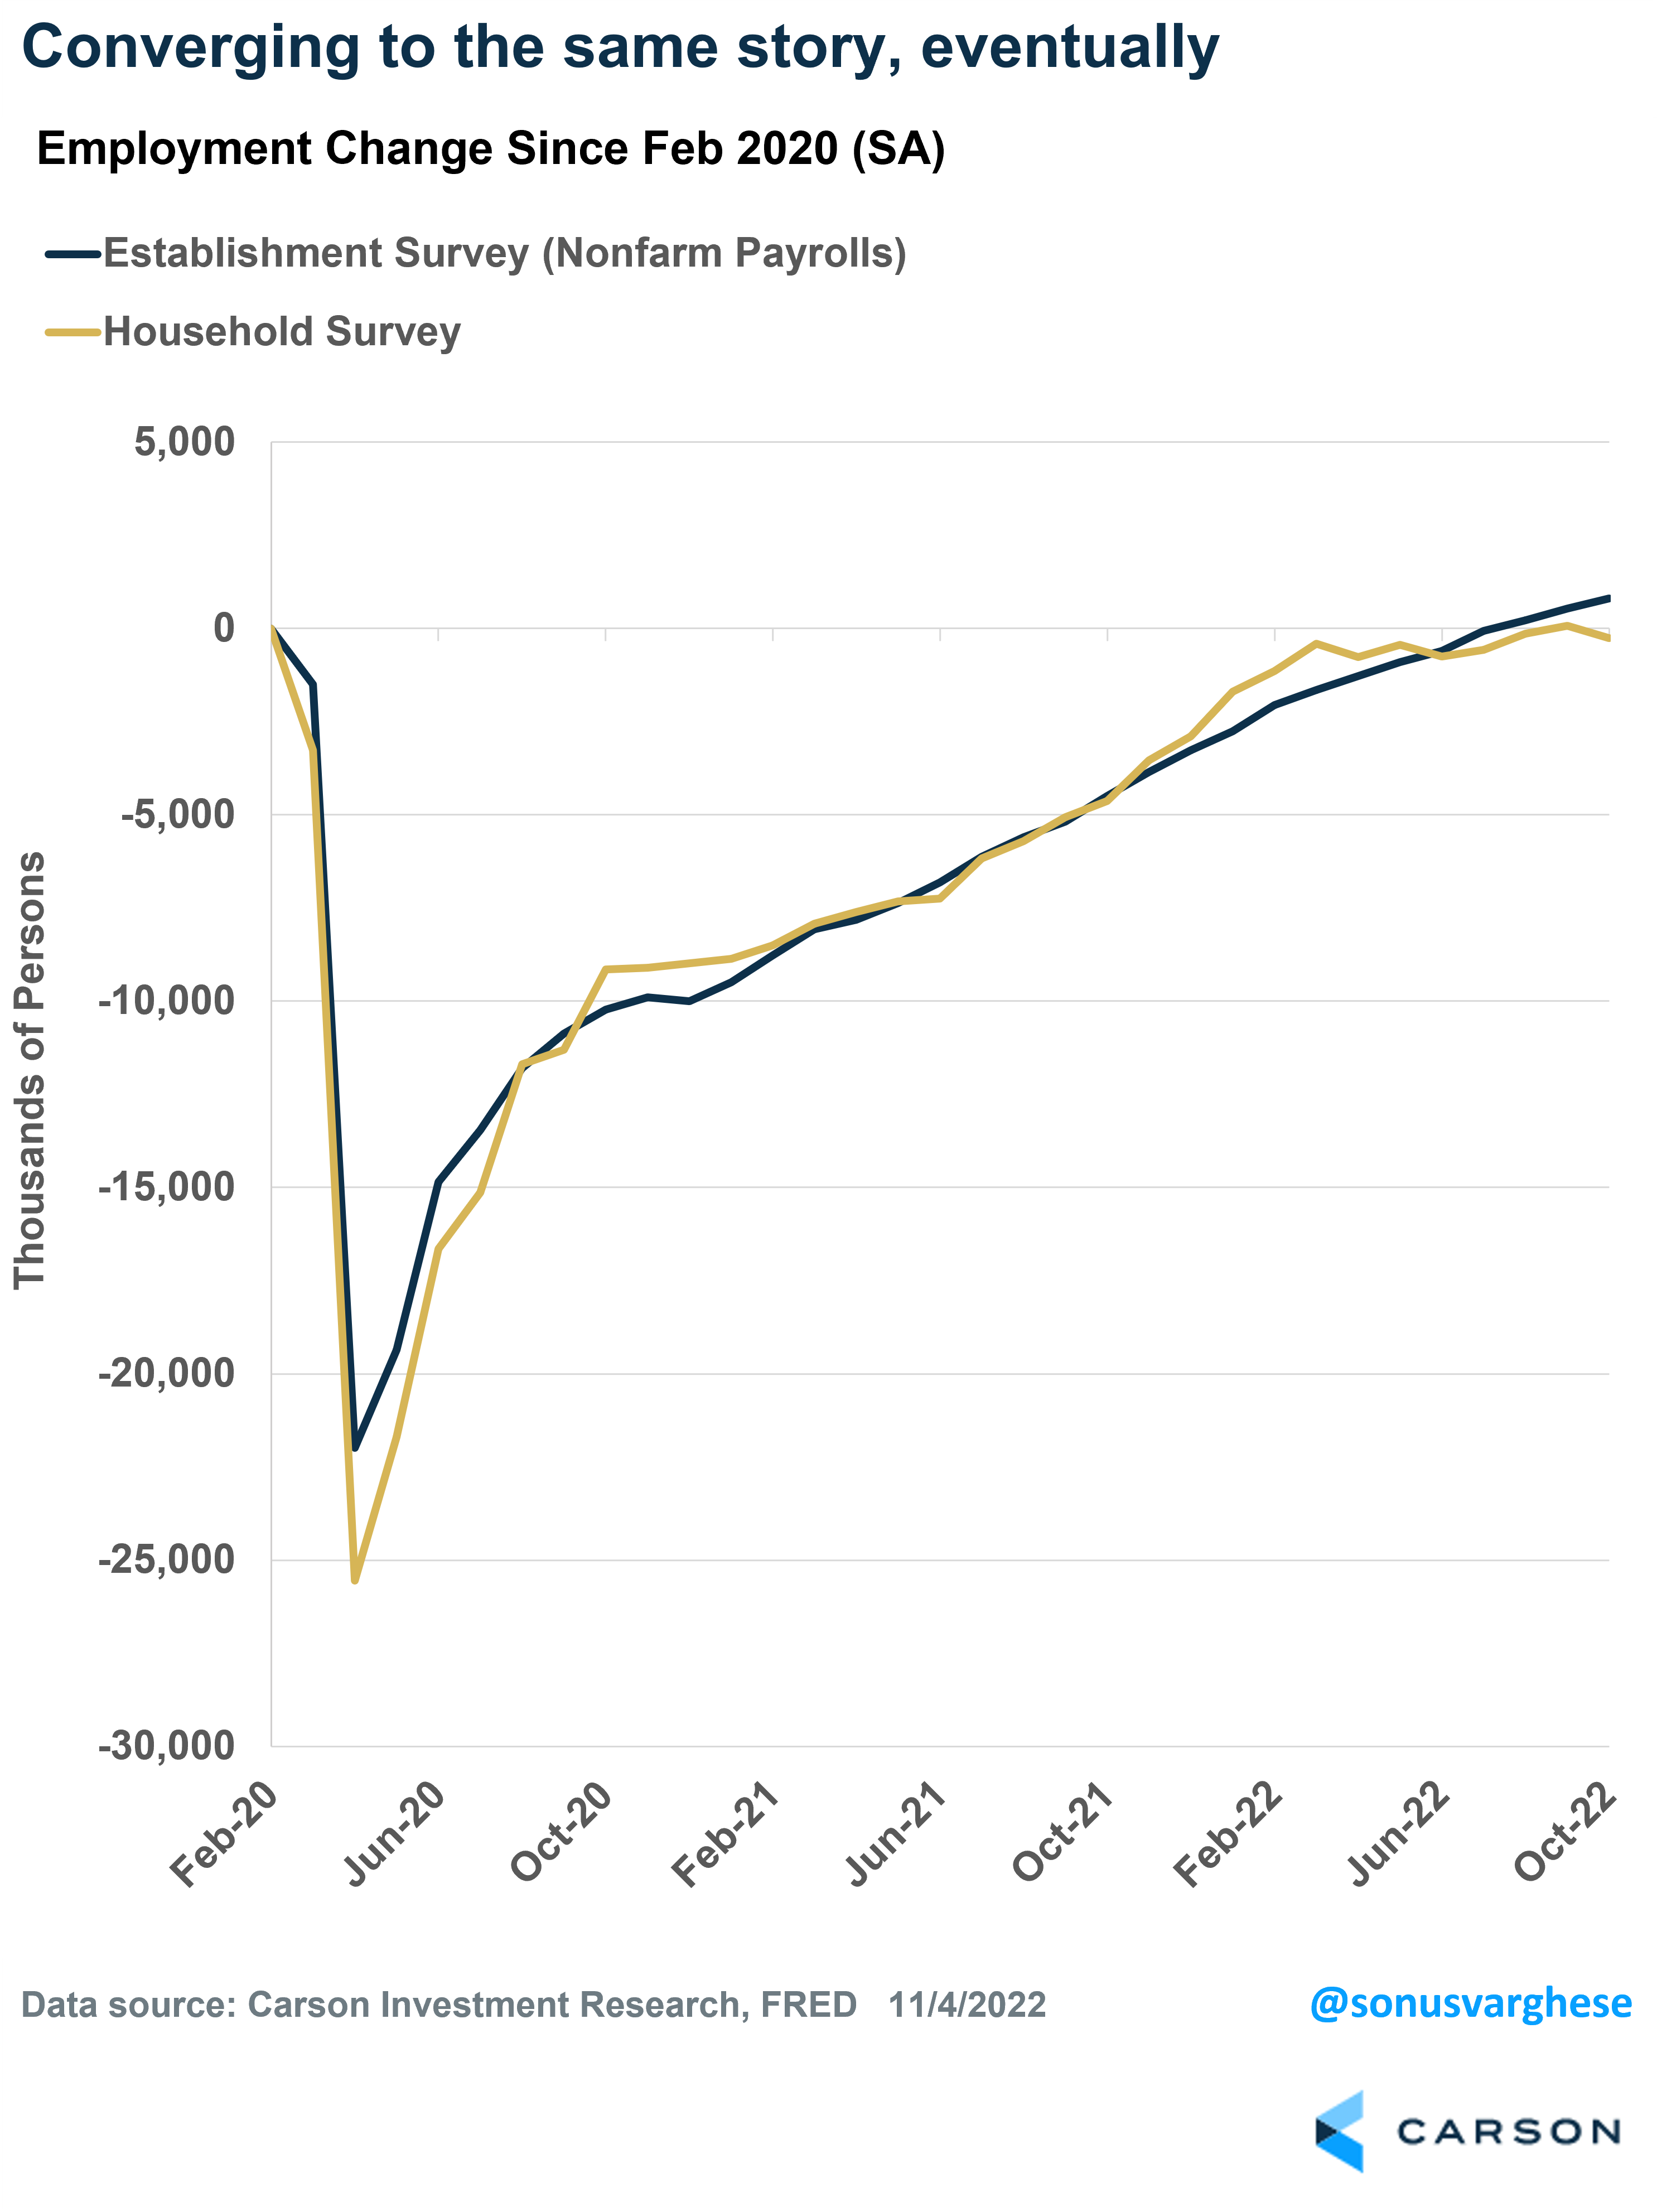
Obviously, over short periods, one survey can accelerate much faster than the other. During the height of the pandemic (Mar-Apr 2020), the household survey reported significantly more job losses than the establishment survey: 25.5 million vs 22 million. But the household survey caught up and even ran ahead of the establishment survey through January of this year. But now the establishment data is powering ahead while the other slows.
So, is the job market weak or not?
That’s the big question. Given the volatility of the numbers in the household survey, I tend to put more weight on the establishment data, with the caveat that establishment payroll data can be revised – though markets (and the Fed) react to current data.
A more nuanced view is that the employment situation is clearly slowing. But 261,000 jobs created in a month is still very strong. In fact, over the 20 years through 2019, a period that covered two economic expansions, the average monthly job gains in months when payrolls grew, was about 182,000. And over the 3 years prior to the pandemic (Mar 2017 – Feb 2020), payroll growth averaged about 186,000 per month.
Now, the unemployment rate has increased to 3.7% but one month does not make a trend. We saw the same thing a few months ago in August, when the unemployment rate rose from 3.5% to 3.7%, before falling back to 3.5% in September.
What matters is wage growth (for the Fed)
A key piece of information in the payroll reports these days is average hourly earnings. As I wrote at the top of the post, this is the mechanism through which the Fed believes they can (and need to) pull down inflation. From their perspective, weakening the labor market should reduce income growth, and that should ultimately reduce spending power and inflation.
We’re seeing wage growth in a clear downtrend. Average hourly earnings ticked slightly higher for private workers last month, but over the past 3 months it’s grown at an annualized pace of 3.9% – well below the pace we’ve seen over the past year, and not much above the 3.1% pace we saw pre-pandemic. In fact, for production and non-supervisory workers, who tend to spend more of their incomes, the 3-month pace of wage growth has fallen to 4.3%, down from 7.5% at the end of last year and getting close to the pre-pandemic rate of 3.4%.
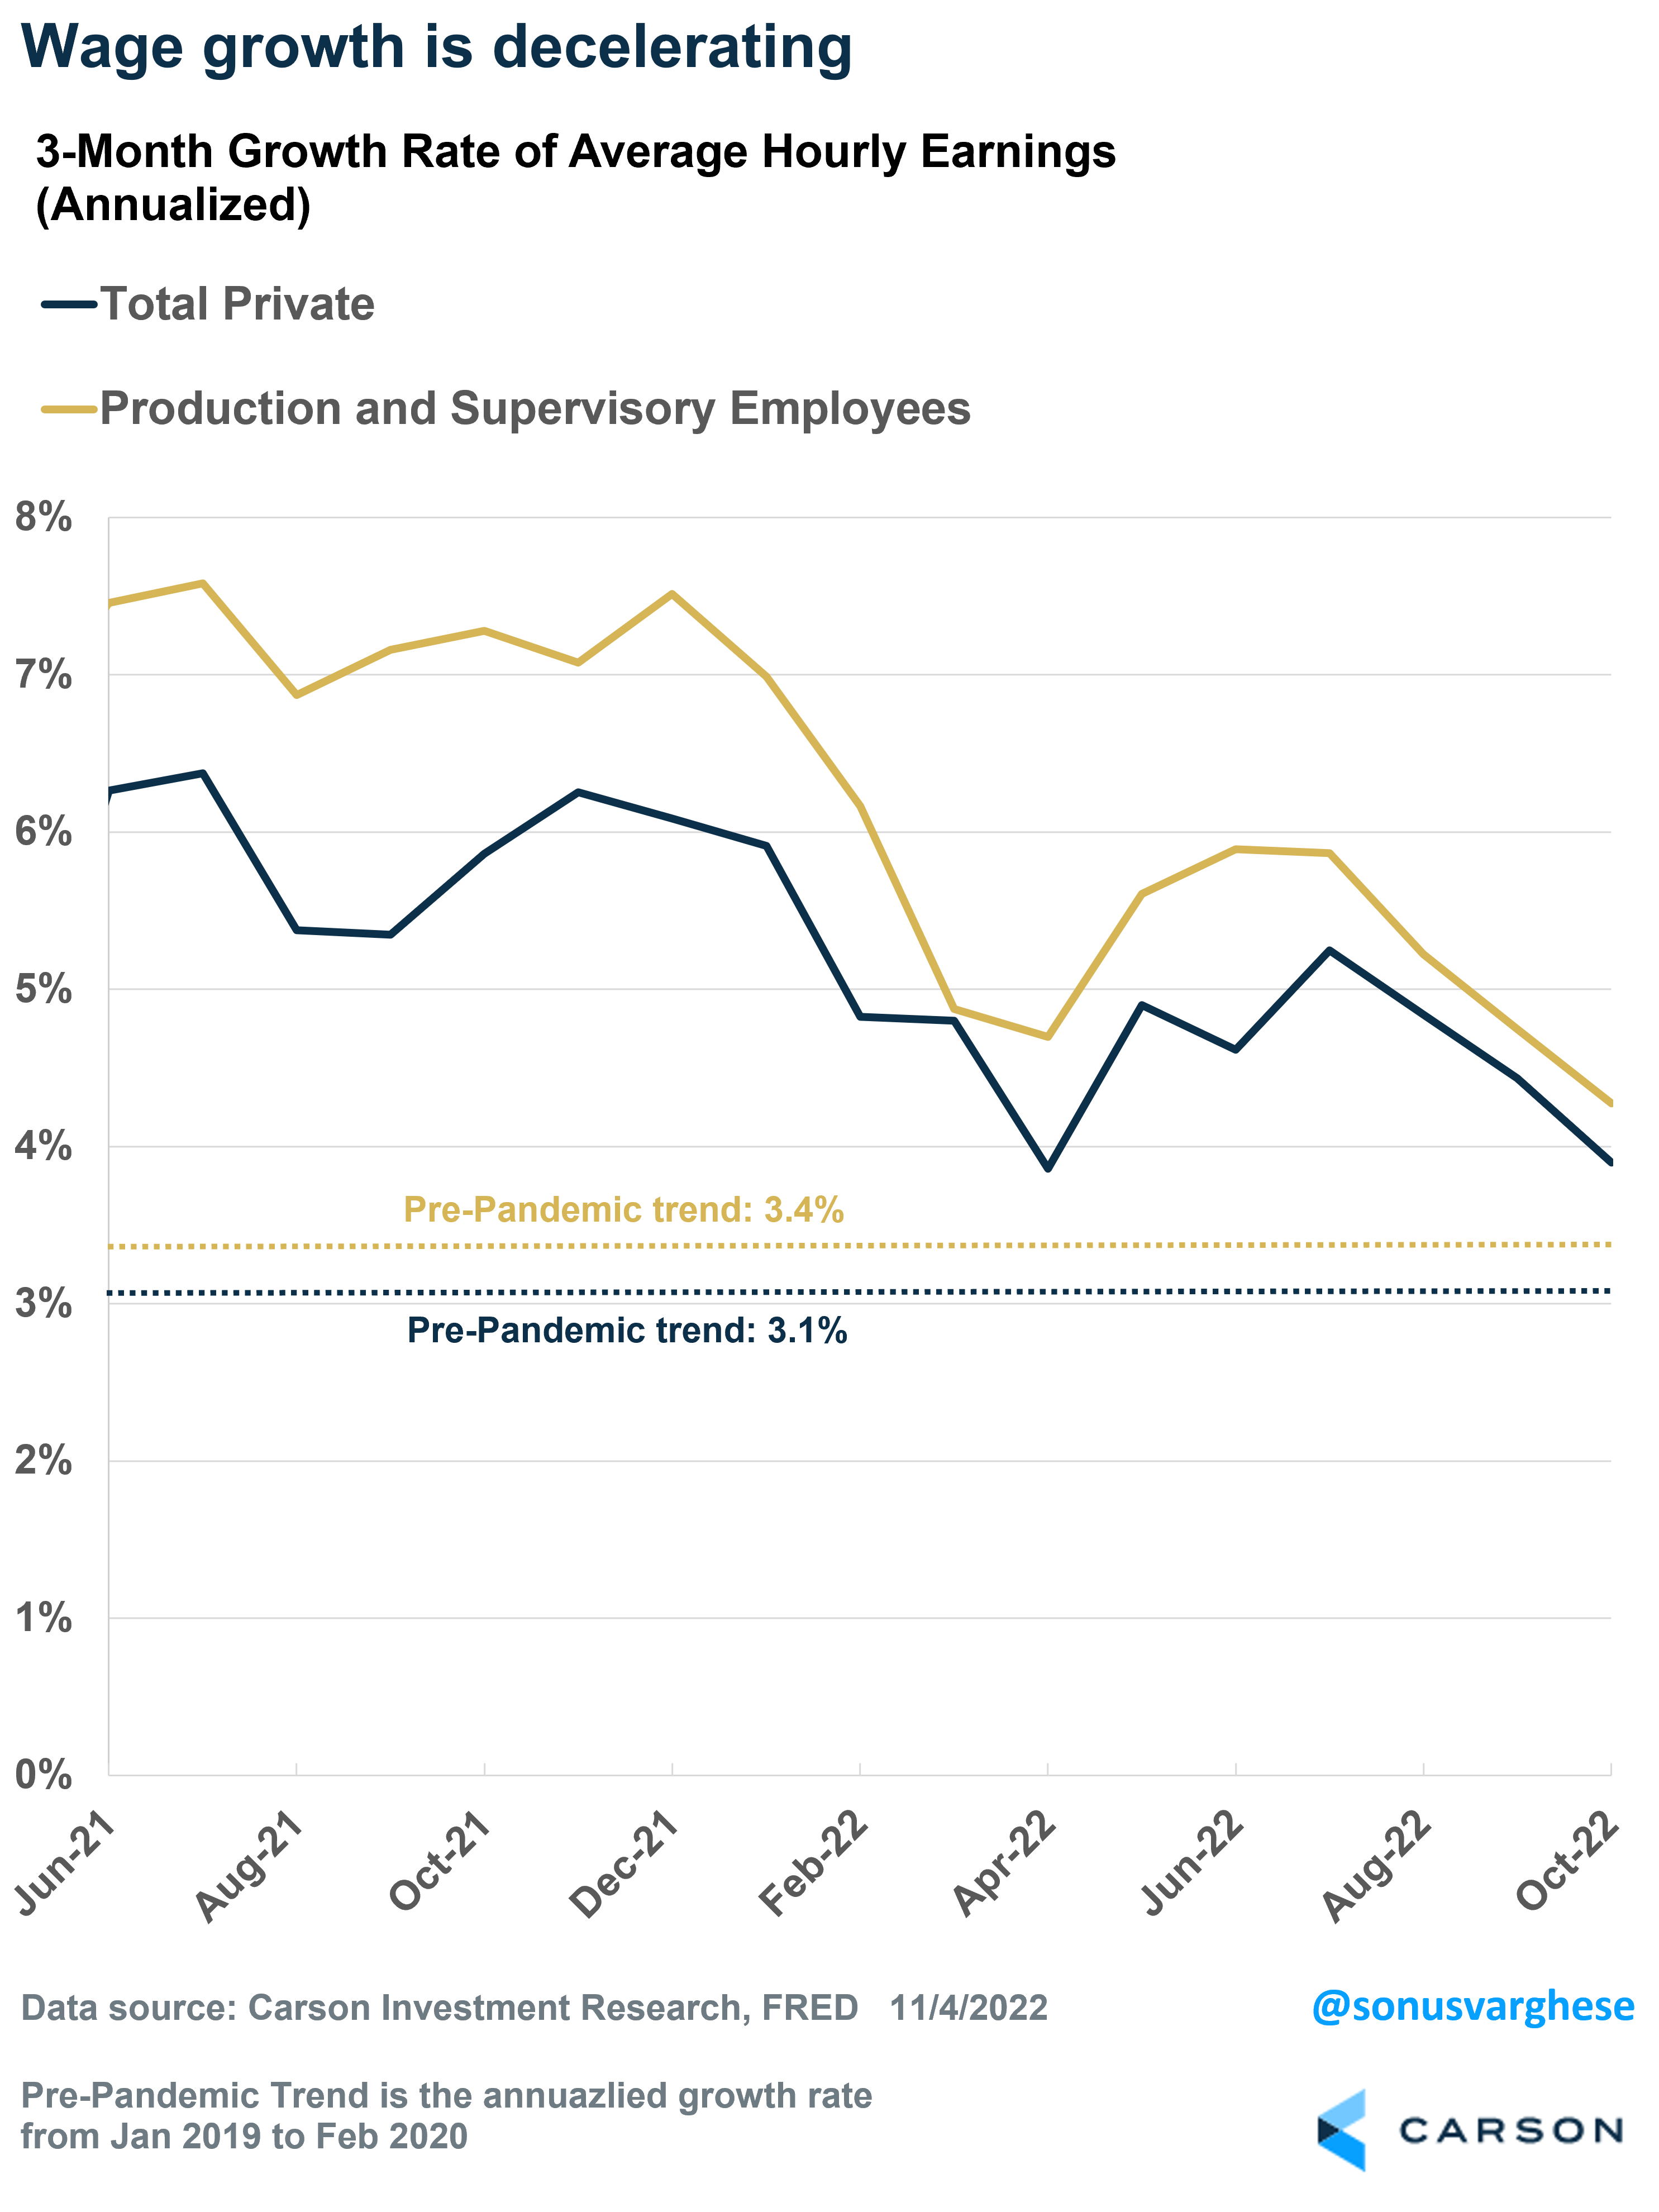
The good news is that wage growth appears to be slowing even as employment remains strong. This is the “soft landing” scenario”: wage pressure and inflation easing without a breakdown of the labor market – which runs counter to what the Fed believes will (and should) happen. Hopefully, easing wage pressure means the Fed doesn’t have to ratchet rates higher and higher. We just need inflation to cooperate (and that depends on a lot more than wages currently).