
Today is the midterm elections and we’ve had many questions about what it all could mean for investors, which we’ll tackle in today’s blog. First things first, the Carson Investment Research team wants everyone to get out there and have their voice heard. It is a great honor to be able to vote for our future leaders, so go out there and do it!
2022 was one of the worst starts to a year ever for stocks, but we remain hopeful that a major low took place in the middle of October, which would be fairly normal given October’s propensity for being a bear market killer.
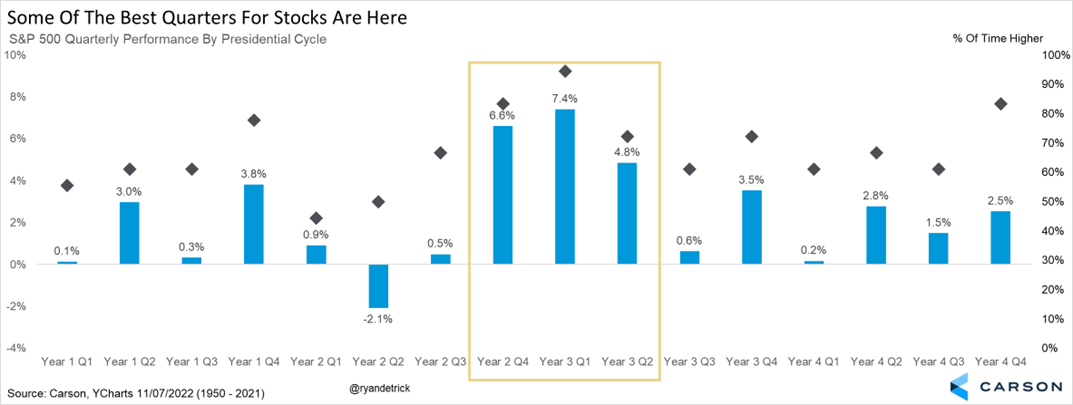
One of our favorite tables we’ve shared this year is right here. The first few quarters of a midterm year tend to be quite weak when looking at a 4-year presidential cycle, which played out all too well this year. The really good news is some of the best quarters are upon us, so don’t lose faith quite yet.
The Calendar Is A Tailwind
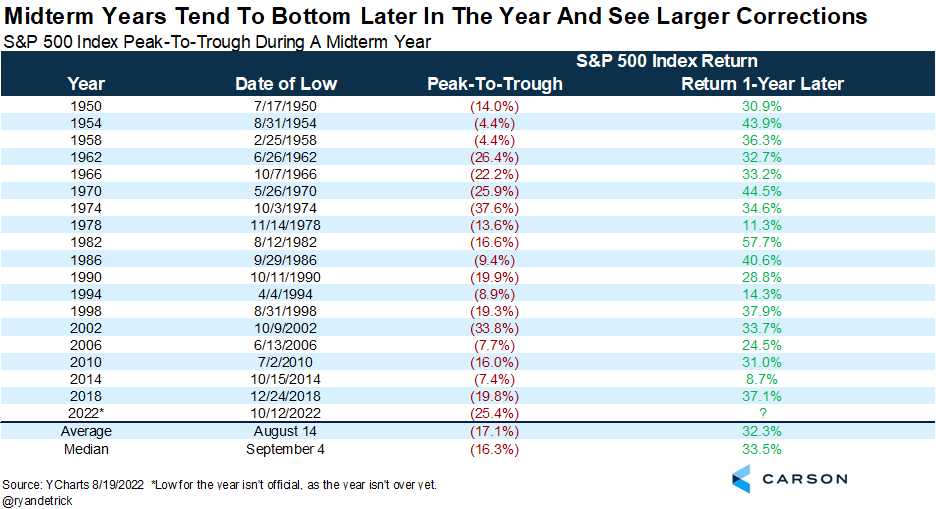
The average midterm year since 1950 corrected 17.1% on average, the most out of the four-year presidential cycle. That’s the bad news, the good news is stocks gained 32.3% on average a year off those lows and have never been lower. Although we don’t know if October 12 is officially the low or not (but we think it very well could be), there could be a lot of opportunity for bulls over the coming year.
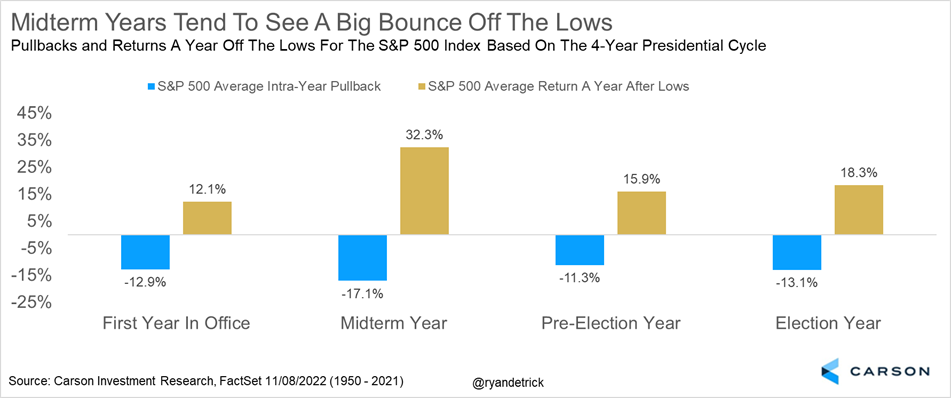
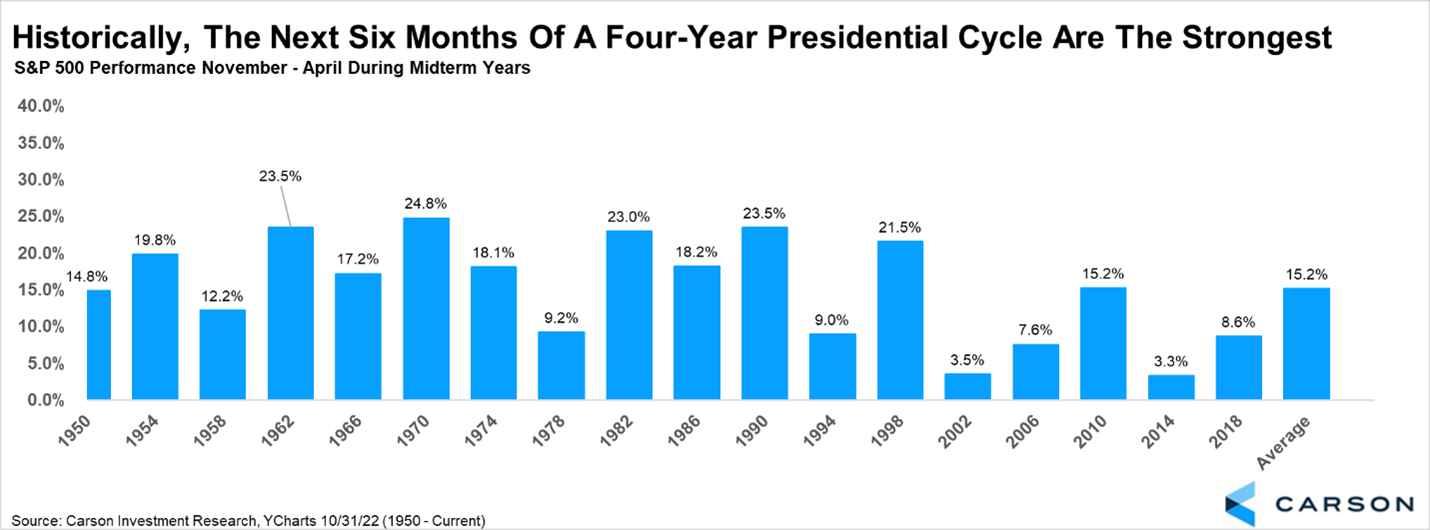
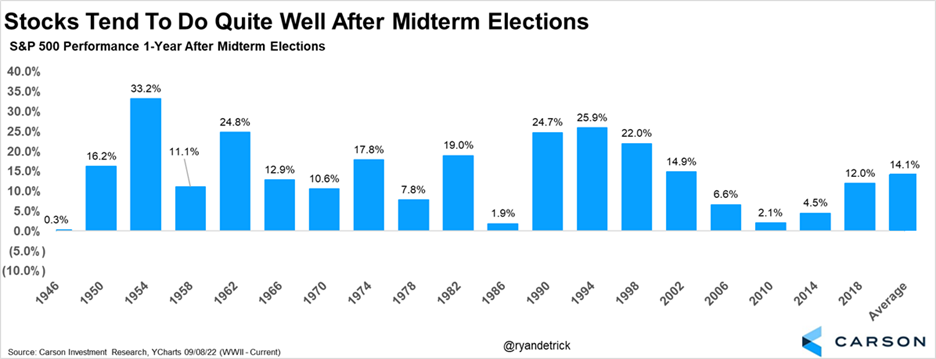
Here’s another look at the same thing, but breaking it down by each year.
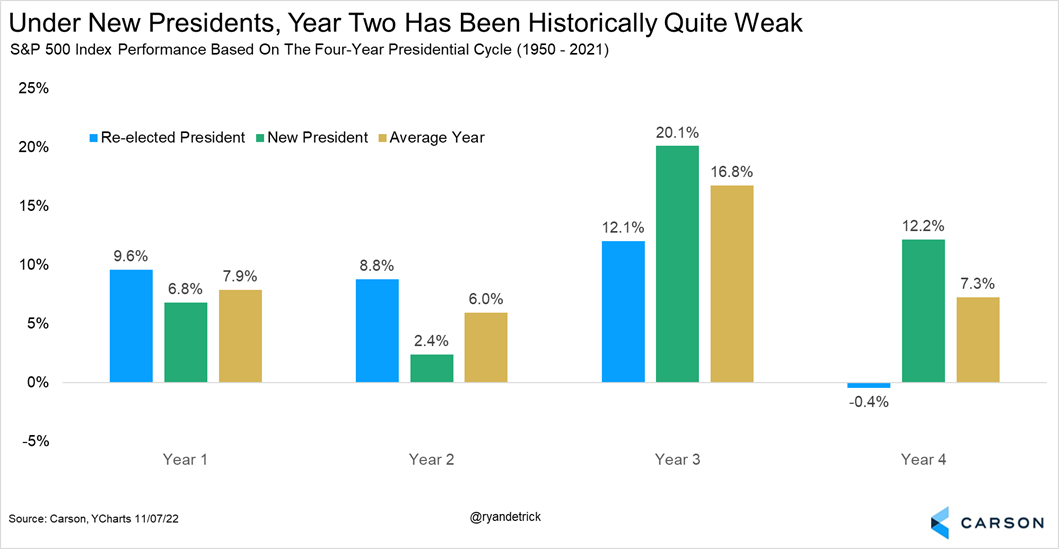
Should we be surprised that stocks have had a tough go so far in 2022? Maybe not, as this next chart shows the worst time for stocks is a midterm year under a new President. With the S&P 500 up only 2.4% on average these years, it helps put the disappointing year so far into perspective. Now check out what happens the following year, which might be something many investors could be smiling about soon enough.
One of the most well-known investor axioms is “Sell in May and Go Away,” as those six months are some of the worst of the year. It played out this year, but what we don’t hear nearly as much about is how well stocks tend to do from November through April. Sure enough, looking at those six months during a midterm year and we find that stocks have been higher the past 18 times.
Let’s Talk About the Election
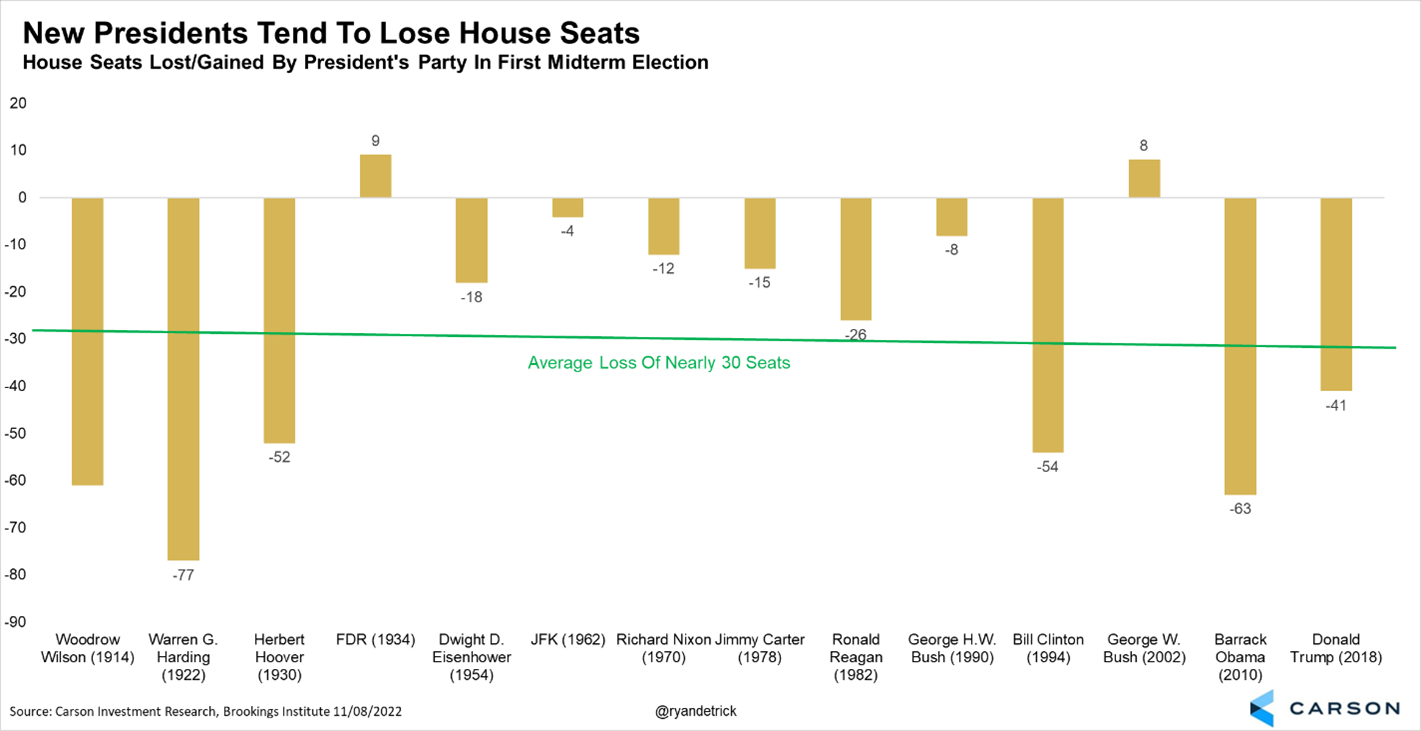
Historically the party that loses the election is the motivated party and they tend to gain seats in the House and Senate. In fact, since World War I, the winning party lost nearly 30 seats on average at the first midterm election. FDR during the Great Depression and George W. Bush (post-9/11) are the only two instances when the President’s party gained seats in the House. With the Democrats hanging onto a historically slim 5-seat margin, the odds do favor the Republicans taking the House.
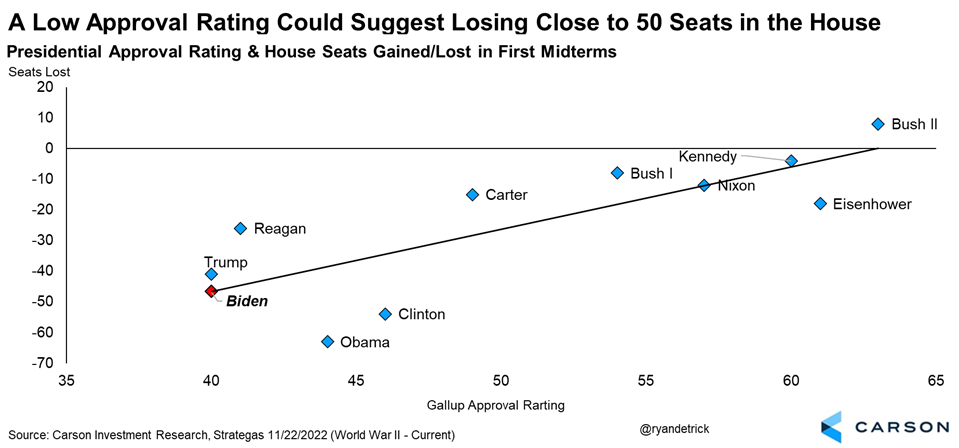
Please don’t shoot the messenger here, but President Biden’s approval ratings have been among the worst ever at this point of a new Presidency. His current Gallup approval rating of 40% extrapolates out to approximately a 50-seat loss in the House for the Democrats. This is more than we expect to be clear, but it is another clue that Republicans could take the House.
What does it mean for investors? Well, Republicans need to win only five seats to regain control of the House, which is quite likely at this point. The Senate is more of a coin toss, but history shows 4 seats have been added by the motivated party since World War II. With the Senate split 50/50 right now, this one is very close to call, but the Republicans could gain one seat and take full control of Congress.
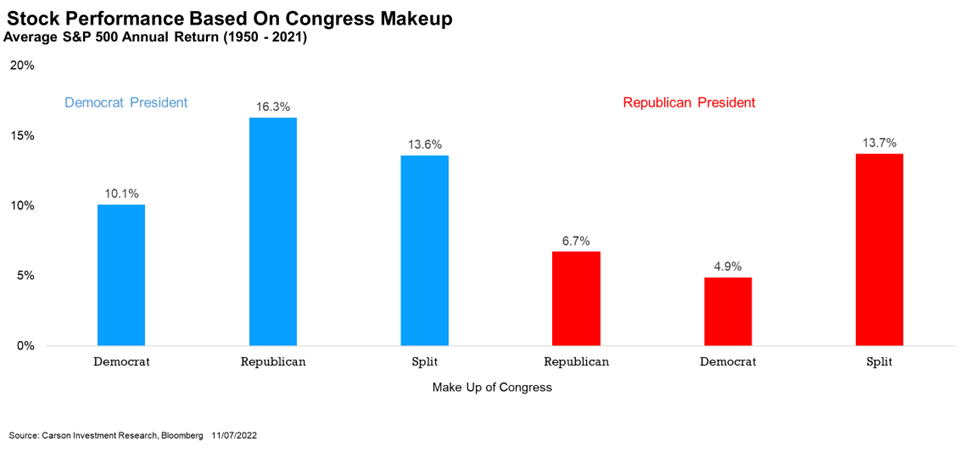
As the chart below shows, the very best scenario for stocks is a Democratic President and a Republican-controlled Congress. We saw this last take place in the late 1990s with President Clinton and that wasn’t the worst time for investors or the economy. Should the Democrats retain control of the Senate, that scenario of a Democratic President and split Congress is quite strong for stocks as well.
Leave On Some Good News
Odds are investors will start to hear a lot more about the midterm elections over the coming weeks. You might hear that these sectors will do well if so and so wins, or that these sectors will do poorly if this happens. The truth is no one really knows. After President Trump won in 2016 it was widely assumed coal and steel would do great, the opposite happened. Then under President Biden green energy was to do great and dirty crude and coal would struggle, again, the opposite has happened. We aren’t saying you shouldn’t think like this, it just isn’t so clear cut.
What is clear cut is stocks historically have done quite well the year after the midterms. As you can see in our last chart, the S&P 500 gained a year after the election every single time since World War II, with a very solid 14.1% average gain over that year. Why is this? Likely markets hate uncertainty and there is a lot of that leading up to a midterm election. But once the election is over the uncertainty is likely lifted.
So, there you have it. Midterm elections are very important for a lot of reasons, but the best part for investors is once the election is over, stocks tend to get a nice tailwind. On the Carson Investment Research team, we think this could happen once again, and this is one reason why we remain overweight stocks here.
For more on everything related to midterms, be sure to listen to our latest Facts vs. Feelings podcast, as Sonu and I have an amazing discussion with Libby Cantrill of PIMCO. She is one of the top political strategists on The Street and we were honored she sat down with us last week.
You can listen to the whole interview here.