
We live in an age with billions of points of data. As the world becomes more and more integrated, everything becomes the Internet of Things – even our bodies. With so many pieces of data demanding our attention, it’s hard to know which metrics deserve our focus.
Technology gives us an infinite amount of information available to us at any time – which can be both a blessing and a curse. Take your site’s Google Analytics, for example. The sidebar alone is enough to send an inexperienced site owner running for the hills.
 It’s time to get back to the basics if we want to find true success. Bounce rate, unique visitors, pages per session, average session duration, new vs. returning visitors, paid search vs. organic… It’s easy to get tangled up when you go down each of the analytics threads available today.
True success is about consistency over time. Often, if success is ambiguous, confusing or unattainable, it will just be forgotten. You could go a year into the future without a measurable level of success, when you could have spent that year collecting actionable data to help grow your firm. In all my years of marketing – whether it’s B2B (business to business) for firms like Orion, Wealth Access, LifeYield and the myriad of firms I’ve been able to serve in that space, or B2C (business to consumer) working with RIAs looking to build a consumer brand – there are three metrics that drive true success. You should think about and examine these metrics consistently. While full-time marketers often obsess over these numbers daily – sometimes multiple times a day (I know I do) – It’s probably more realistic for advisors to look at them on a weekly basis.
1. Traffic
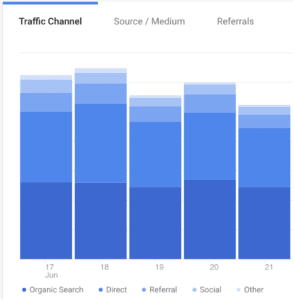
The first metric is traffic, or inbound awareness. How many people are coming to your landing pages, website and offers? What is the volume of that traffic per day? Compare that trend to a prior period, whether it’s the last month, the last day, the last week or the last year at this time. What does the trend look like between then and now? Now looking inside of that traffic, it’s important to look at sources. Where did they come from? What percentage came from social media or paid media? What percentage is organic? How many are referrals from another industry website or center of influence? Getting clarity on all of that is key.
Where to Find Your Traffic Numbers
This one can be found easily in your Google Analytics account. Traffic is one of the most important metrics, so Google put them right in the Home area. (Still need to set up your Analytics account? Check out Hubspot’s easy guide to getting up and running.) 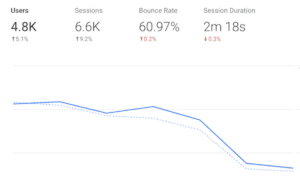 And if you scroll down just under the main Traffic tile, you’ll see the Sources info:
2. New Contacts
The second most important metric is your new contacts, or leads. Ideally, these are going to be people inside of your target audience. These contacts are people that would potentially be or will become ideal customers throughout the process. And it’s not just about the number of new contacts. Of the number of people hitting your website, what percent of them become new contacts? Is that ratio holding true over time? Is it improving? Ideally, that is what conversion optimization does. It helps us identify the friction between a visitor hitting a landing page and then giving you their information to become a contact. So, how is that ratio doing? Is it improving? Is it healthy versus industry norms? How is it trending versus prior periods? Hopefully your ratio is improving, but it’s not a guarantee, so you’ll want to keep an eye on this one.
3. New Clients
The last metric takes it a step further by measuring how many of your contacts go on to become new clients. With all three of these metrics, we’re really just running ratios all the way up and down:
- traffic:new contacts
- new contacts:new clients
What does all of this information really look like? HubSpot is a great example of a program that will help you track and report this type of data. Google Analytics can do it, too, if you properly configure it (which most people haven’t). Last week I spoke to a room where only four out of the 100 people said they had set it up at all. Configuration is probably more important than anything else. All of these efforts are great, but if you can’t actually quantify success, your odds of continuing down that path are next to nothing. Take the time to configure your metrics. Live in those metrics and think about them in the same way as you would think about checking the markets for the day. Even if you’re somewhat of a passive manager, you’ll want to keep an eye on this data as it is valid and relevant in helping you plan for long-term growth. That moment in the day when you’re locked into a plan matters. Be sure to use that time – and data – to help you evaluate, improve and make changes in the right way.
We at Carson use an approach called IDC, which stands for Improve, Develop and Change. These are metrics that grow firms and businesses all the time, and it’s worth investing your time and interest into so you can have success and provide that information back to others.