
Inflation has been top of investors’ minds this year, especially since it’s resulted in the most aggressive rate hike cycle in four decades. Since the beginning of the year, many people (including me) thought it would be simply a matter of time before inflation starts heading back to earth.
But it was not to be. We got an energy price spike after the Russian invasion of Ukraine, goods prices stayed stubbornly high, and rents kept accelerating. The energy price spike panicked the Federal Reserve into abandoning forward guidance and moving to 75 bps rate increases in June. We got a false respite in July, with inflation data coming in weak, but that didn’t last. We subsequently got another three consecutive 75 bps rate hikes across July, September, and November.
The October inflation report was very encouraging, as I wrote when it was released a month ago. We got goods deflation, but obviously, one month did not make a trend. Well, with the November report, we can say we (potentially) have the making of a trend.
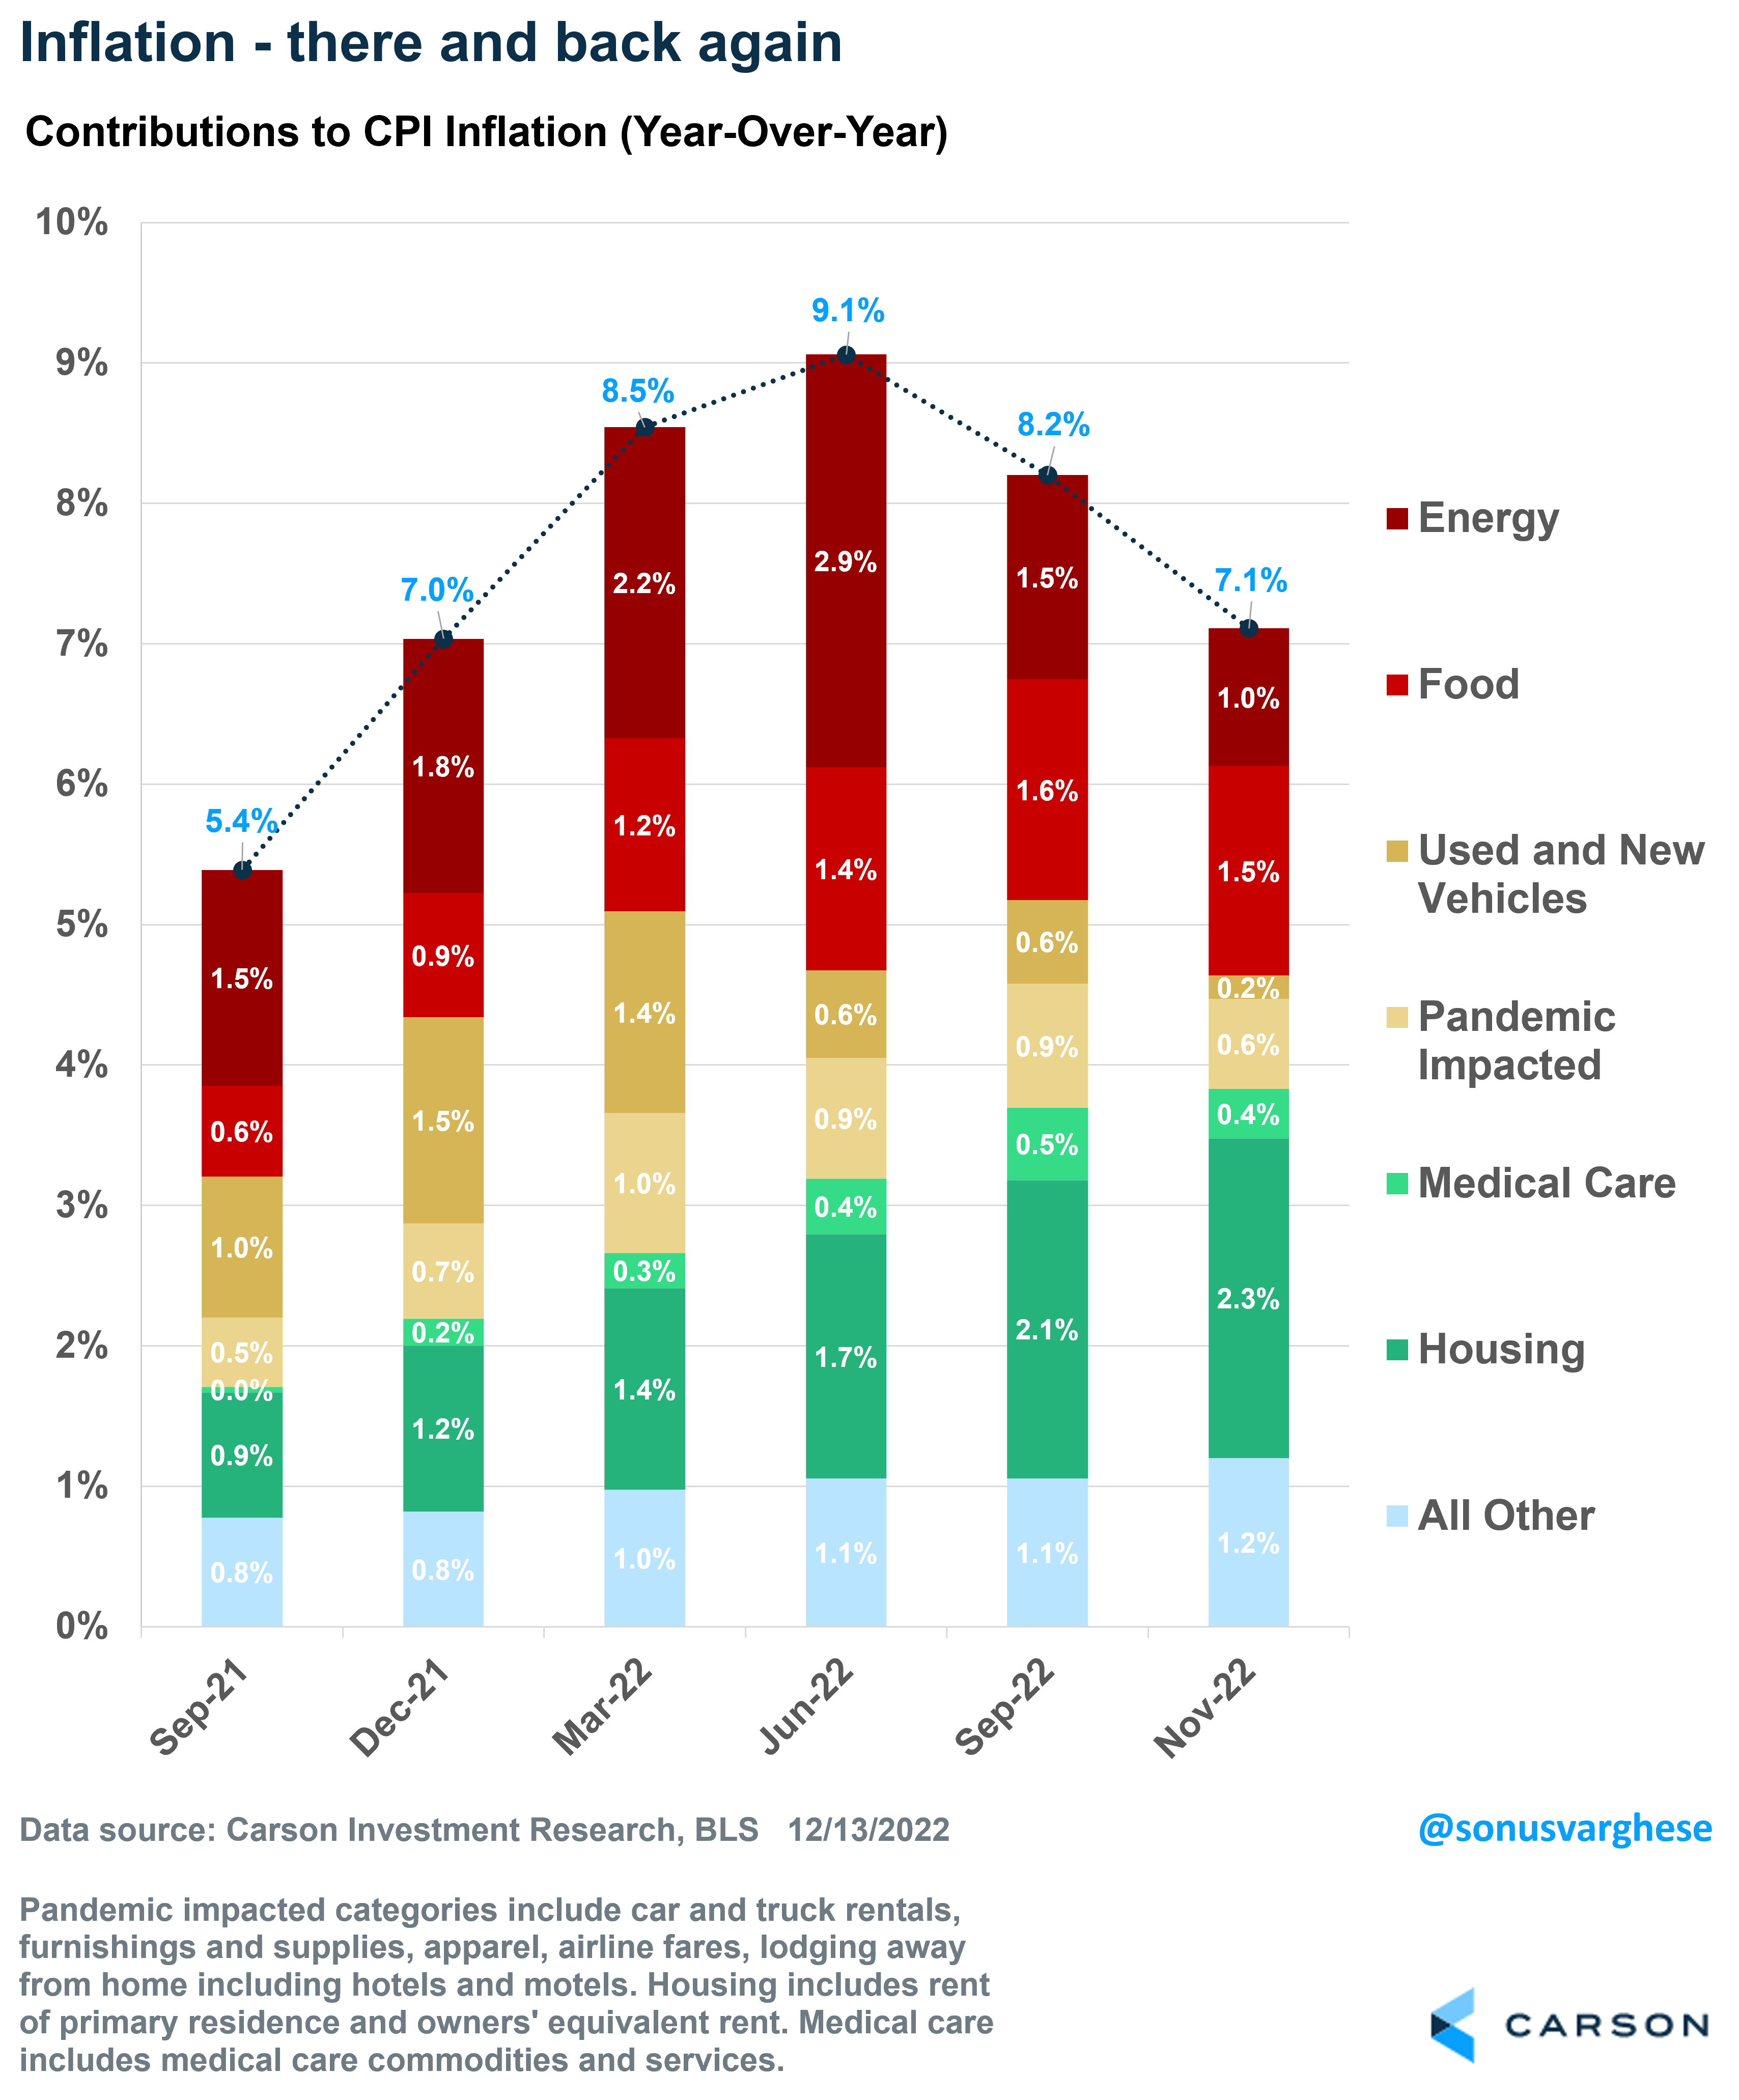
Headline inflation rose 0.1% m/m, below expectations for a 0.3% increase and a deceleration from October’s 0.4% increase. The big reason was energy prices, with pump prices falling 2% and prices for utility gas services falling 3.5%. Headline inflation has now pulled back from 9% in June to 7.1% as of November, which is where we were at the end of 2021. And as you can see below, the big reason for the pullback has been falling energy prices (the dark red bar).
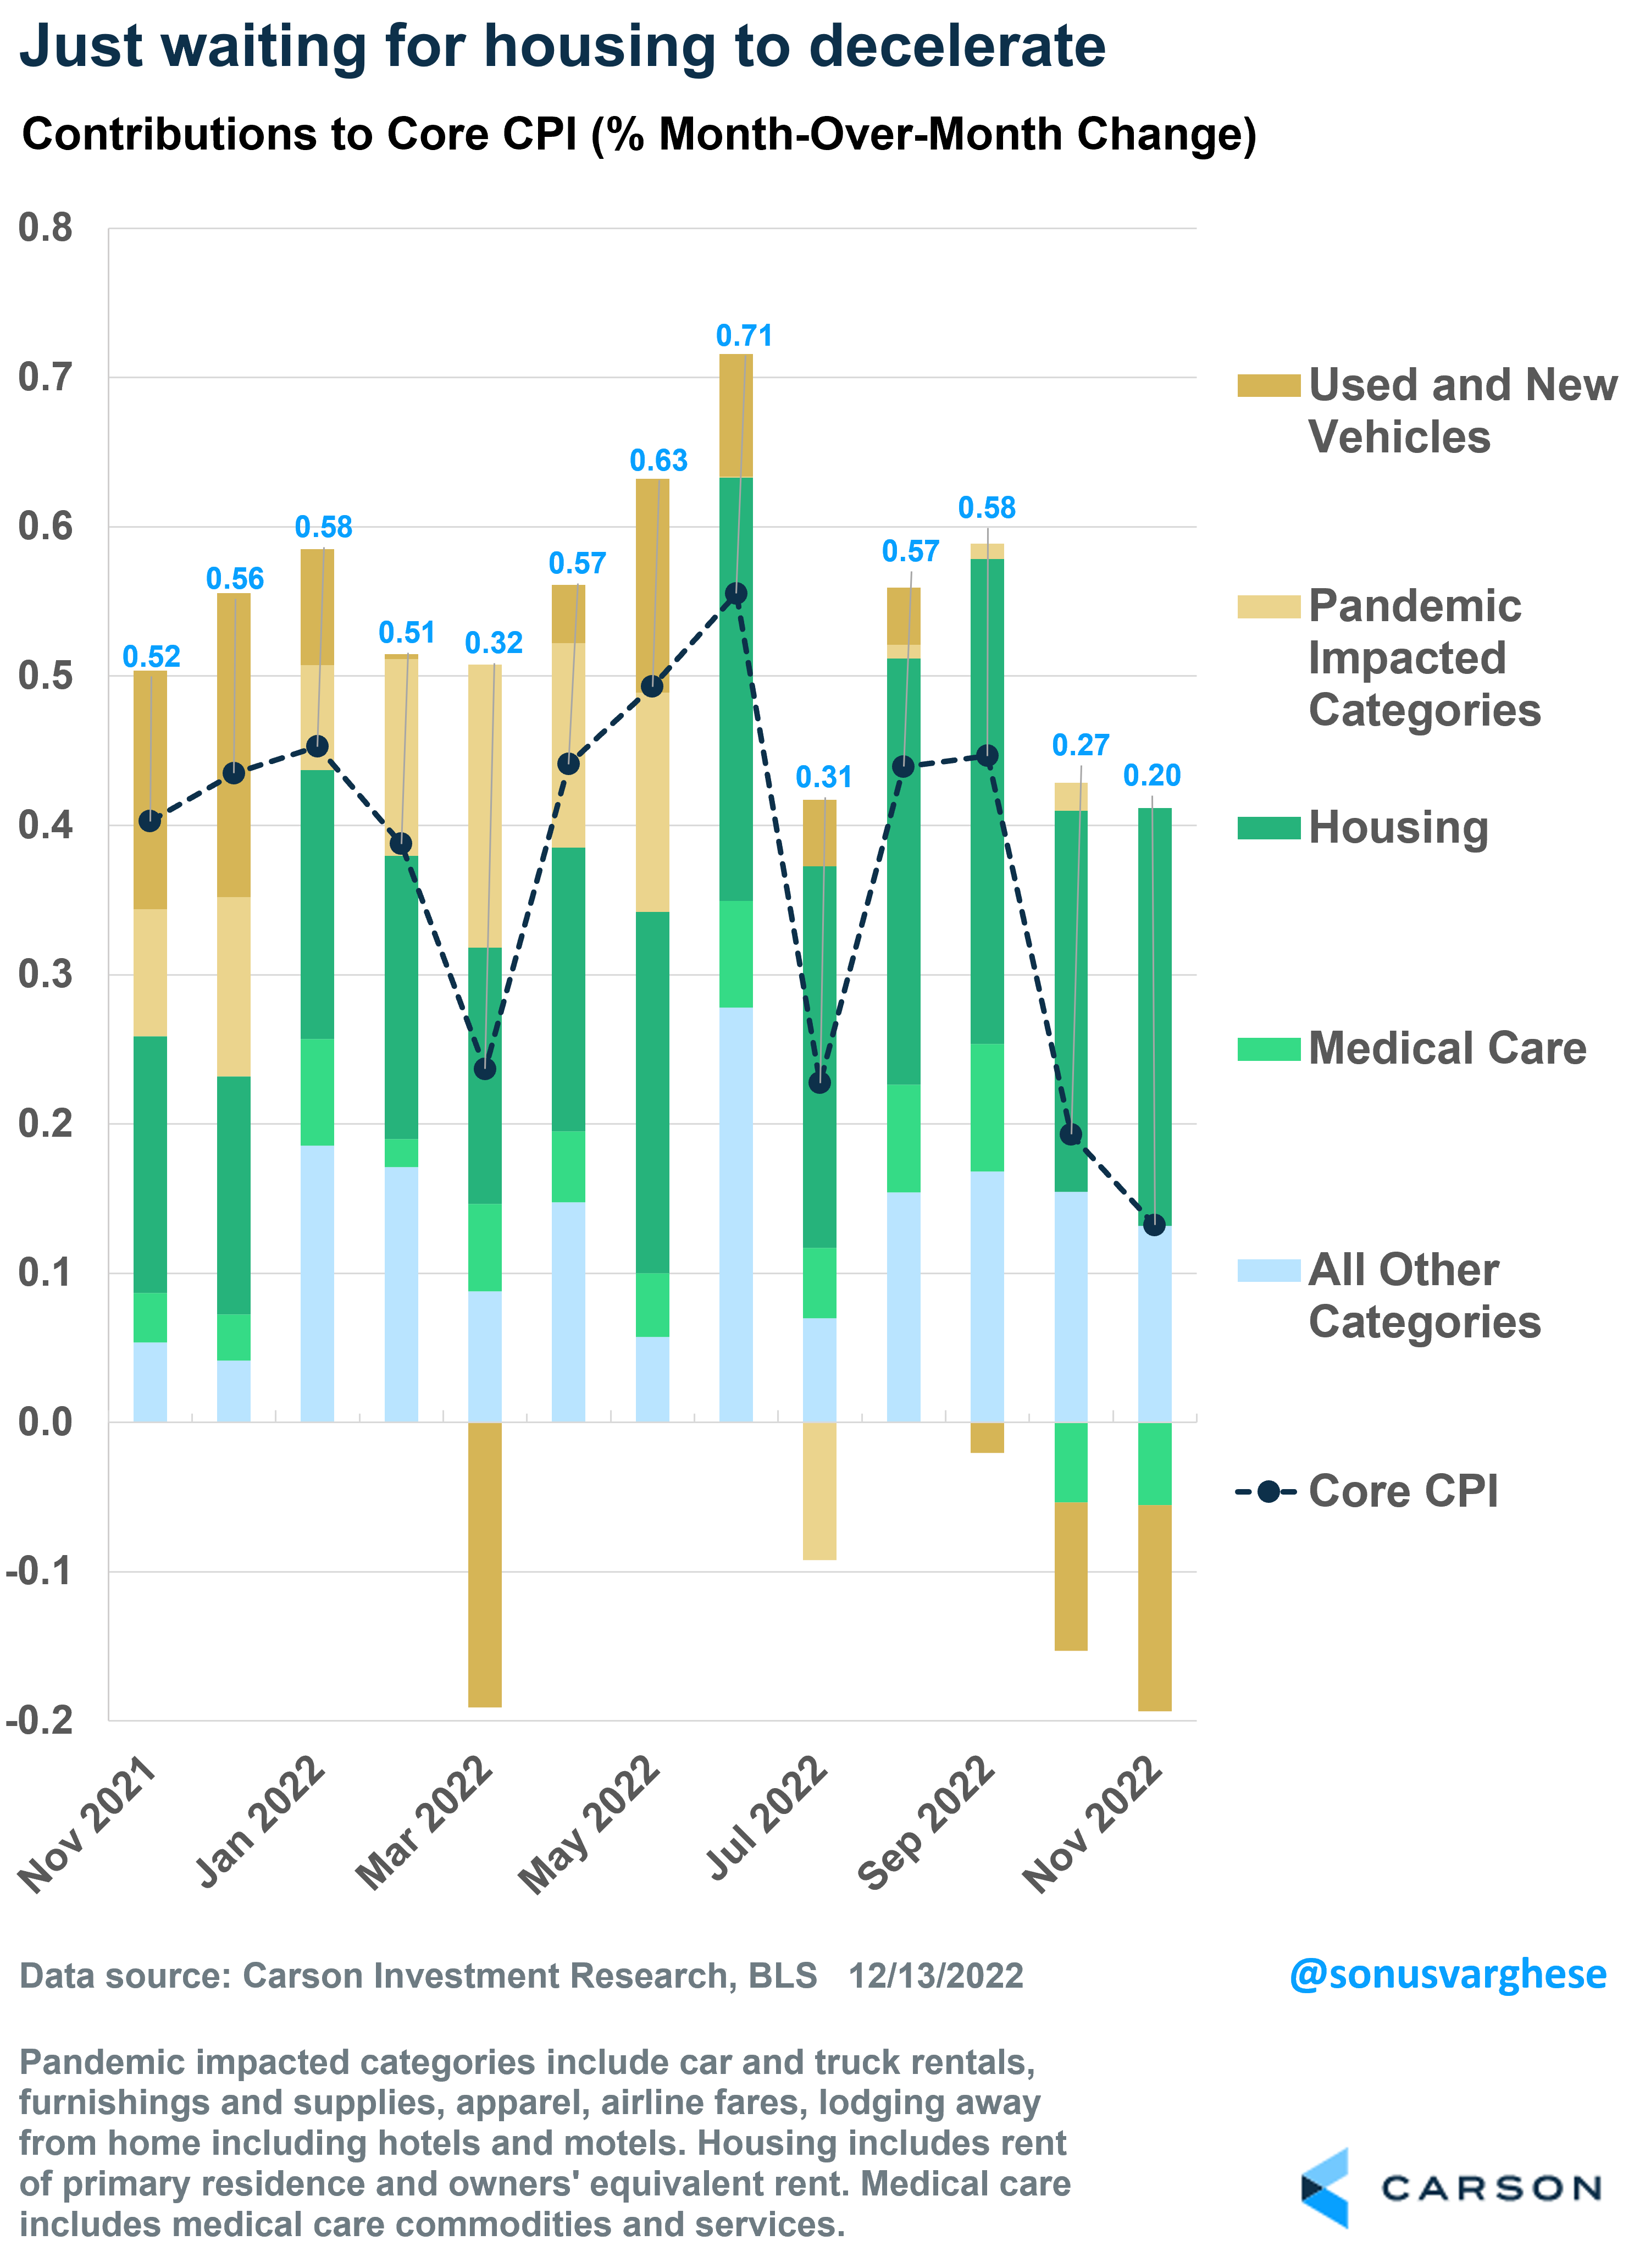
The Fed typically uses core inflation as its guide for future inflation. And we also got good news on that front for the second month in a row. Core inflation rose 0.2% in October, below expectations for a 0.3% increase. This is the lowest monthly increase since August 2021. Most importantly, the underlying details and trends are all pointing in the right direction, i.e., down
- Core goods prices (excluding food and energy prices) fell 0.5%. This was mostly due to used car prices, which declined by 2.9%. But also positive was that new vehicle prices were flat, which is the smallest monthly change since January.
- Medical services prices were also a deflationary force, falling 0.7%. This is likely to be the case for most of next year, as my colleague Ryan Detrick discussed a couple of months ago.
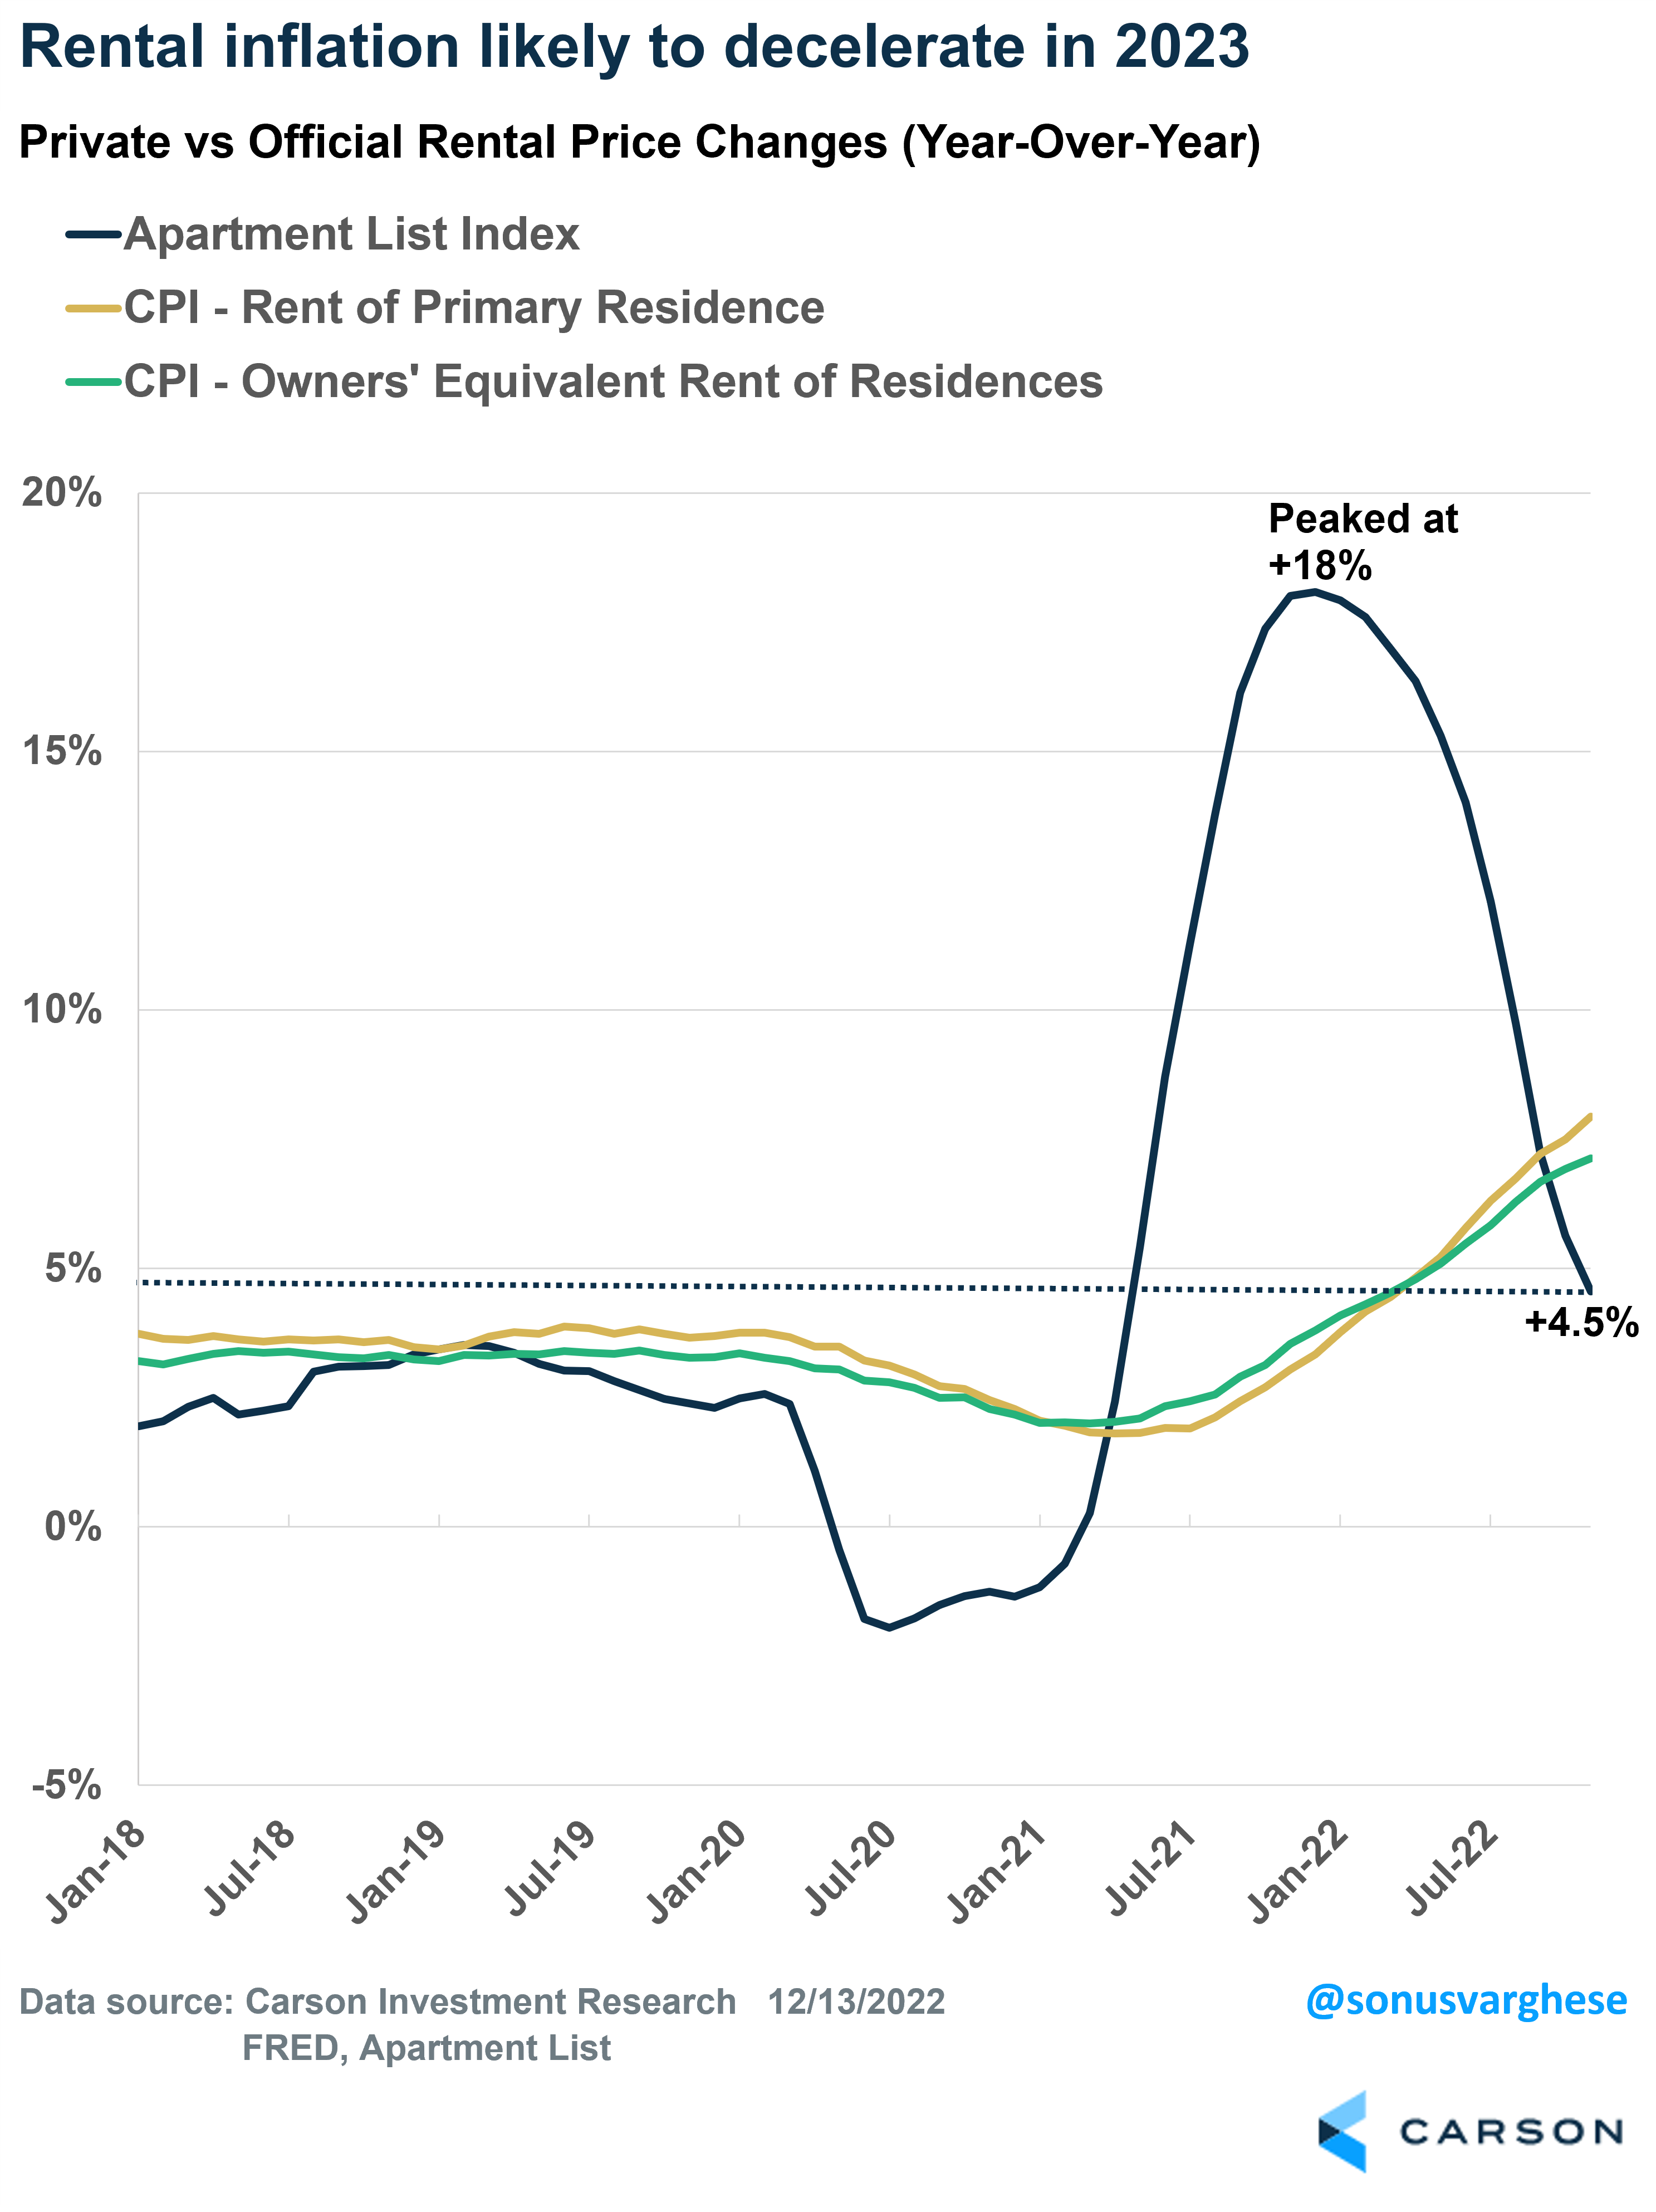
- Housing, essentially rents, make up 40% of core CPI, and it looks like prices may be peaking.
- Other core services, excluding housing and medical services, were recently mentioned by Fed Chair Powell as worrying them since it’s tied to wage growth, and wages are running hot. But, as the light blue bar in the chart below shows, this category made its lowest contribution to core inflation in four months.
So, where does inflation go from here?
This is the big question, and there are three big reasons why we believe inflation will continue to pull back in 2023.
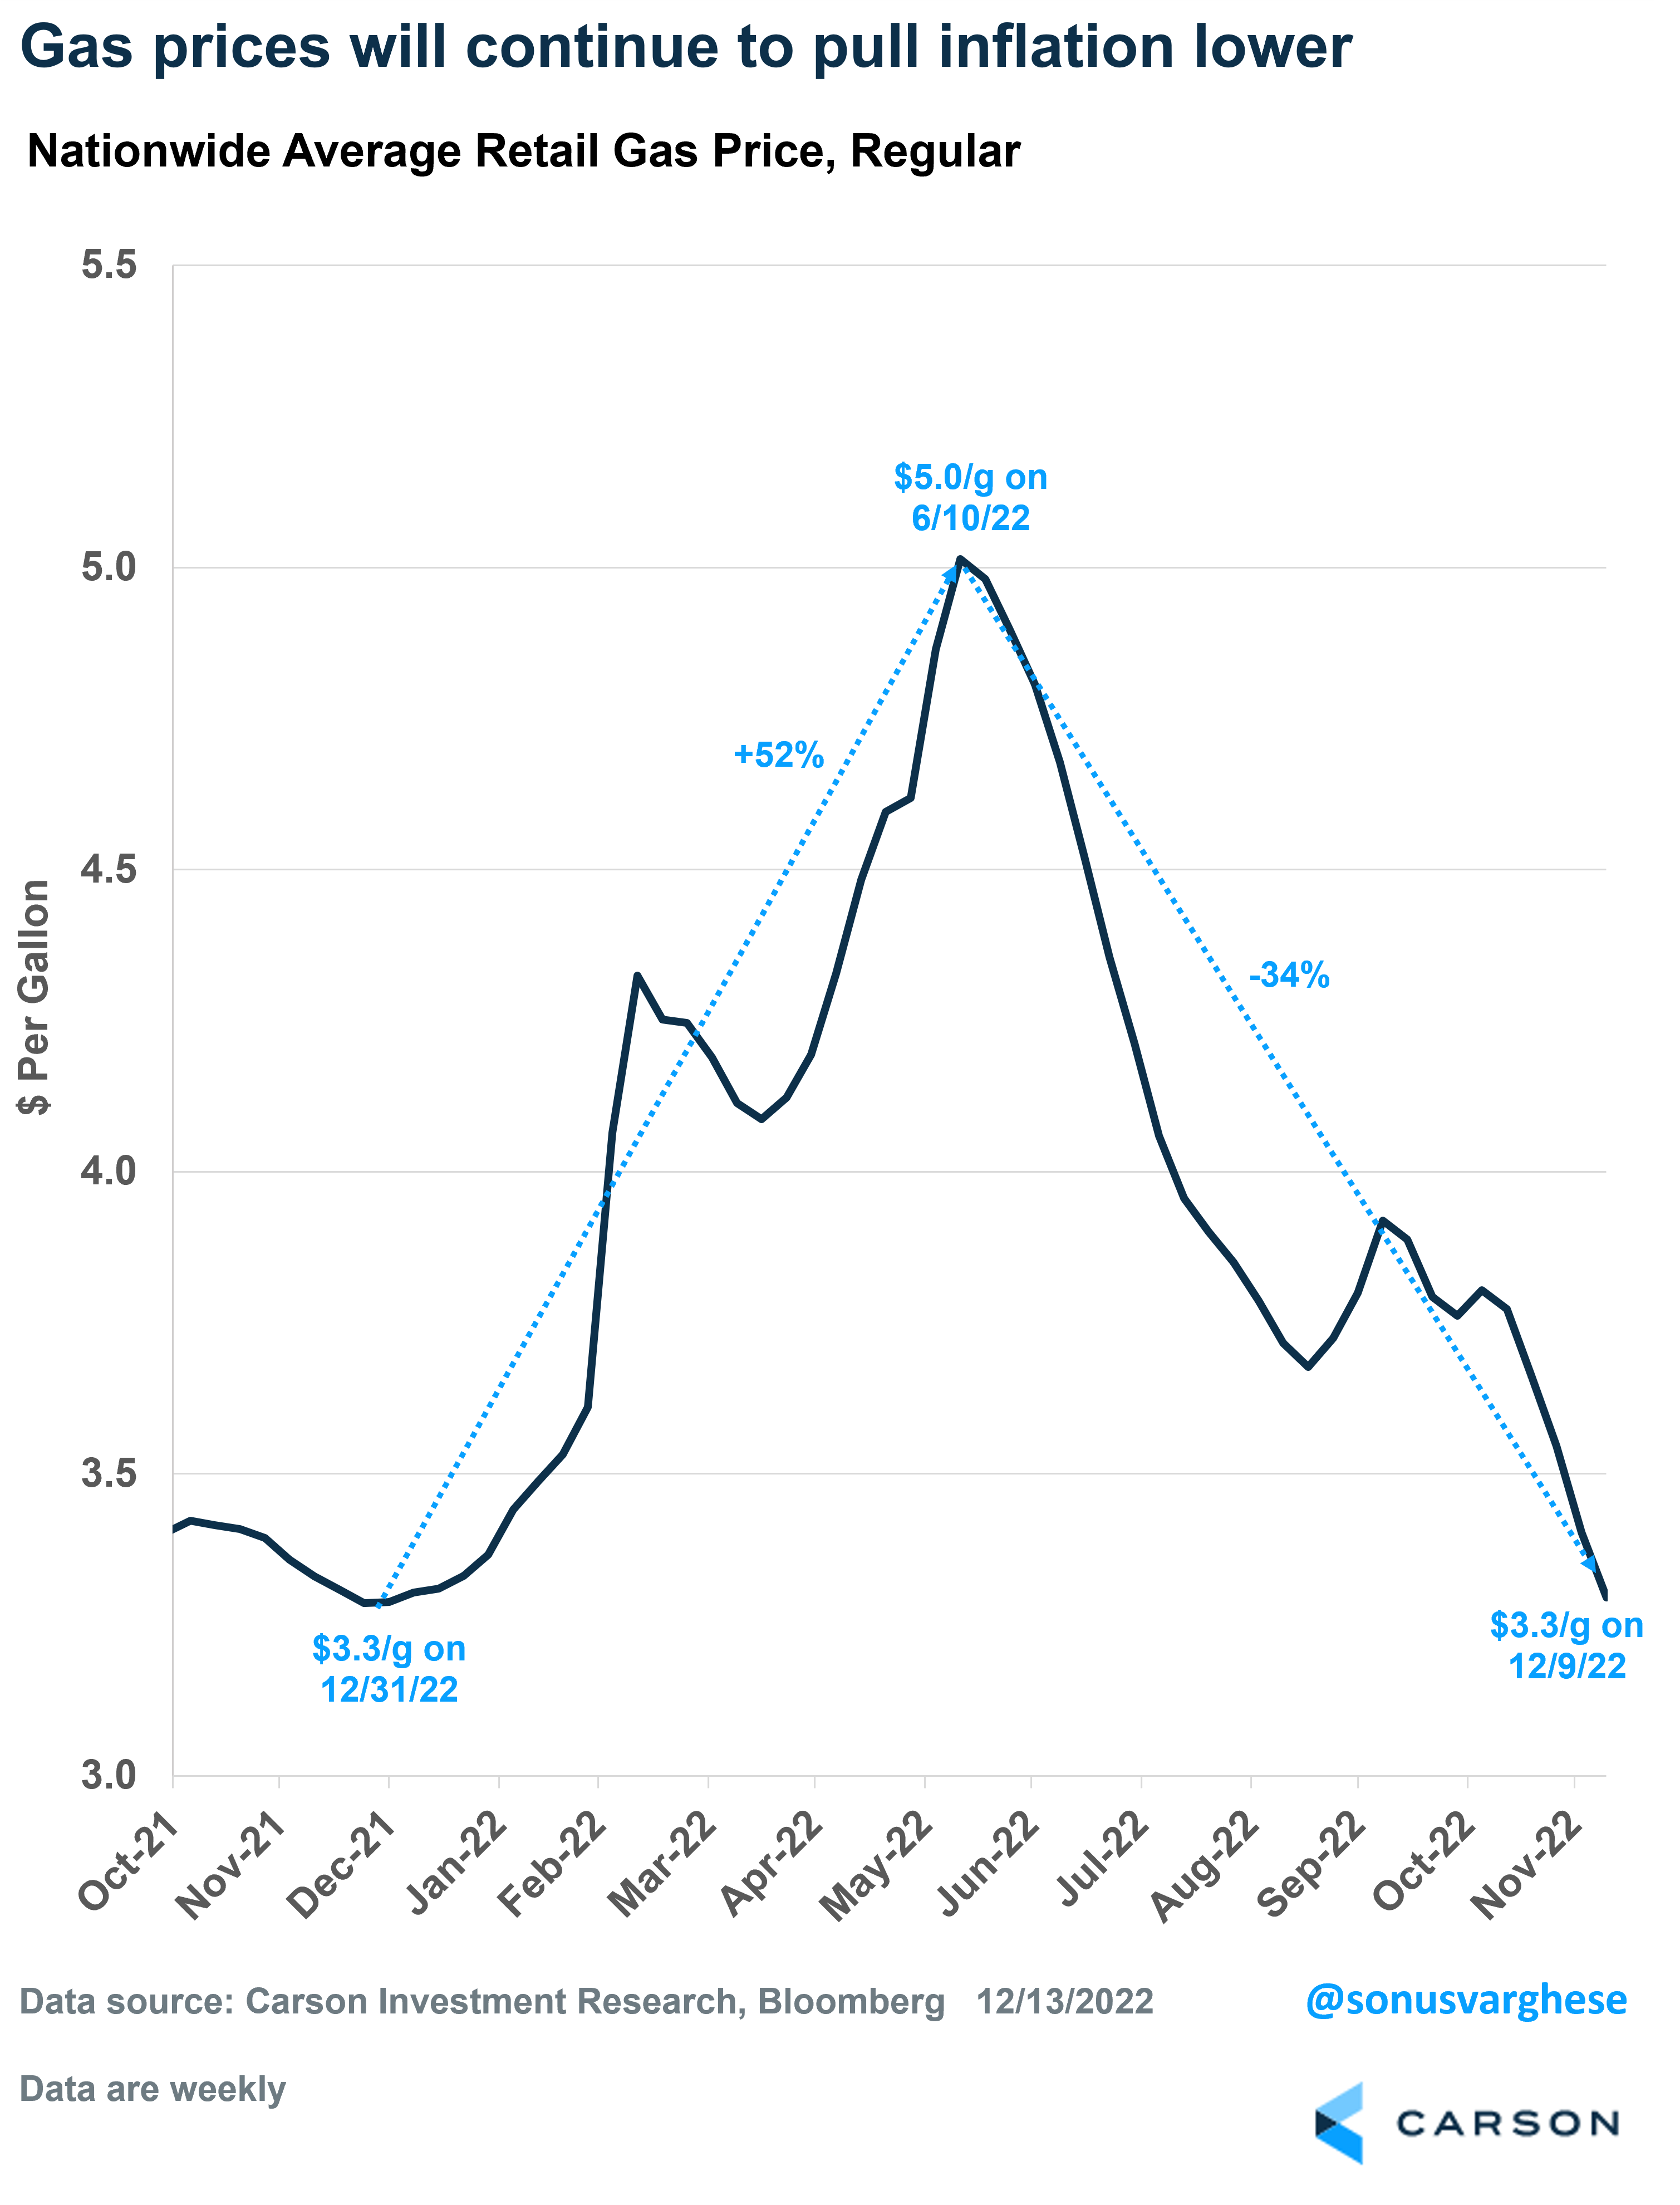
In the immediate term, it looks like gas prices will be a deflationary force. As I wrote last week, gas prices have made a complete round-trip and are back to where they started the year. Even if gas prices don’t move up or down significantly, I believe it’s going to pull inflation lower across the early part of 2023. On top of that, utility gas service prices also appear to be falling.
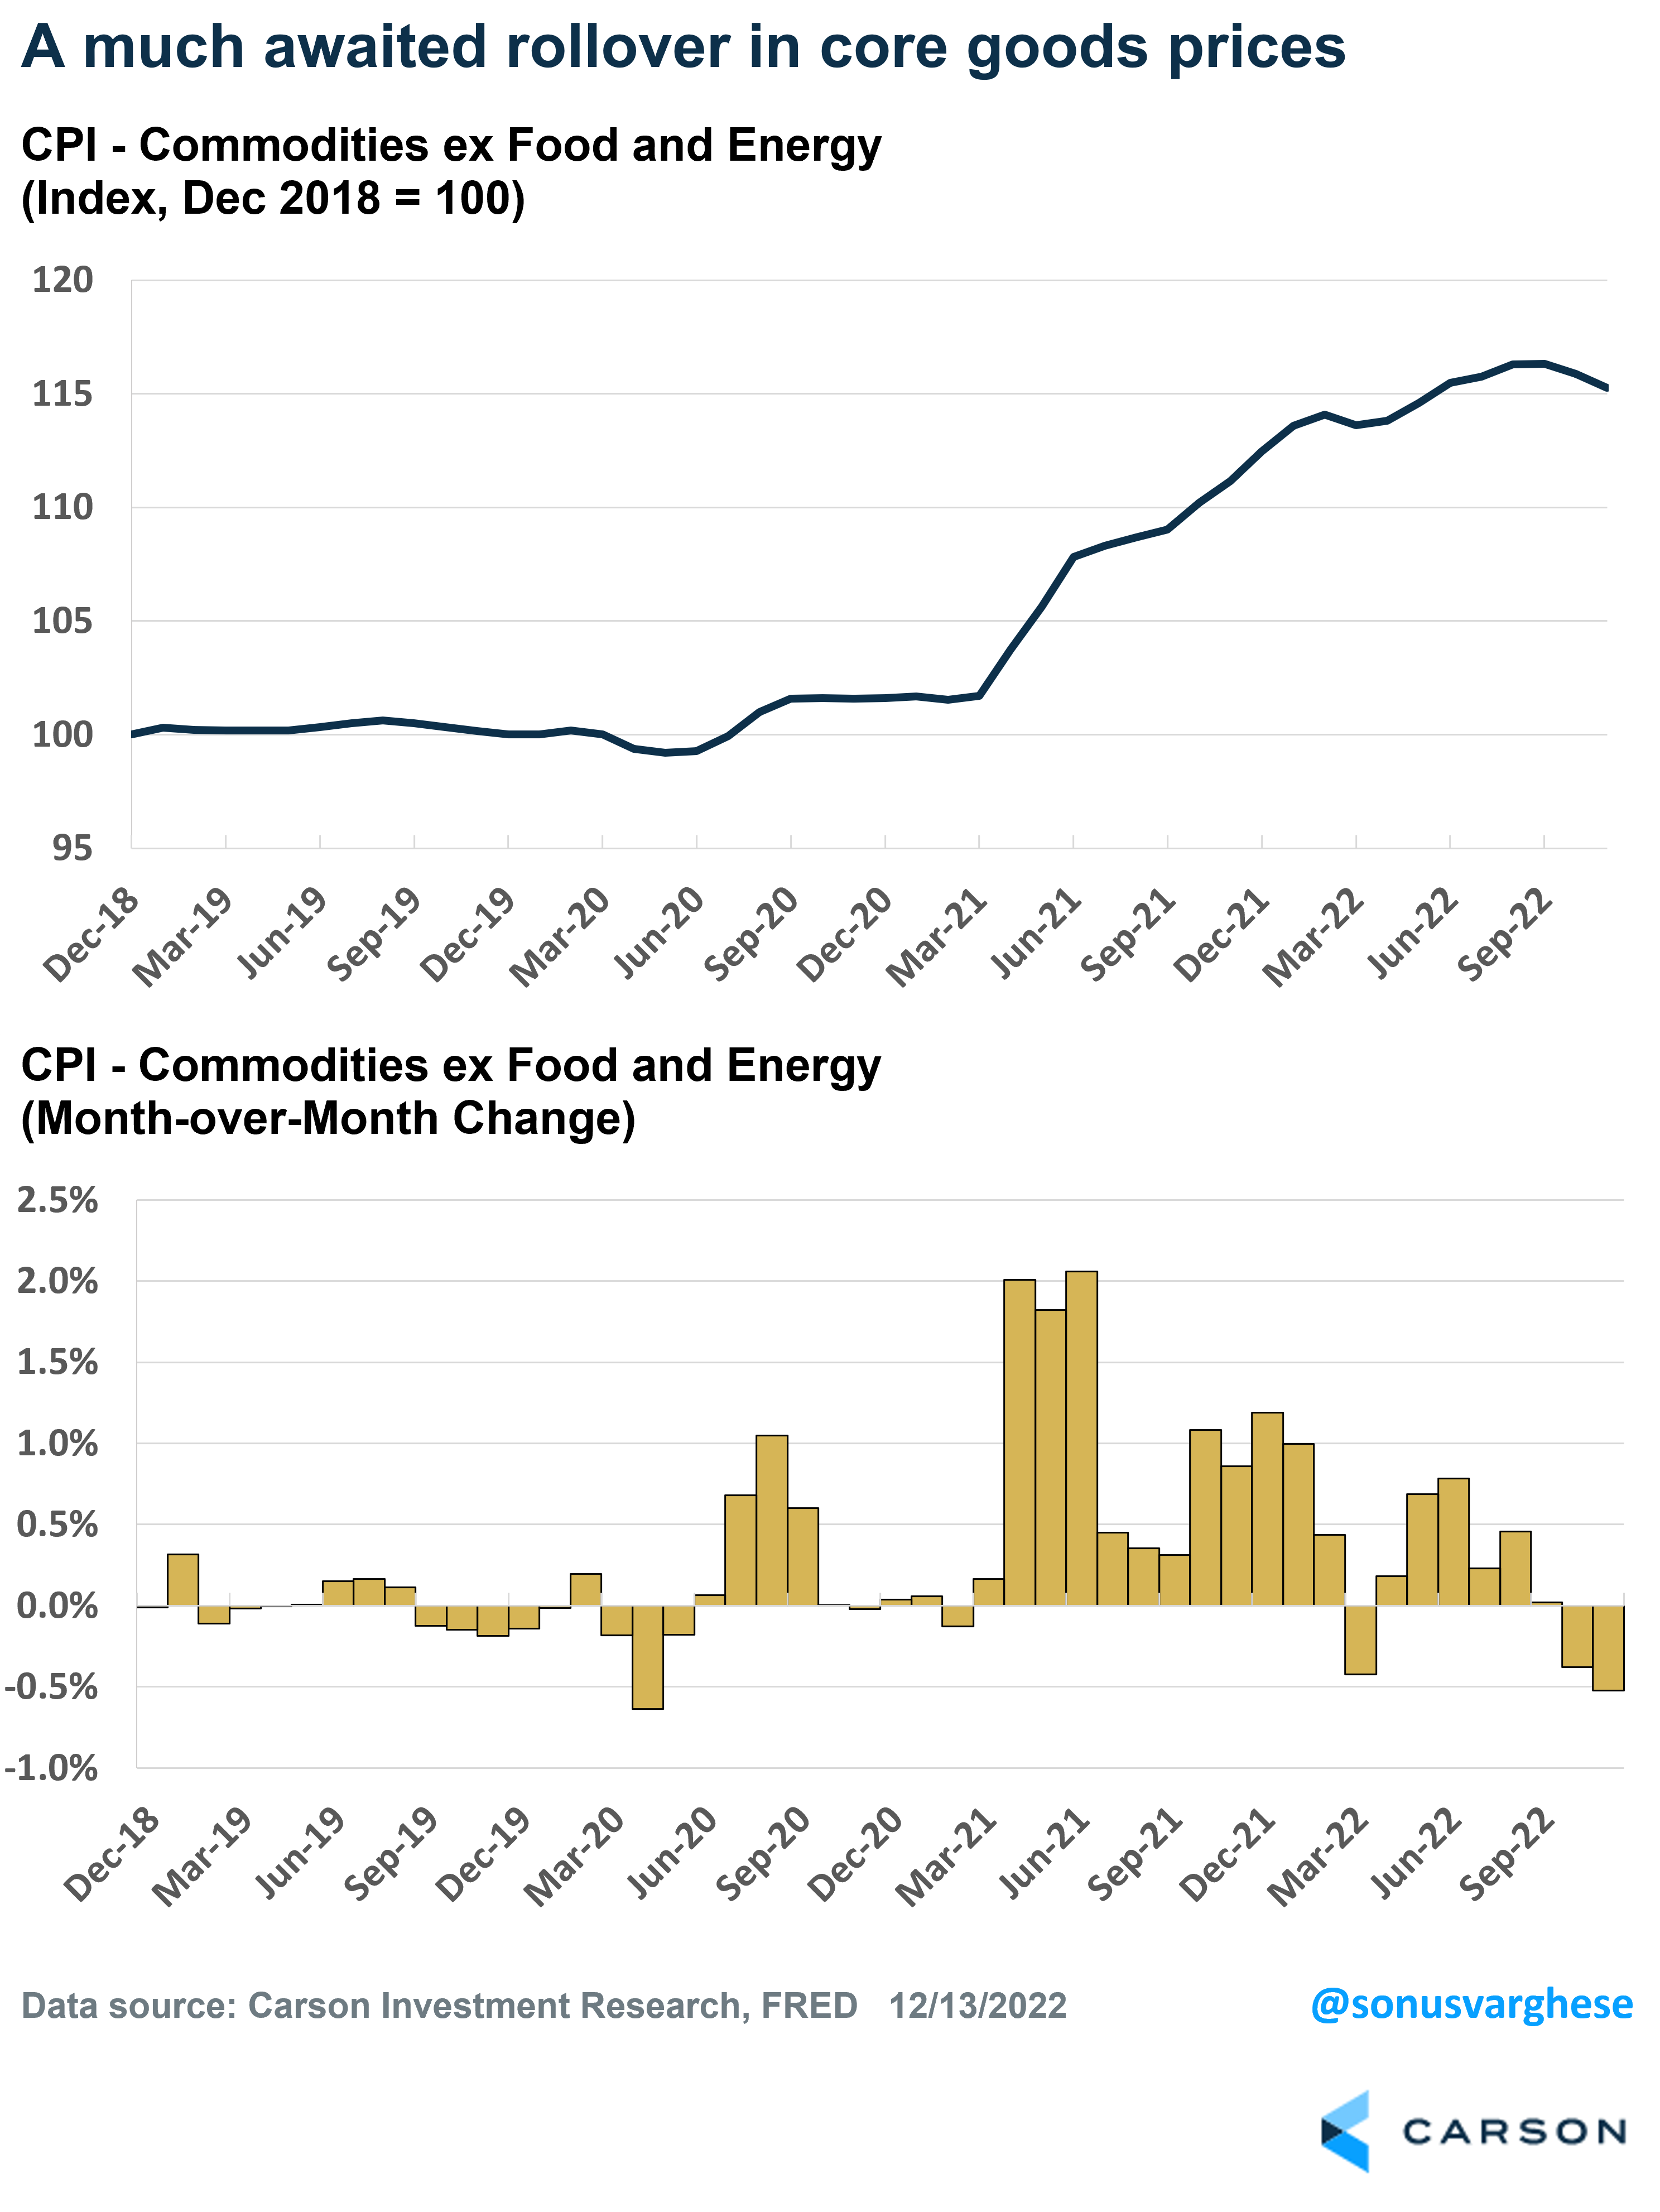
Next up: Core goods, which have the potential to play a significant role in pulling inflation lower in 2023. They make up a little over a fifth of the inflation basket and include things like used and new vehicles, apparel, home furnishings, and appliances – all of which were responsible for higher inflation in 2021-2022. As supply chains eased in 2022 and inventories built up, there was an expectation that core goods prices would drive inflation lower. But that didn’t start to happen until October, and now it looks like the much-awaited downtrend has begun. The even better news is that these prices are falling even as demand for things like cars stays high.
Finally, housing, or rather rents – since even “Owners’ equivalent rent” (OER) is measured using rents. Together, rentals and OER make up about 40% of the core inflation basket, and this category is why core inflation is running as high as it is. Rental prices surged after the pandemic, but the problem is that official inflation data capture this with a very long lag – and that lagged surge is what we’re seeing right now. As Ryan pointed out, official rents capture new and existing leases, as opposed to private data that just look at new leases that reflect the latest market prices. The good news is that the private data shows that rents are decelerating quickly. That will eventually trickle into official inflation data, though it may be mid-2023 before we see a real impact. Combine that impact with falling core goods prices, and we may be in for quite a bit of disinflation in 2023.
The bottom line, the same factors that drove inflation higher are reversing and will probably pull inflation the other way in 2023.