
First things first, this is a three-day weekend for many of us and I hope everyone enjoys the long President’s Day weekend. And if you need to buy a mattress, this is your Super Bowl weekend, good luck out there. Speaking of the Super Bowl, this is our yearly reminder that someone should run for President, and their whole platform should be to make sure that the Super Bowl is always over President’s Day weekend. Who wouldn’t want the day after the big game off? I swear they’d win …. But I digress.
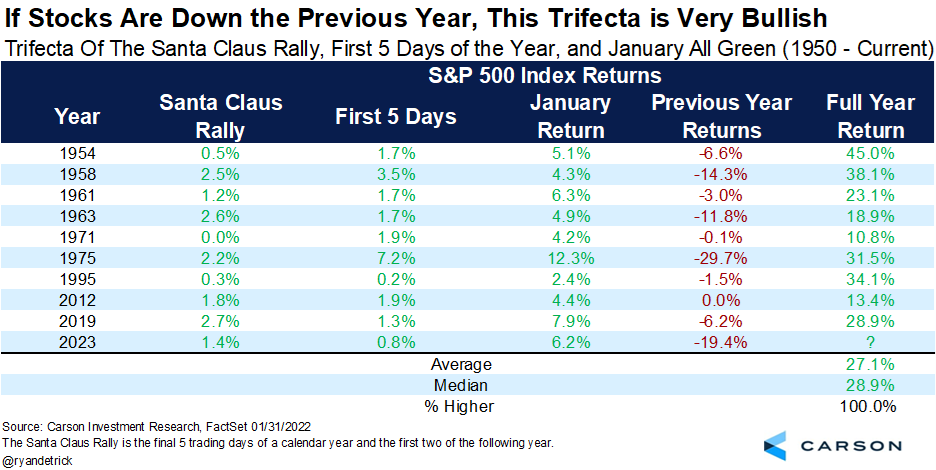
We’ve noted many times this year some of the rare yet bullish developments taking place for stocks that should continue to lead to strong performance in 2023. For example, we discussed why the strong January, amid a negative year the year before, could be a very good thing in The Trifecta of Bullish. Here’s one of the tables from that blog. Higher nine for nine and up 27% for the year would make many bulls smile.
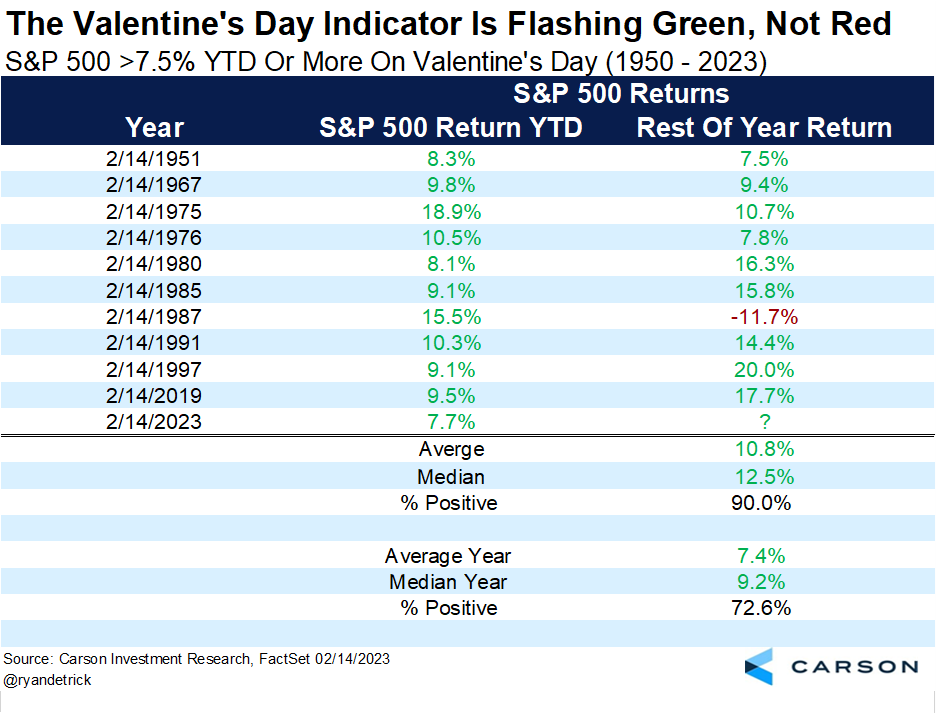
Let’s take another look at the strong start to 2023, but this time wrap in Valentine’s Day. I hope everyone had a nice Valentine’s Day earlier this week. Mine was a winner, as my wife got me a Reese’s Take 5 candy bar, my favorite for sure. Do you know who also had a nice Valentine’s Day? The bulls. I know, I know, Valentine’s Day is known for red; well, the Valentine’s Day Indicator is flashing green.
2023 was the 11th-best start to a year ever for the S&P 500 as of Valentine’s Day, up a very impressive 7.7%. What happened next, looking at the best ten starts to a year? Nine out of 10 times the rest of the year was green, with an average return of nearly 11% and a median return of 12.5% – both well above the average returns. Momentum can be a wonderful thing for investors, and the Valentine’s Day Indicator does little to change that.
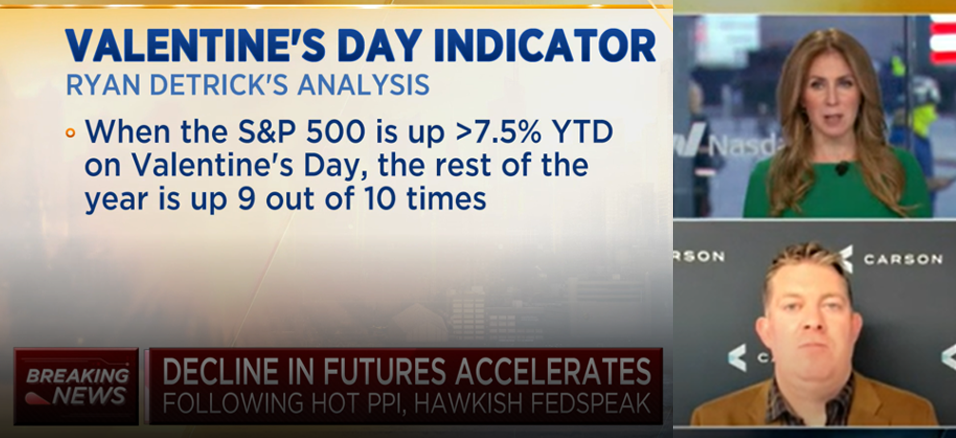
I joined Becky Quick and CNBC’s Squawk Box yesterday to discuss the Valentine’s Day Indicator. You can watch the full interview here.
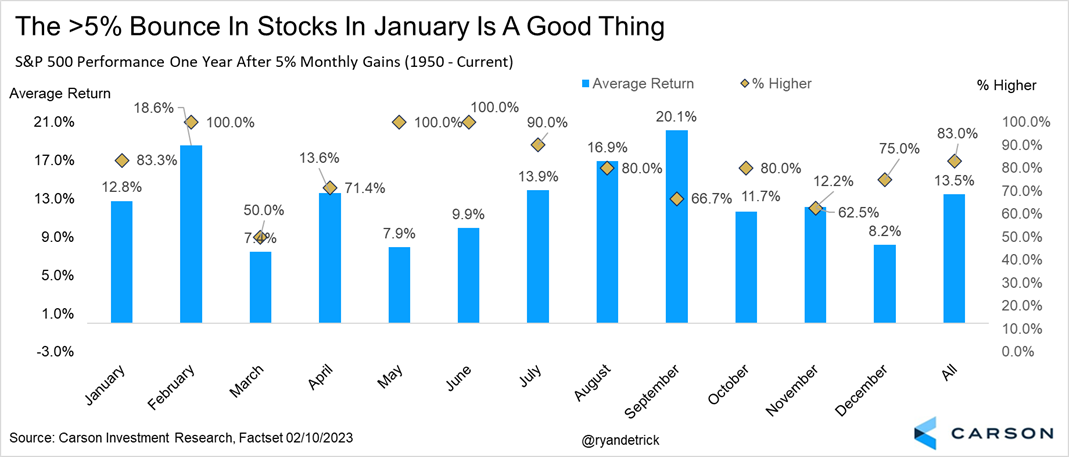
Speaking of momentum, here’s an interesting study I did when stocks gained more than 5% during a month (like what happened in January). A year later? Stocks are up 13.5% on average and higher 83% of the time, way better than average. I also broke it up by which month the big gains took place. When January gained more than 5%, the next twelve months are up 12.8% on average and higher 83.3% of the time. Maybe we should be rooting for a 5% gain in May or June, as stocks have never been lower a year later. Or maybe in September, when they gained an incredible 20% on average a year later?
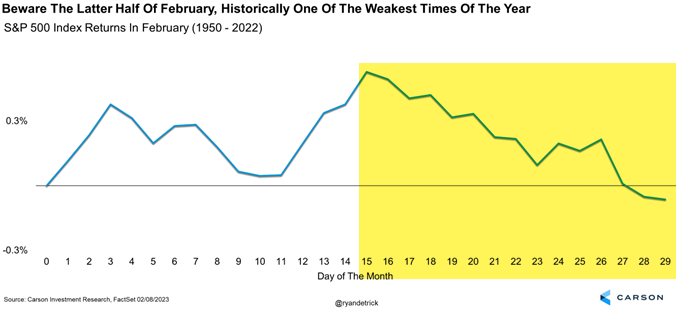
I will leave you with this. February historically isn’t a very strong month for stocks, and it is the second half of February when trouble tends to arrive. We are still quite optimistic about how well stocks could do the rest of 2023, but it won’t be a straight line. Just be aware that the next three or four weeks historically aren’t very strong, and some well-deserved seasonal weakness could be perfectly normal and healthy.
Please listen to our latest Facts vs. Feelings podcast with Sonu and me for more of our latest views on the things discussed in this blog, along with the latest on the Fed, inflation, and debt. The highlight? We rank our top Super Bowl halftimes…