
“Why not go out on a limb? That’s where the good fruit is!” Mark Twain
October is living up to its name as one of the most volatile months, as there have only been 12 trading days this month (the average month has 21, so we’re a tad over the halfway point) and only four times did the S&P 500 not close up or down at least 1%. In fact, the index has been green five days so far this month and incredibly the smallest gain was yesterday’s 1.1% jump, with an astonishing 2.4% average gain on the up days in this spooky month. That would be the best average up day for any month since March/April 2020 and March 2009 before that.
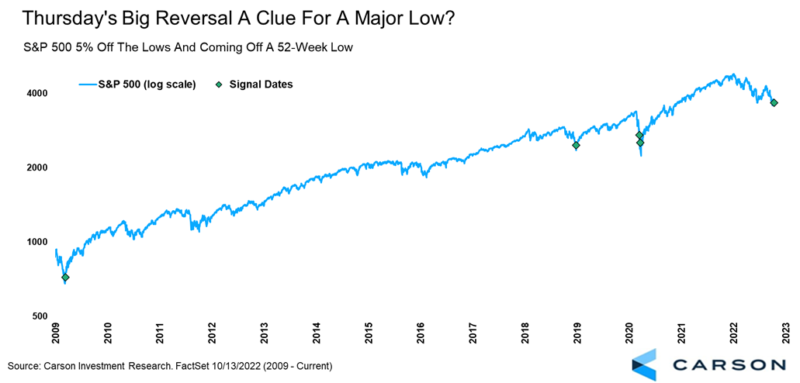
The action last Thursday had some of the hallmarks of a capitulation low. Remember, CPI came in hotter than expected and S&P 500 futures dropped 4% quickly, before bouncing some before the open. Oh, it was also down six days in a row heading into this day and all hope had been lost for investors.
In the end, stocks were down more than 2% at the lows, but closed up more than 2%, making it more than a 5% increase from the lowest point of the day, which was also a 52-week low. Going back in history, days like this have indeed marked some major turning points for stocks. Recent times include March 2020, late December 2018, and March 2009. Again, not the worst times to be looking for a rally.
Various measures of sentiment reached extreme levels of fear, consistent with market lows. Put/call ratios, flows, investors sentiment polls, bearish magazine covers, and overall anecdotal sentiment all suggested a potential low was near. Remember, if everyone is bearish, there is no one left to sell. In the history of bear markets, it is safe to say stocks haven’t ever bottomed on good news, the news is always horrible. Last Thursday morning felt like that.
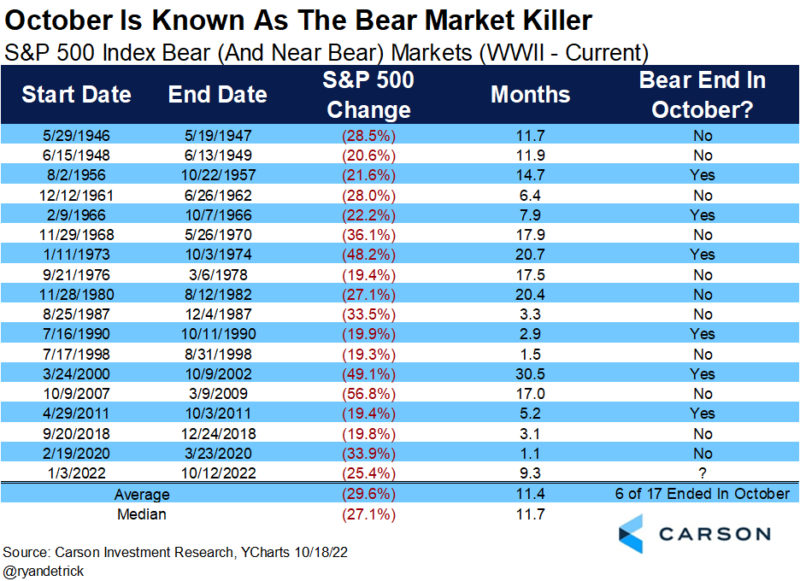
We’ve written before how October can be a bear market killer and we wanted to take another look at why the bear market might have ended last week, once again in October. Here’s the chart that shows all the bears (and near bears) going back to World War II. Six of the last 17 ended in October, with an average decline of 29.6% and they lasted about a year. The current bear of 25.4% and 9.3 months is in range for what history tells us is normal.
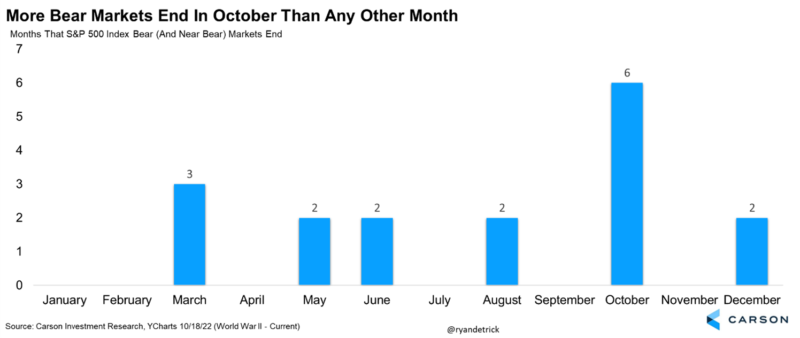
Here’s another way to show that table, broken down by the month when the bear market ended. Six of 17 bear markets ended in October, as we noted above, but this shows it in another way that makes it very clear how many times this happened in October compared with other months.
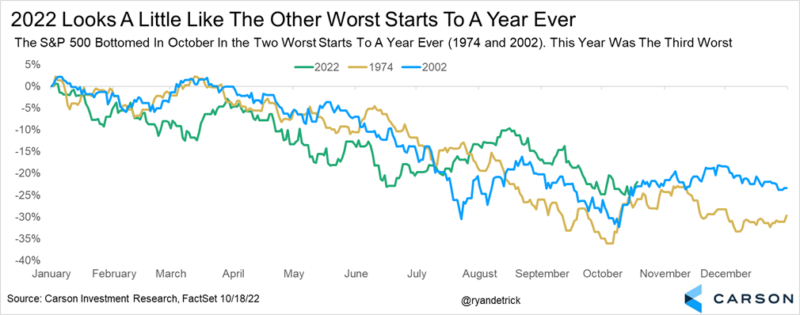
As of the end of September, this was the third worst start to a year ever for the S&P 500, with only 1974 and 2002 worse. Given this blog is discussing why bears go to die in October, you could probably guess when those two vicious bears ended … yet again in October. The S&P 500 was nearly cut in half during those bears, but stocks stopped going down on October 3 and October 9, respectively. Could October 12 in 2022 join this list?
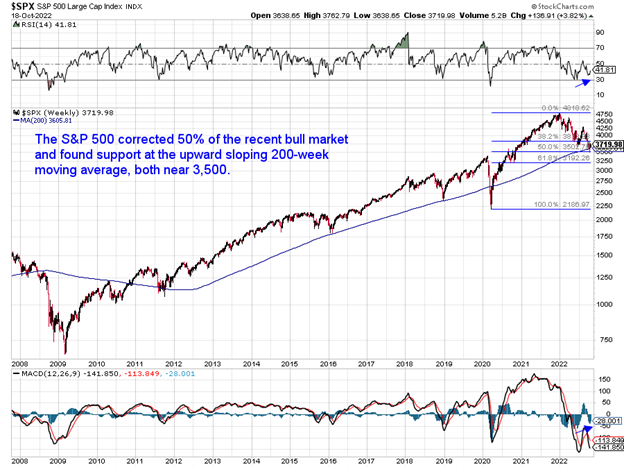
Lastly, let’s look at the chart. The S&P 500 retraced exactly 50% of the previous bull market near 3,500 before buyers stepped in to find some bargains. This is a common retracement level and one we’d expect buyers to add and sure enough they did. But this level also coincided with the upward sloping 200-week moving average. Multiple times going back the past decade this trendline was support. Additionally, various momentum indicators have improved, implying there is strength under the surface, consistent with other major lows.
If that last part about momentum indicators was a tad confusing, here’s another way to put it. There were more stocks making new 52-week lows when the S&P 500 hit its June 16 low than there were last week. In other words, less stocks were going down now versus then, a show of under the surface strength. If all you saw on the news last week was the stock market made new lows you’d never know the improvement taking place under the surface. Simply put, if not as many stocks are going down, it is hard for the index to continue to go lower.
The stage could be set for a well-deserved fourth-quarter rally. Please continue to follow the Carson Investment Research team as we navigate what we are seeing out there, and the good news is we are seeing signs the worst could be behind us for this bear market.