Welcome to Carson Investment Research’s Earnings Check-In for the week ending July 24, 2026. This series is built weekly from FactSet’s Earnings Insight report (John Butters, VP, Senior Earnings Analyst with FactSet), with index weights and market caps sourced from YCharts, and aggregation performed in-house. We tie every figure to FactSet’s published numbers, then add Carson’s perspective on top of that. We publish our Earnings Check-In weekly during earnings season.
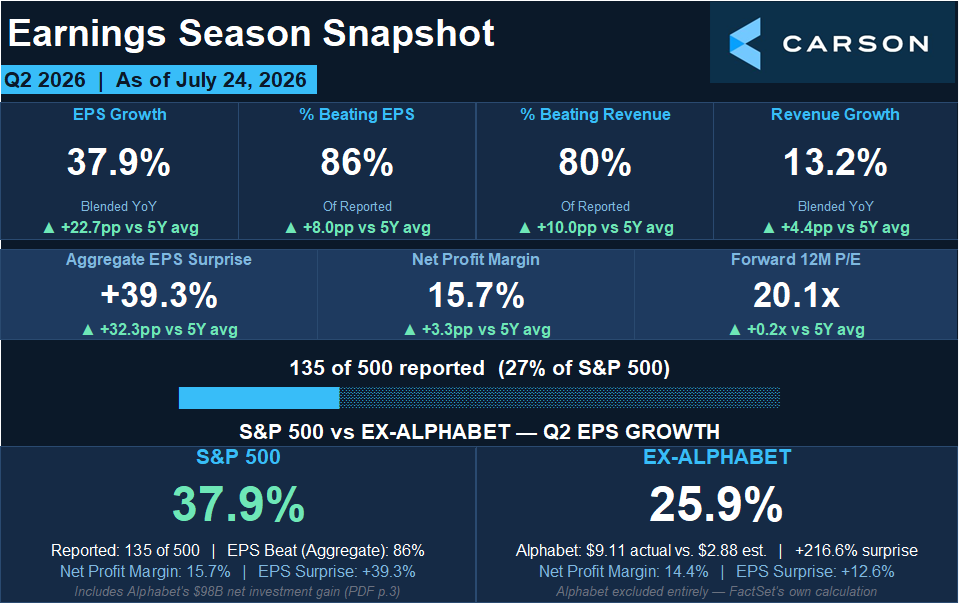
With 27% of the S&P 500 now having reported, blended earnings growth for Q2 has jumped to 37.9%, up from 24.8% a week ago. If that holds, it would be the fastest earnings growth the index has posted since Q3 2021. It is also, in large part, the story of a single company.
Here’s the season at a glance:
Source: Carson Investment Research, Earnings Insight, FactSet 7/24/2026
What Changed This Week
Blended EPS growth moved 13 percentage points in five trading days. Alphabet alone accounted for 92% of the net dollar-level increase in S&P 500 earnings over that stretch.
Alphabet has dominated the earnings picture, but strength has still been broad-based. 86% of reporters have topped EPS estimates, against a 5-year average of 78%. On the top line, 80% have beaten revenue estimates, against a 5-year average of 70%. Both figures are up from last week, and both are the highest we’ve seen this season.
Revenue growth ticked up to 13.2% from 12.8%. If that holds, it would be the strongest revenue growth since Q2 2022, and all eleven sectors are now growing revenue year over year. The blended net profit margin came in at 15.7%, the highest FactSet has recorded since it began tracking the metric in 2009. The previous record, 14.8%, was set last quarter.
Forward estimates kept climbing. Analysts now look for 27.3% earnings growth in Q3 and 27.3% for full-year 2026, both up from last week. Meanwhile, the forward 12-month P/E sits at 20.1, below the 20.4 recorded at quarter-end. Since June 30, the index price has fallen by less than 0.1%, while forward earnings estimates have risen by 1.6%.
Our Take: Read the Fine Print
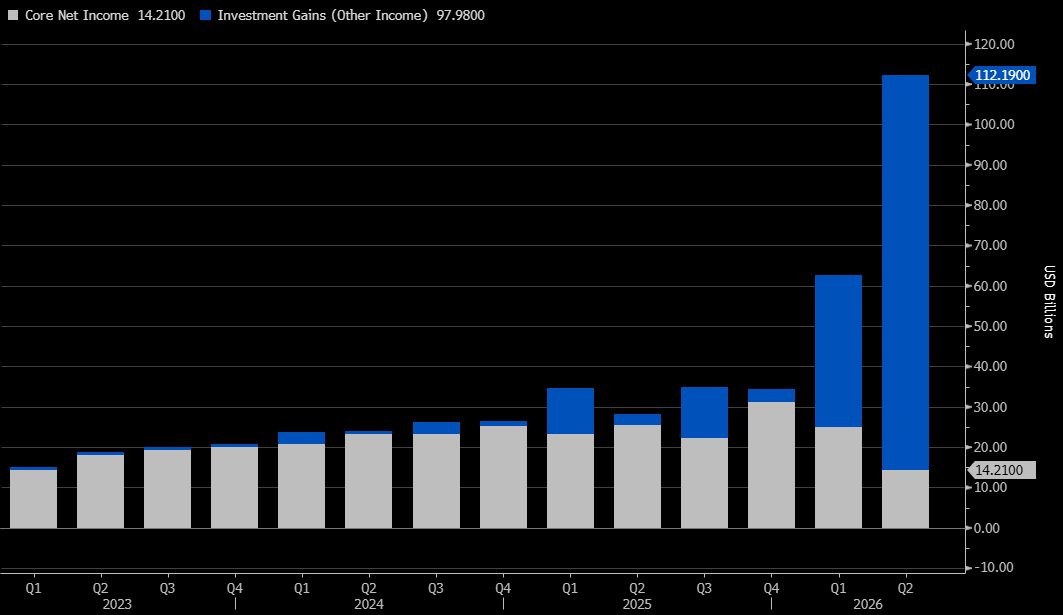
Alphabet reported $9.11 per share against a $2.88 estimate. That is a 216% beat, which is not only wild but also a massive input to nearly every number listed above.
It is also a GAAP figure that includes roughly $98 billion in net investment gains, primarily unrealized gains on equity securities (that is, markups on the private companies Alphabet holds in its investment portfolio). That $98 billion, which makes up most of Alphabet’s $112 billion in Q2 net income, is worth roughly $6.26 per share on its own. Income from core operations was $14 billion, down from $25.5 billion a year ago. Some analysts covering the company noted that excluding the gain, Alphabet would have reported $2.85 earnings per share, which comes in a shade below the consensus estimate.
Source: Carson Investment Research, Bloomberg 7/27/26
Butters is admirably direct about what this does to the index-level numbers. Strip out Alphabet and:
- Blended earnings growth falls to 25.9% from 37.9%
- The record net profit margin falls to 14.4% from 15.7%
- The aggregate earnings surprise falls to 12.6% from 39.3%
25.9% is still an excellent quarter and would remain the second consecutive quarter of 20%-plus earnings growth, as well as the seventh straight quarter of double-digit growth. Also, since the beat rates of 86% and 80% are based on a count of companies (each company counts equally), excluding Alphabet makes barely any difference. The season beneath the headline remains strong, no matter how we look at the numbers.

Stay on Top of Market Trends
The Carson Investment Research newsletter offers up-to-date market news, analysis and insights. Subscribe today!
"*" indicates required fields
The risk worth naming is that revaluation gains cut both ways. Alphabet, Amazon, Nvidia, and Microsoft all booked meaningful revaluation income last quarter as well. Private marks that inflate reported earnings on the way up could become a drag on the way down, and they tell you nothing about whether the underlying business is compounding. I’d rather build a view on the $14 billion that reflects operating earnings than the $112 billion that includes the revaluation gains.
Several Prominent Names Reported This Week
Beyond Alphabet, Micron delivered $25.11 versus $20.86 expected, and Intel posted $0.42 versus $0.22 expected. The banks kept swinging: Travelers came in at $10.04 versus $5.41, Goldman Sachs at $20.98 versus $14.51, JPMorgan at $7.70 versus $5.59. On the other side, Tesla missed by 39.8%, the widest miss of the quarter so far, with GE Vernova and Las Vegas Sands both off by 22.1%.
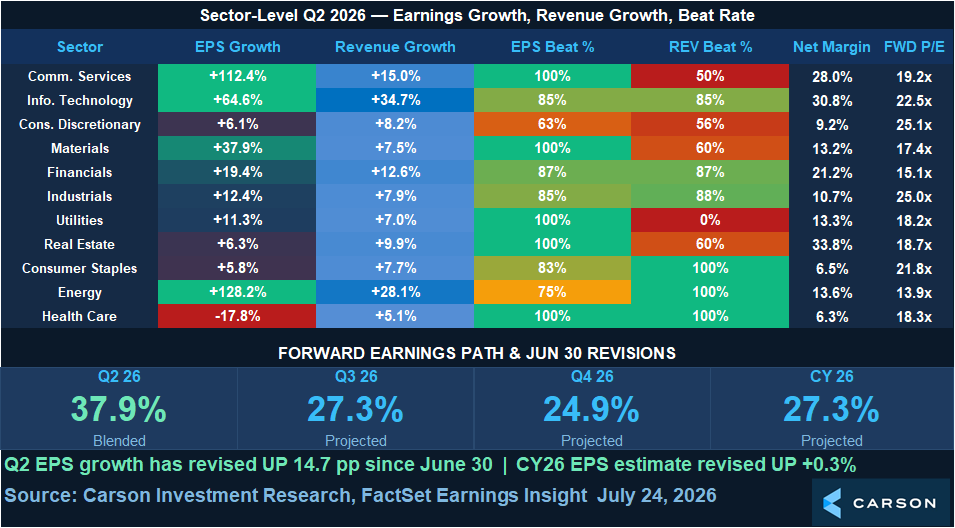
Here’s the full sector scoreboard:
Source: Carson Investment Research, Earnings Insight, FactSet 7/24/2026
That 0% revenue beat rate for Utilities is a real zero. Every Utilities company that has reported so far has missed on the top line, and the sector’s -6.9% revenue surprise is the only negative one of the eleven. And the enormous 136.5% earnings surprise in Communication Services is Alphabet again; without it, the sector reports a small earnings decline rather than 112.4% growth.
Health Care remains the only sector with falling earnings, at -17.8%, and that is still mostly an accounting artifact. Analysts are including one-time R&D charges in their estimates for Gilead Sciences and Merck. Exclude those two names and the sector grows 6.9%.
The market, meanwhile, still refuses to be impressed. Companies that beat have seen their shares fall 0.3% on average around the report, against a typical 1.0% gain. Misses are down 4.0%, worse than the usual 3.0%.
Reporting This Week
177 S&P 500 companies report this week, including nine Dow components. By market cap, it’s the single heaviest week of the entire season by a wide margin.
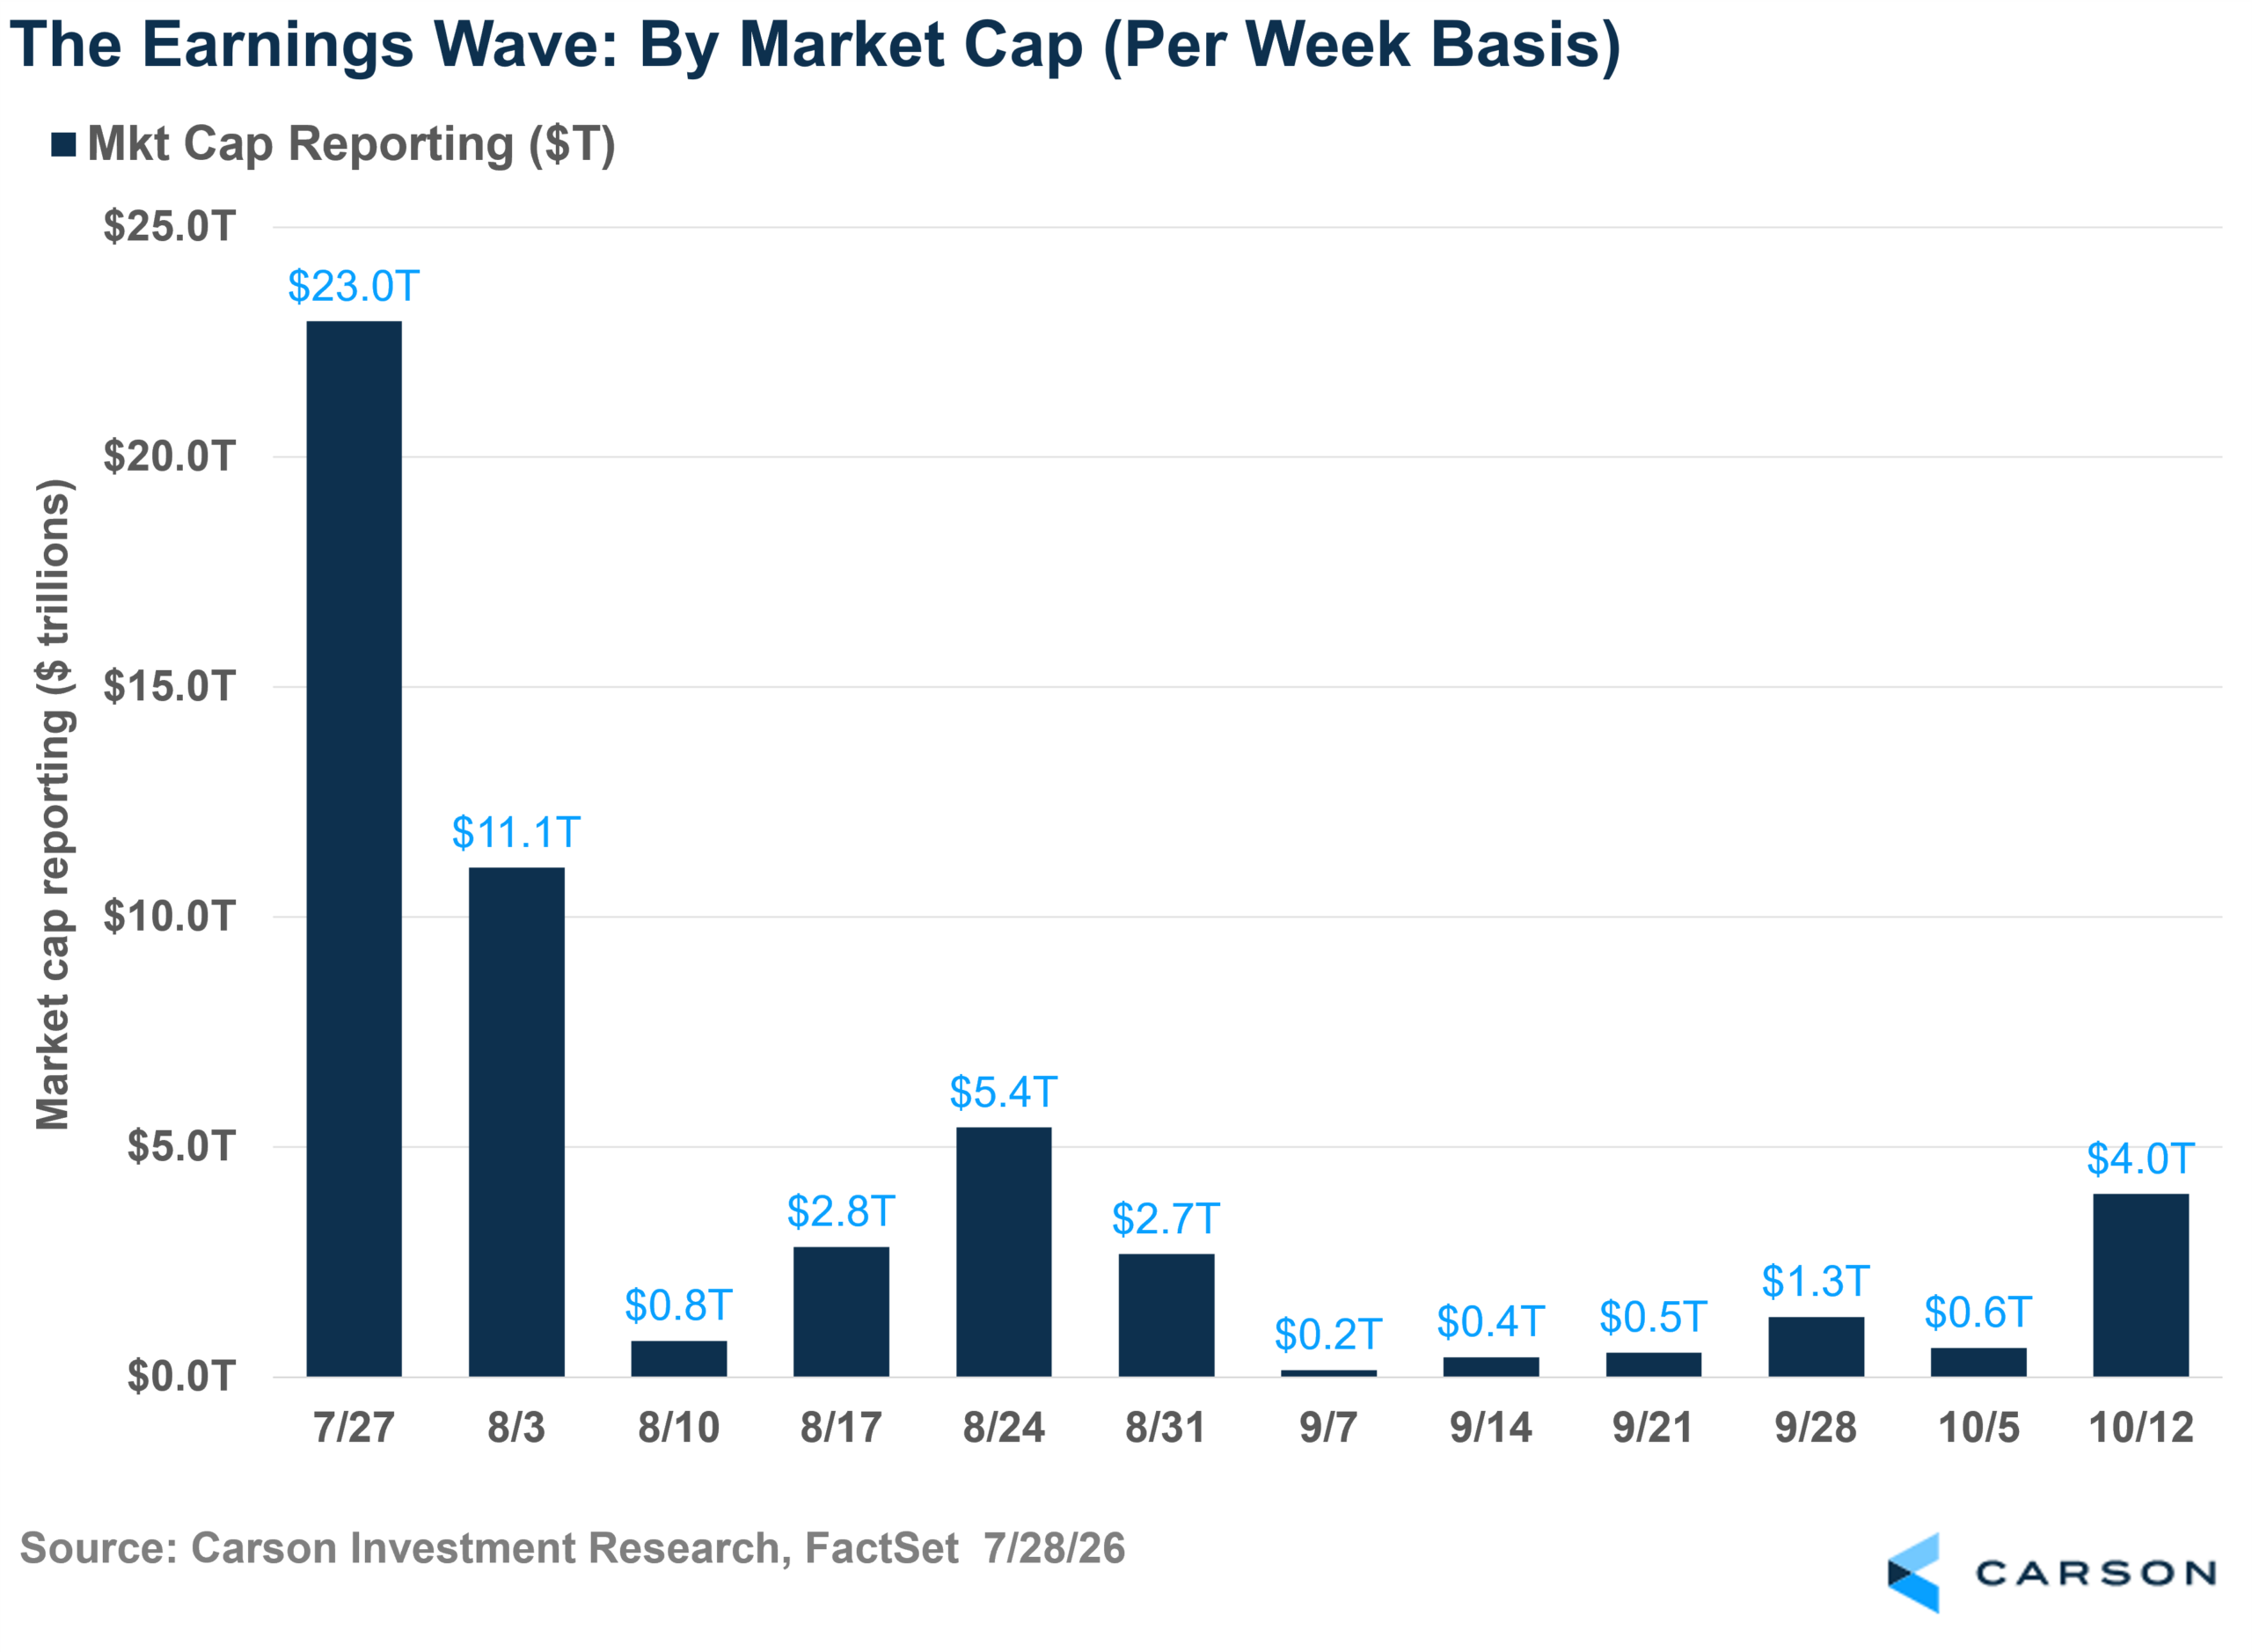
Roughly $23 trillion of market capitalization is reporting in one week, about a third of the entire index and more than double the next busiest week. Amazon and Meta are both on the calendar, alongside the rest of the megacap technology complex. The week could confirm what we’ve seen so far this quarter or could cause a major shift. Either way, the final impression of Q2 will start to firm.
Overall, it’s been a solid quarter, even wearing a headline number it didn’t quite earn. Next week we find out how much of it holds up. Back next Tuesday.
By Harry McDonald, Analyst, Investment Research
9047005.1. – 28JULY26A