
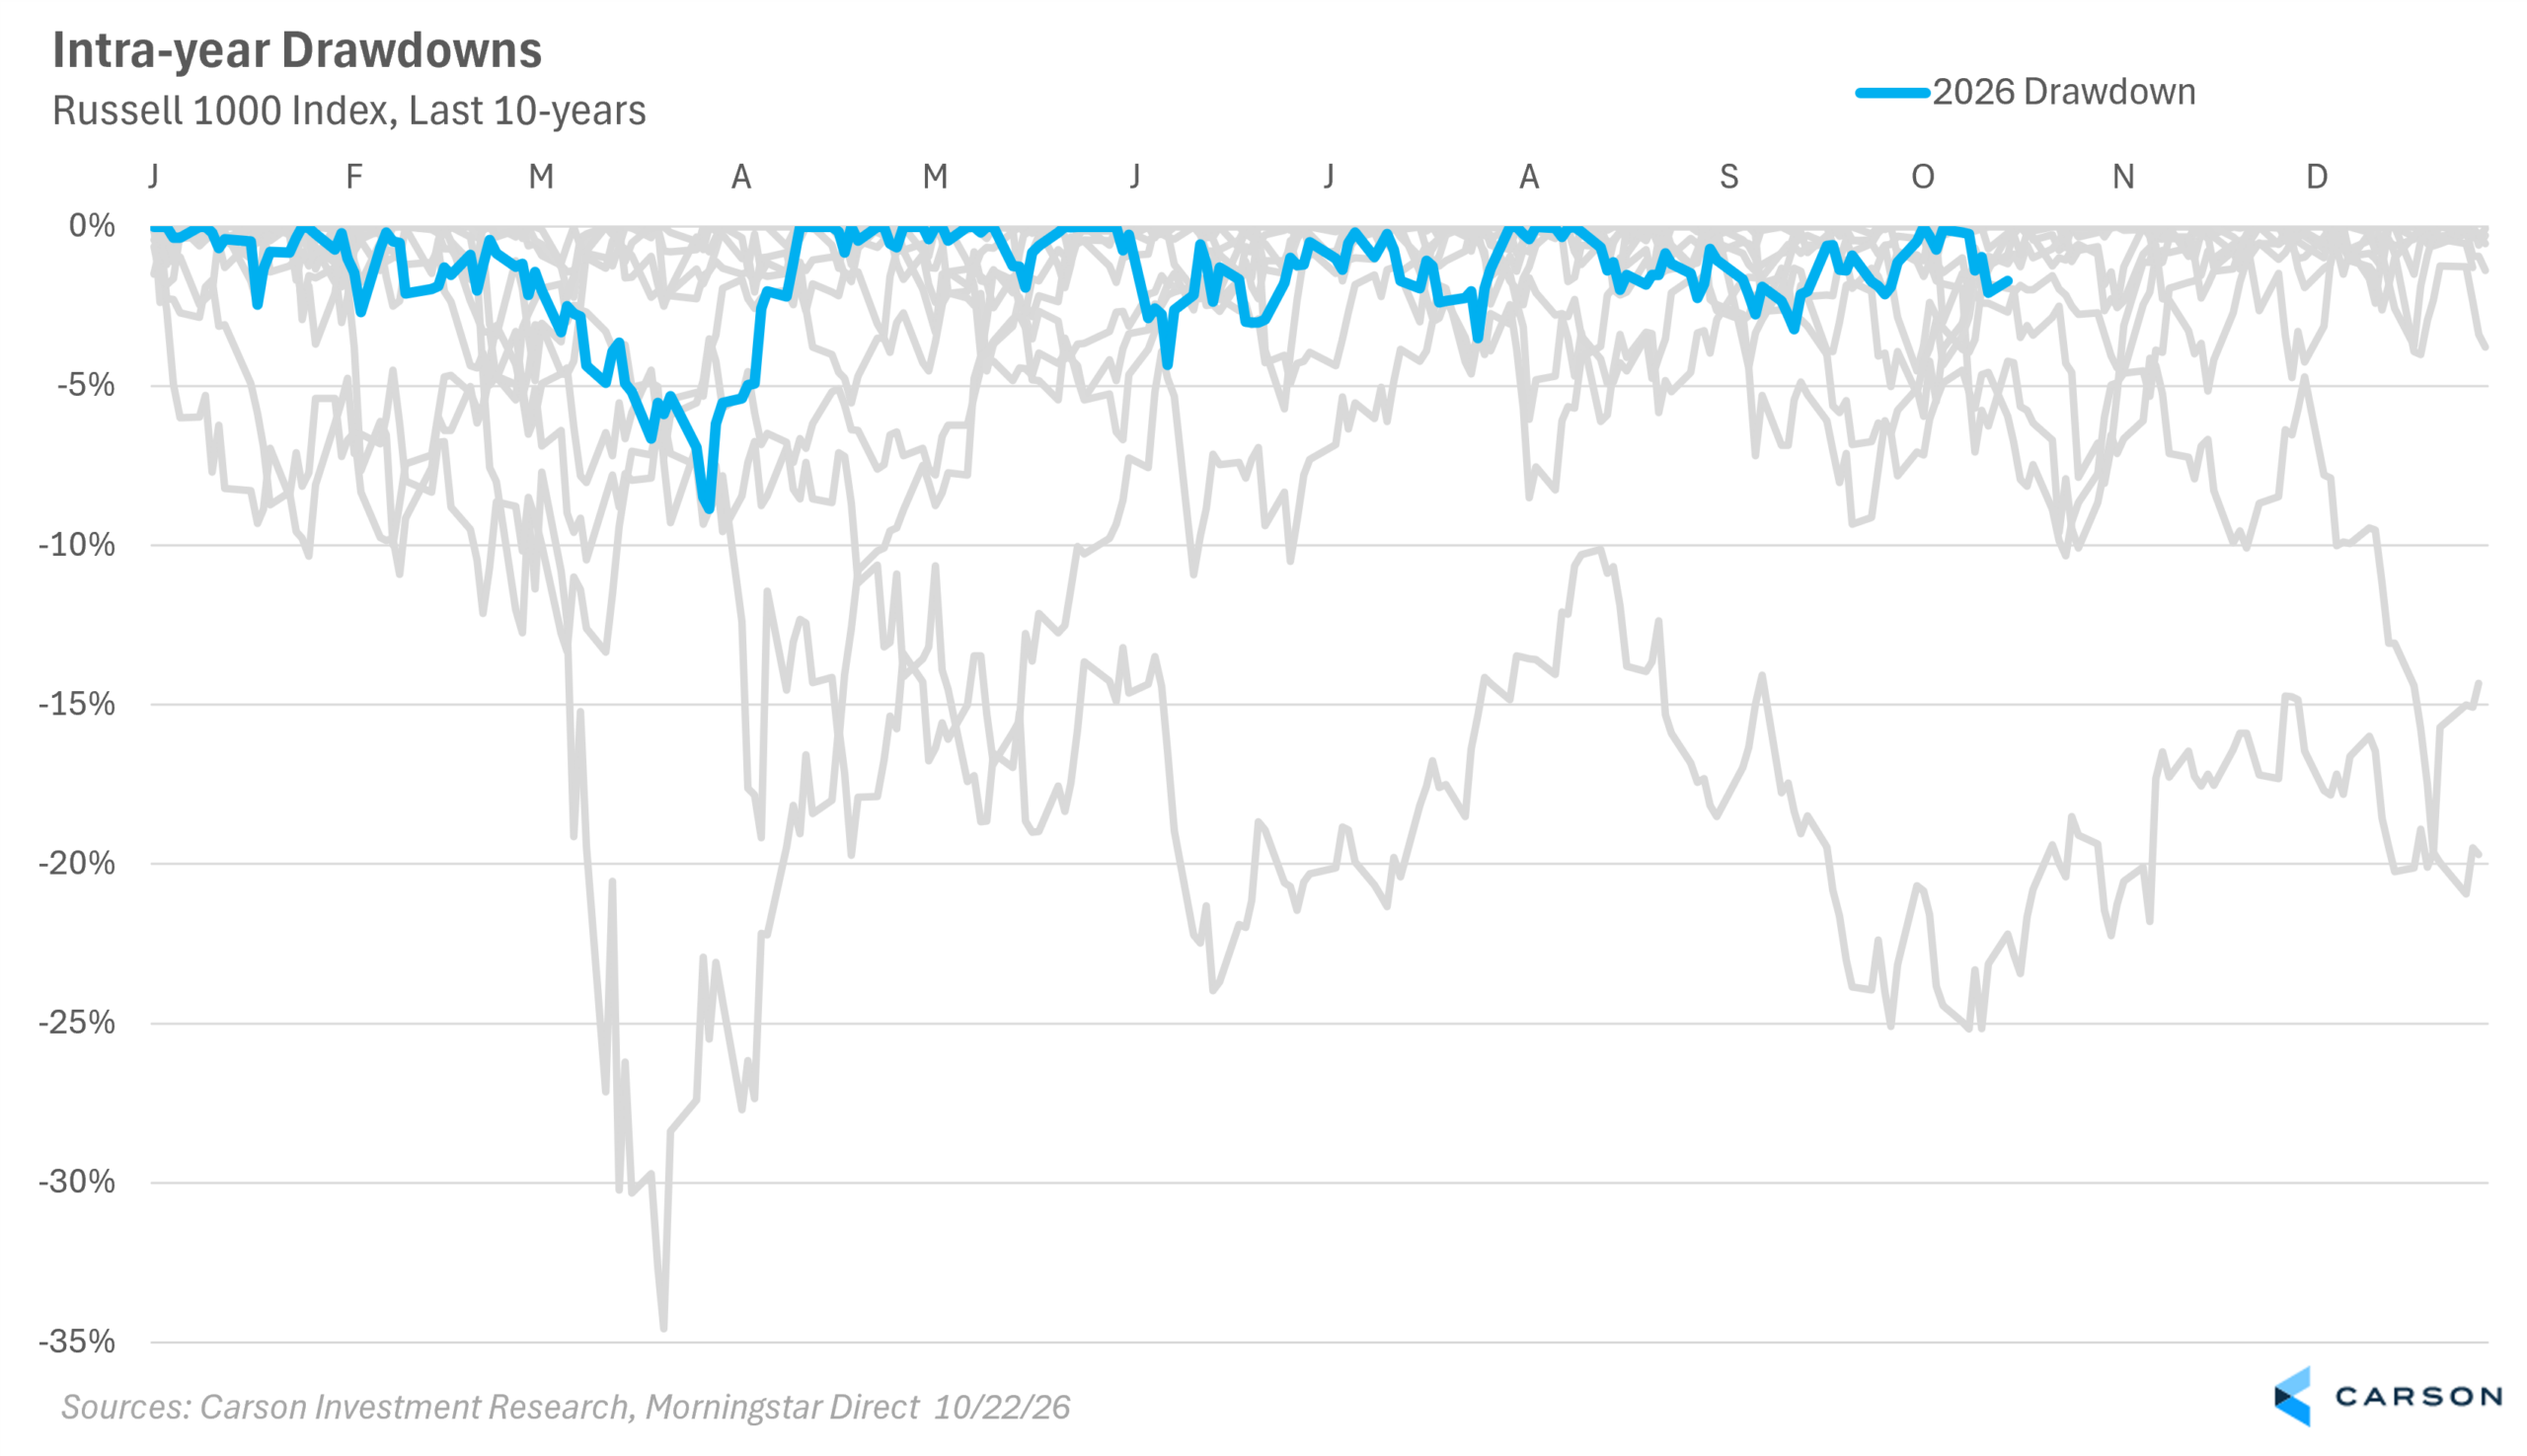
2026 has “felt” like more volatile than years past – in part due to headlines and other asset classes experiencing volatility, especially interest rates and commodities. Realistically, though, when compared to previous years, 2026 is quite tame, if not one of the tamest years in a long time. The war in Iran and the software apocalypse led to the largest drawdown of the year, yet it still stayed above the 10% “correction” level on an end-of-day basis, which we tend to see most years. That’s important to keep in mind given investor worries around AI, the economy, midterm elections, geopolitical strife, inflation, and so on. Take a look at the extra-busy chart below. Drawdowns experienced in 2026 in the Carson blue line, as compared to the past 10 years of market drawdowns.
Under the surface, as is often the case, another story is playing out. Market concentration can often hide the underlying movements across index and individual names. For this reason, I like to look at the median or average return across individual stocks, rather than just the overall index or sector index number. This can reveal that individual stocks have had much more volatility and dispersion this year than the prior chart suggests. Take a look at the chart below: large-cap indices (Russell 1000 or S&P 500, however you want to slice it) have seen a max drawdown of around 8-9% this year. But at the individual stock level, the median drawdown has been more than -24%. This is even more pronounced within sectors: the technology sector index has only seen an 11% drawdown this year, but the median stock has fallen nearly 40%!
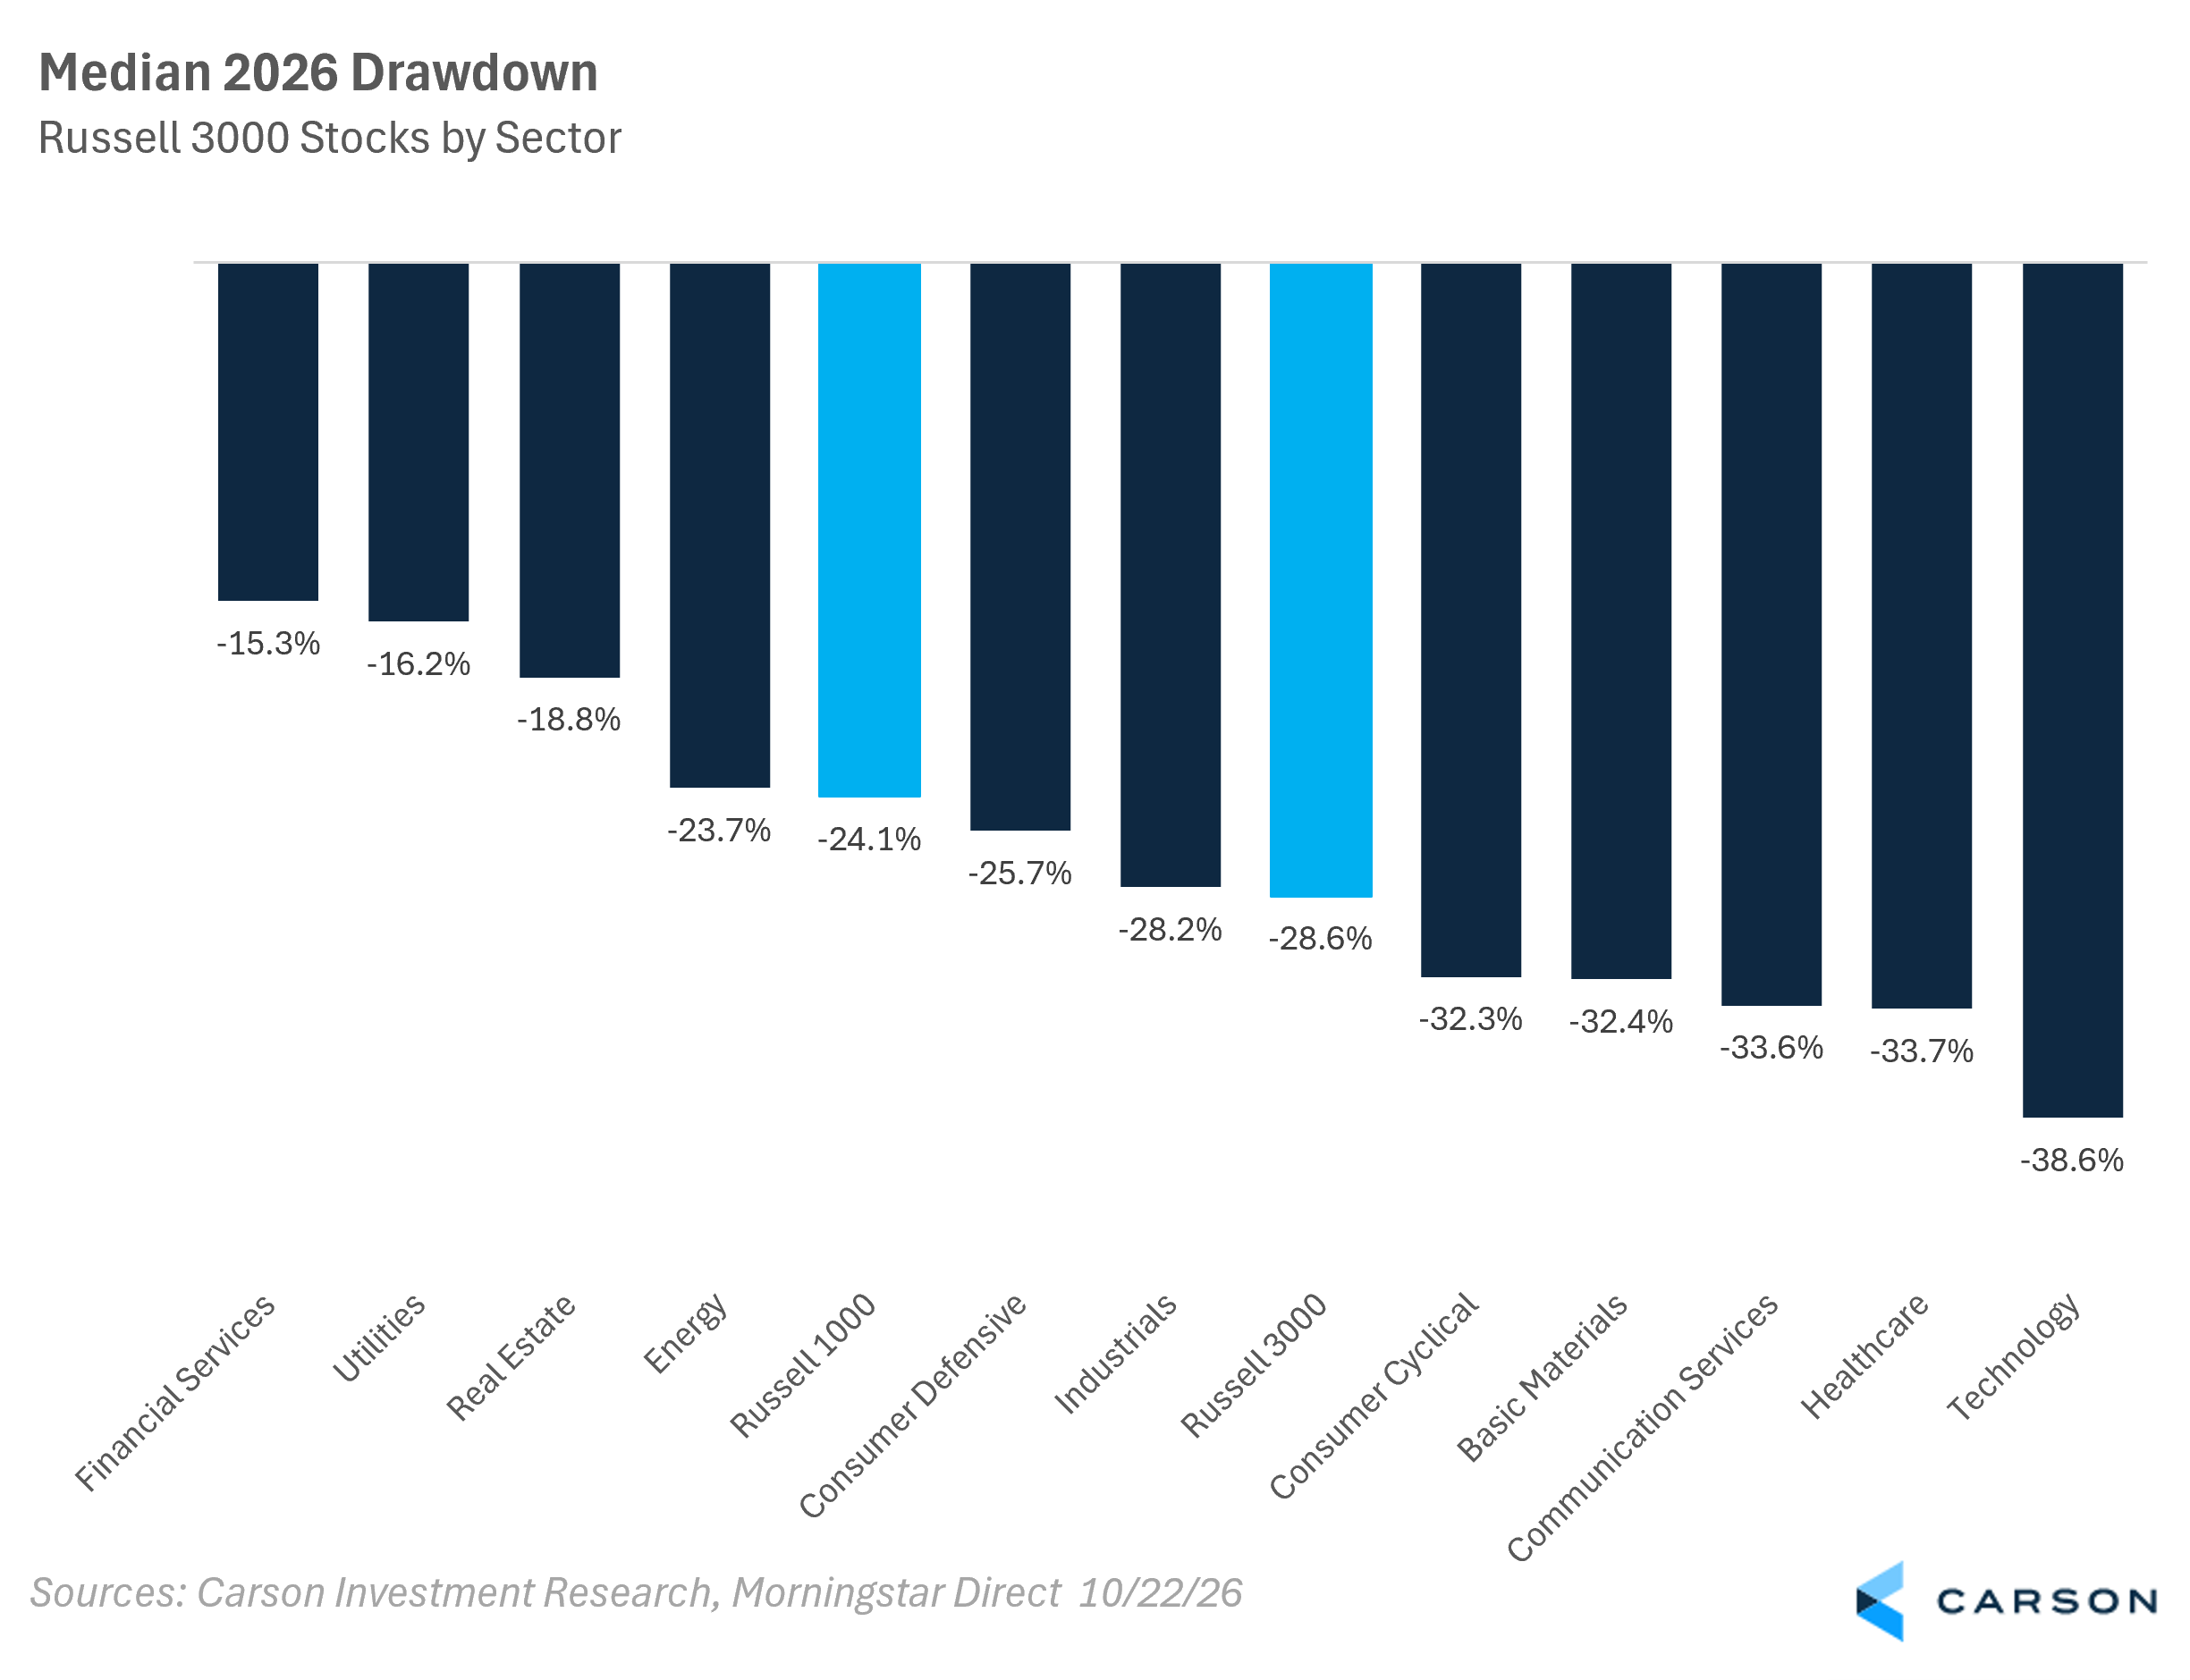
This is not a new phenomenon – it points to how powerful indexes can be and how important diversification is. Stocks don’t always fall in tandem, and investors benefit from other areas of the market balancing things out, i.e., energy stocks when oil prices were rising, A.I. stocks when software stocks were falling, etc. This also highlights something of a “flaw” in concentrated indices. Investors on the sidelines might be waiting for a market correction, that 10%-or-more decline that we almost got to earlier in the year. Well, don’t wait – the market is up 22% from the lows of the near correction earlier in the year, and as you can see in the chart – every sector has seen its median stock correct, and the broad indices have seen their median stock enter a bear market already this year!

Stay on Top of Market Trends
The Carson Investment Research newsletter offers up-to-date market news, analysis and insights. Subscribe today!
"*" indicates required fields
This type of dispersion intra-year has a couple of important distinctions and considerations:
- Sector and industry rotation can be powerful. When done in a diversified and risk-controlled way, taking advantage of these fluctuations can add value and risk management to portfolios. We’ve done a lot more of this inside portfolios and added managers to the platform that do the same.
- Active Managers have a lot to choose from. Active stock pickers are able to pick up on things like the software apocalypse, shifts in commodity prices, and predictions about which stocks will benefit from AI now, next, and after that. Not all are created equal – but sifting through those that stick with their process can be powerful.
- Tax Loss Harvesting opportunities abound. With the median stock in the Russell 1000 falling 24% from peak-to-trough just this year, that is a fantastic backdrop to enjoy abundant tax swaps – and these charts are only equities! Fixed income markets have seen an equally abundant set of loss-harvesting opportunities at both the security and fund level.
Markets move fast and reprice the future all day, every day. You can ride that wave, or take advantage of it, just don’t wait on the sidelines. There is always uncertainty and a steep future risk curve, but markets love to climb it. Under the surface, there are plenty of opportunities and changes happening that well-managed portfolios and a disciplined approach to investing will always be ready for.
For more content by Grant Engelbart, VP, Investment Strategy & Research, click here.
9195982.1. – 22OCT26A


