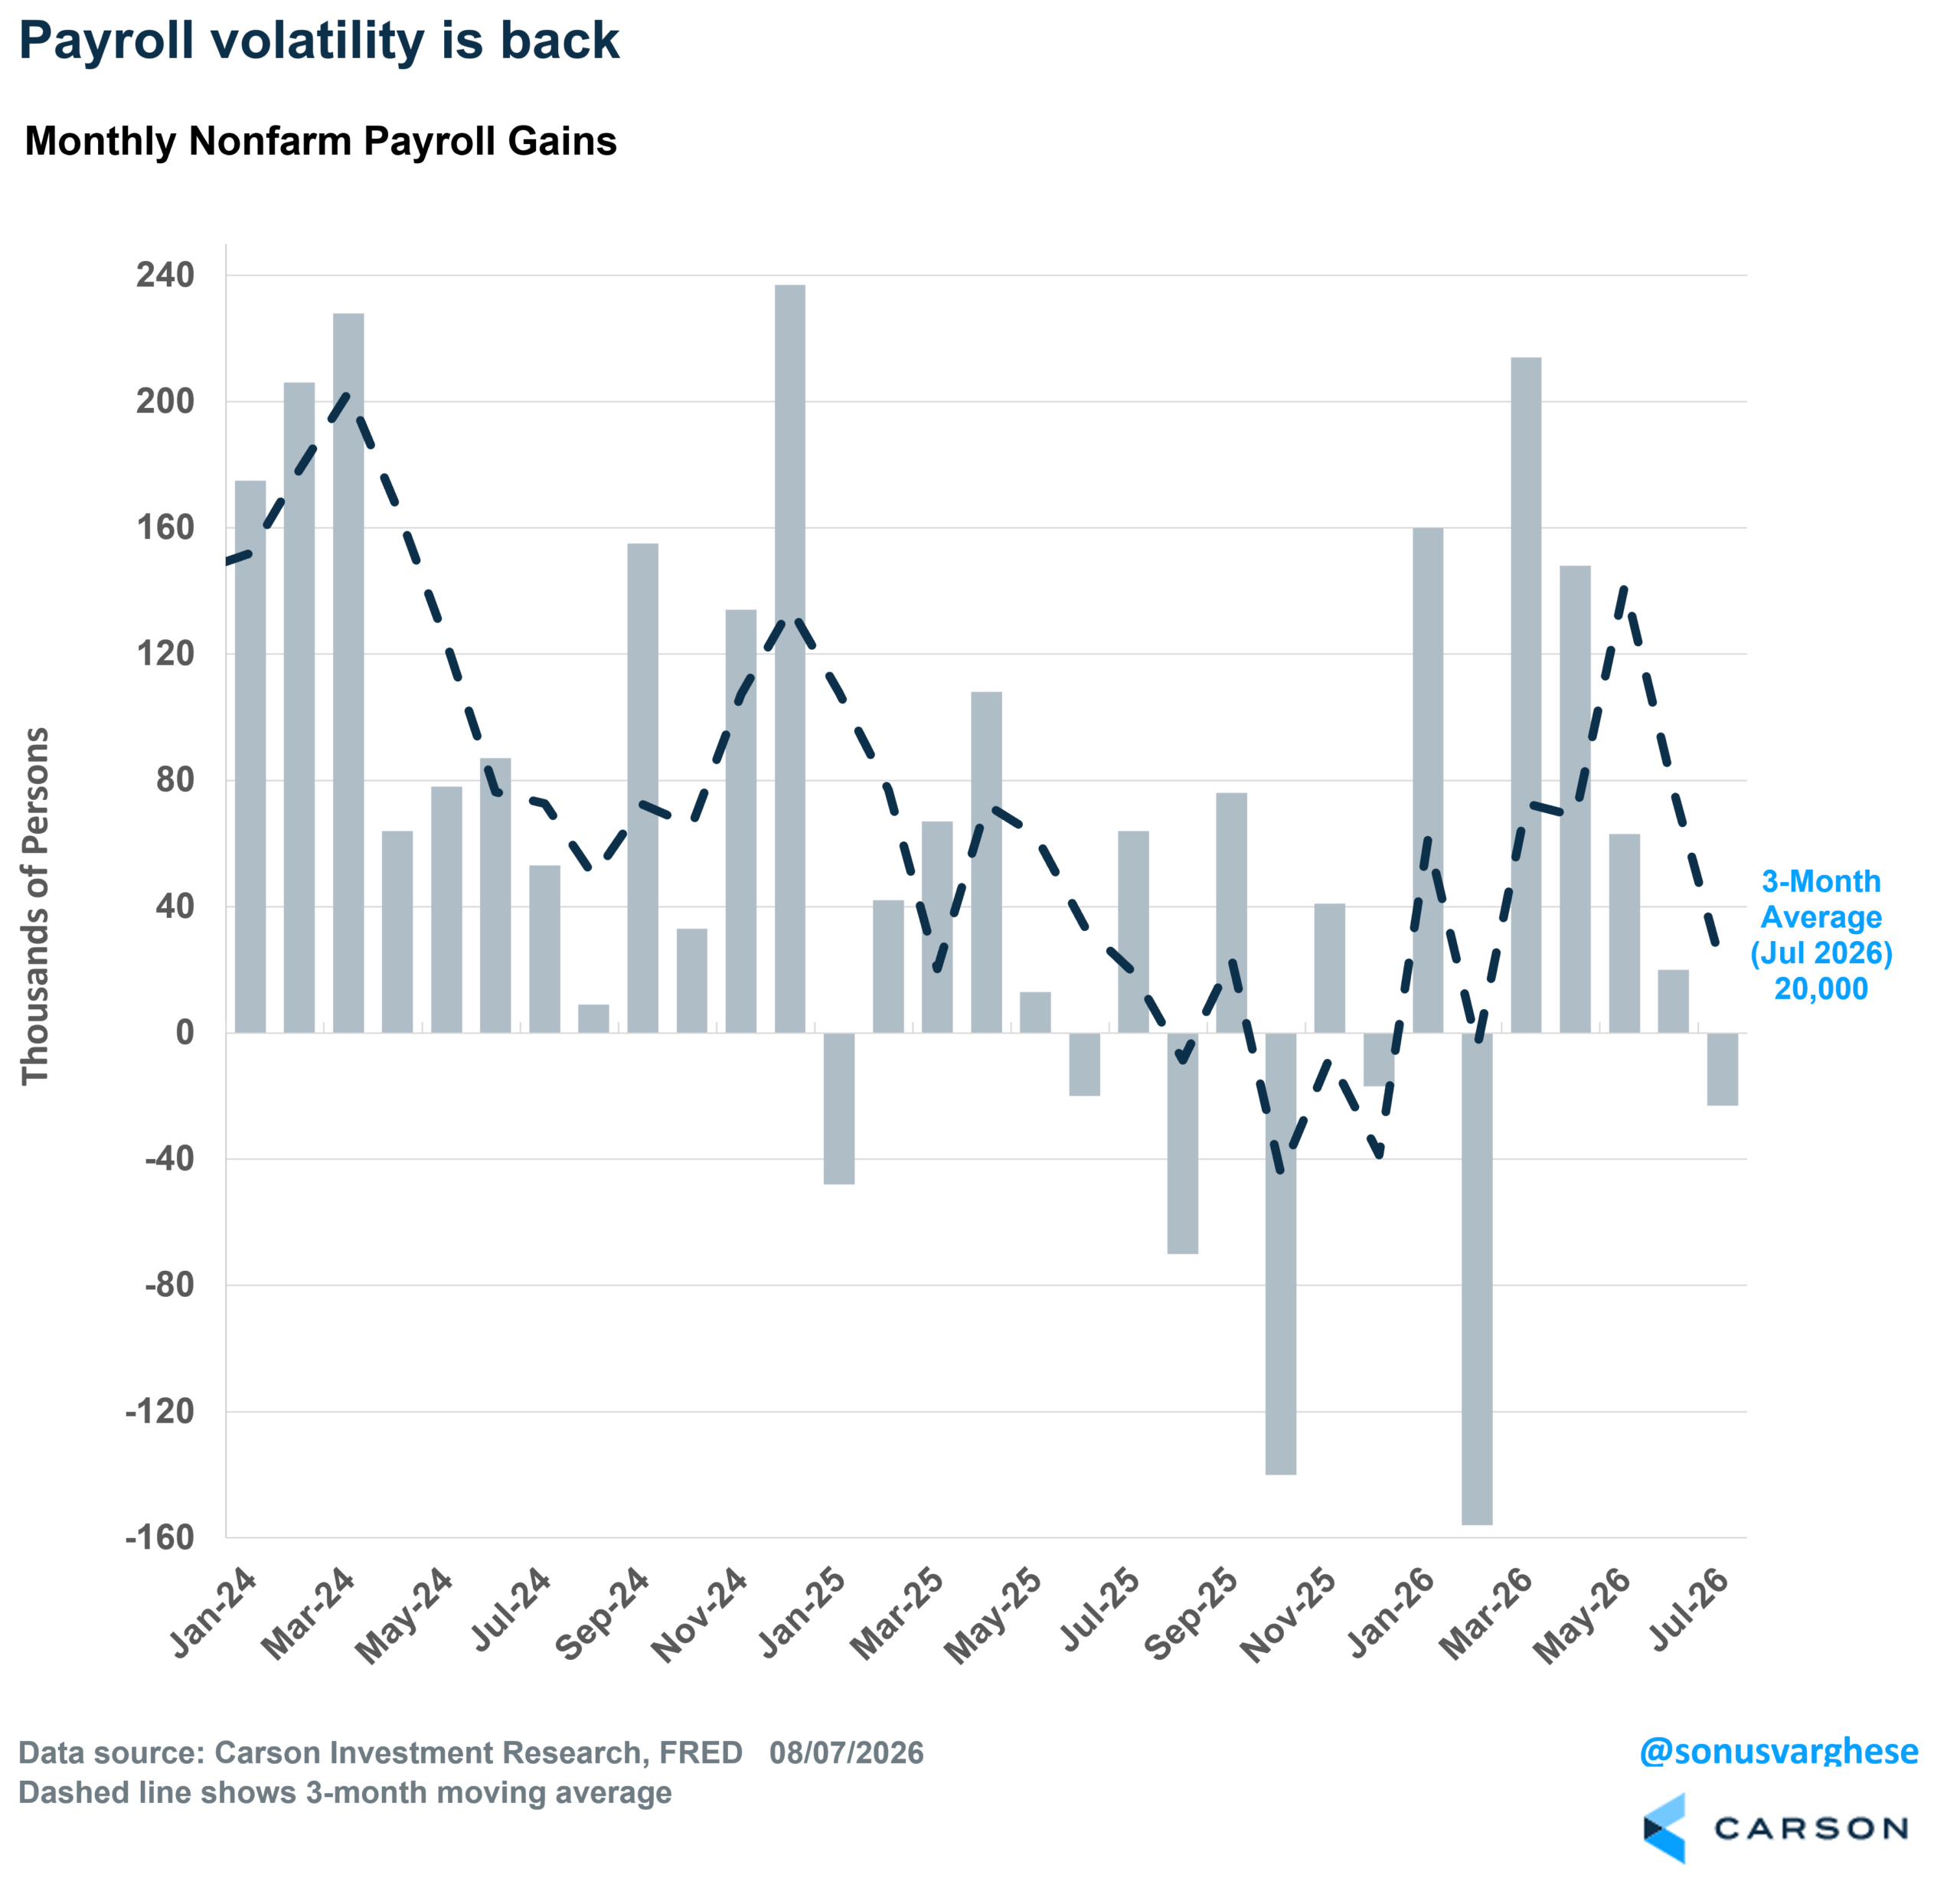
Last month I wrote that the payroll data threw us a bit of a curveball, and here we are again. The economy shed 23,000 jobs in July, well below expectations for an 80,000 gain. The headline number looks ugly, but payroll data comes with a lot of noise, and the noise has been especially loud lately. Once you step back and focus on the big picture, the labor market is in fine shape. Let’s walk through it.
Start with the miss itself, because it wasn’t just July. We also got sizable downward revisions to prior months. June was cut from +57,000 to just +20,000, and May, originally reported at +172,000, now stands at +63,000. Put together, employment in May and June was 103,000 lower than previously reported. (April went the other way, revised up before settling at +148,000.) A month ago I noted that the second quarter was averaging 111,000 jobs a month. After revisions, that average is closer to 77,000, and the 3-month average through July is now running at just 20,000. This is exactly why I keep saying not to put too much weight on any single payroll print. The revisions can change the story well after the fact, and right now the story they’re telling is of a labor market that’s growing more slowly than the initial numbers suggested.
So what happened in July? A lot of it looks like quirks rather than genuine weakness. Government payrolls fell 53,000, almost all of it in local government education, which shed 50,000 jobs. That’s very likely a seasonal adjustment issue tied to school calendar timing rather than school districts suddenly laying off teachers en masse. Leisure and hospitality fell 40,000, and the timing there is telling. The World Cup gave those industries a hiring boost earlier this summer, and July looks like the payback as that rolled off. Retail also declined by about 19,000, concentrated in warehouse clubs, supercenters, and general merchandise stores (-21,000) along with gasoline stations (-5,000). Financial activities shed another 14,000. On the plus side, health care added 22,600 jobs and continues to do a lot of the heavy lifting.
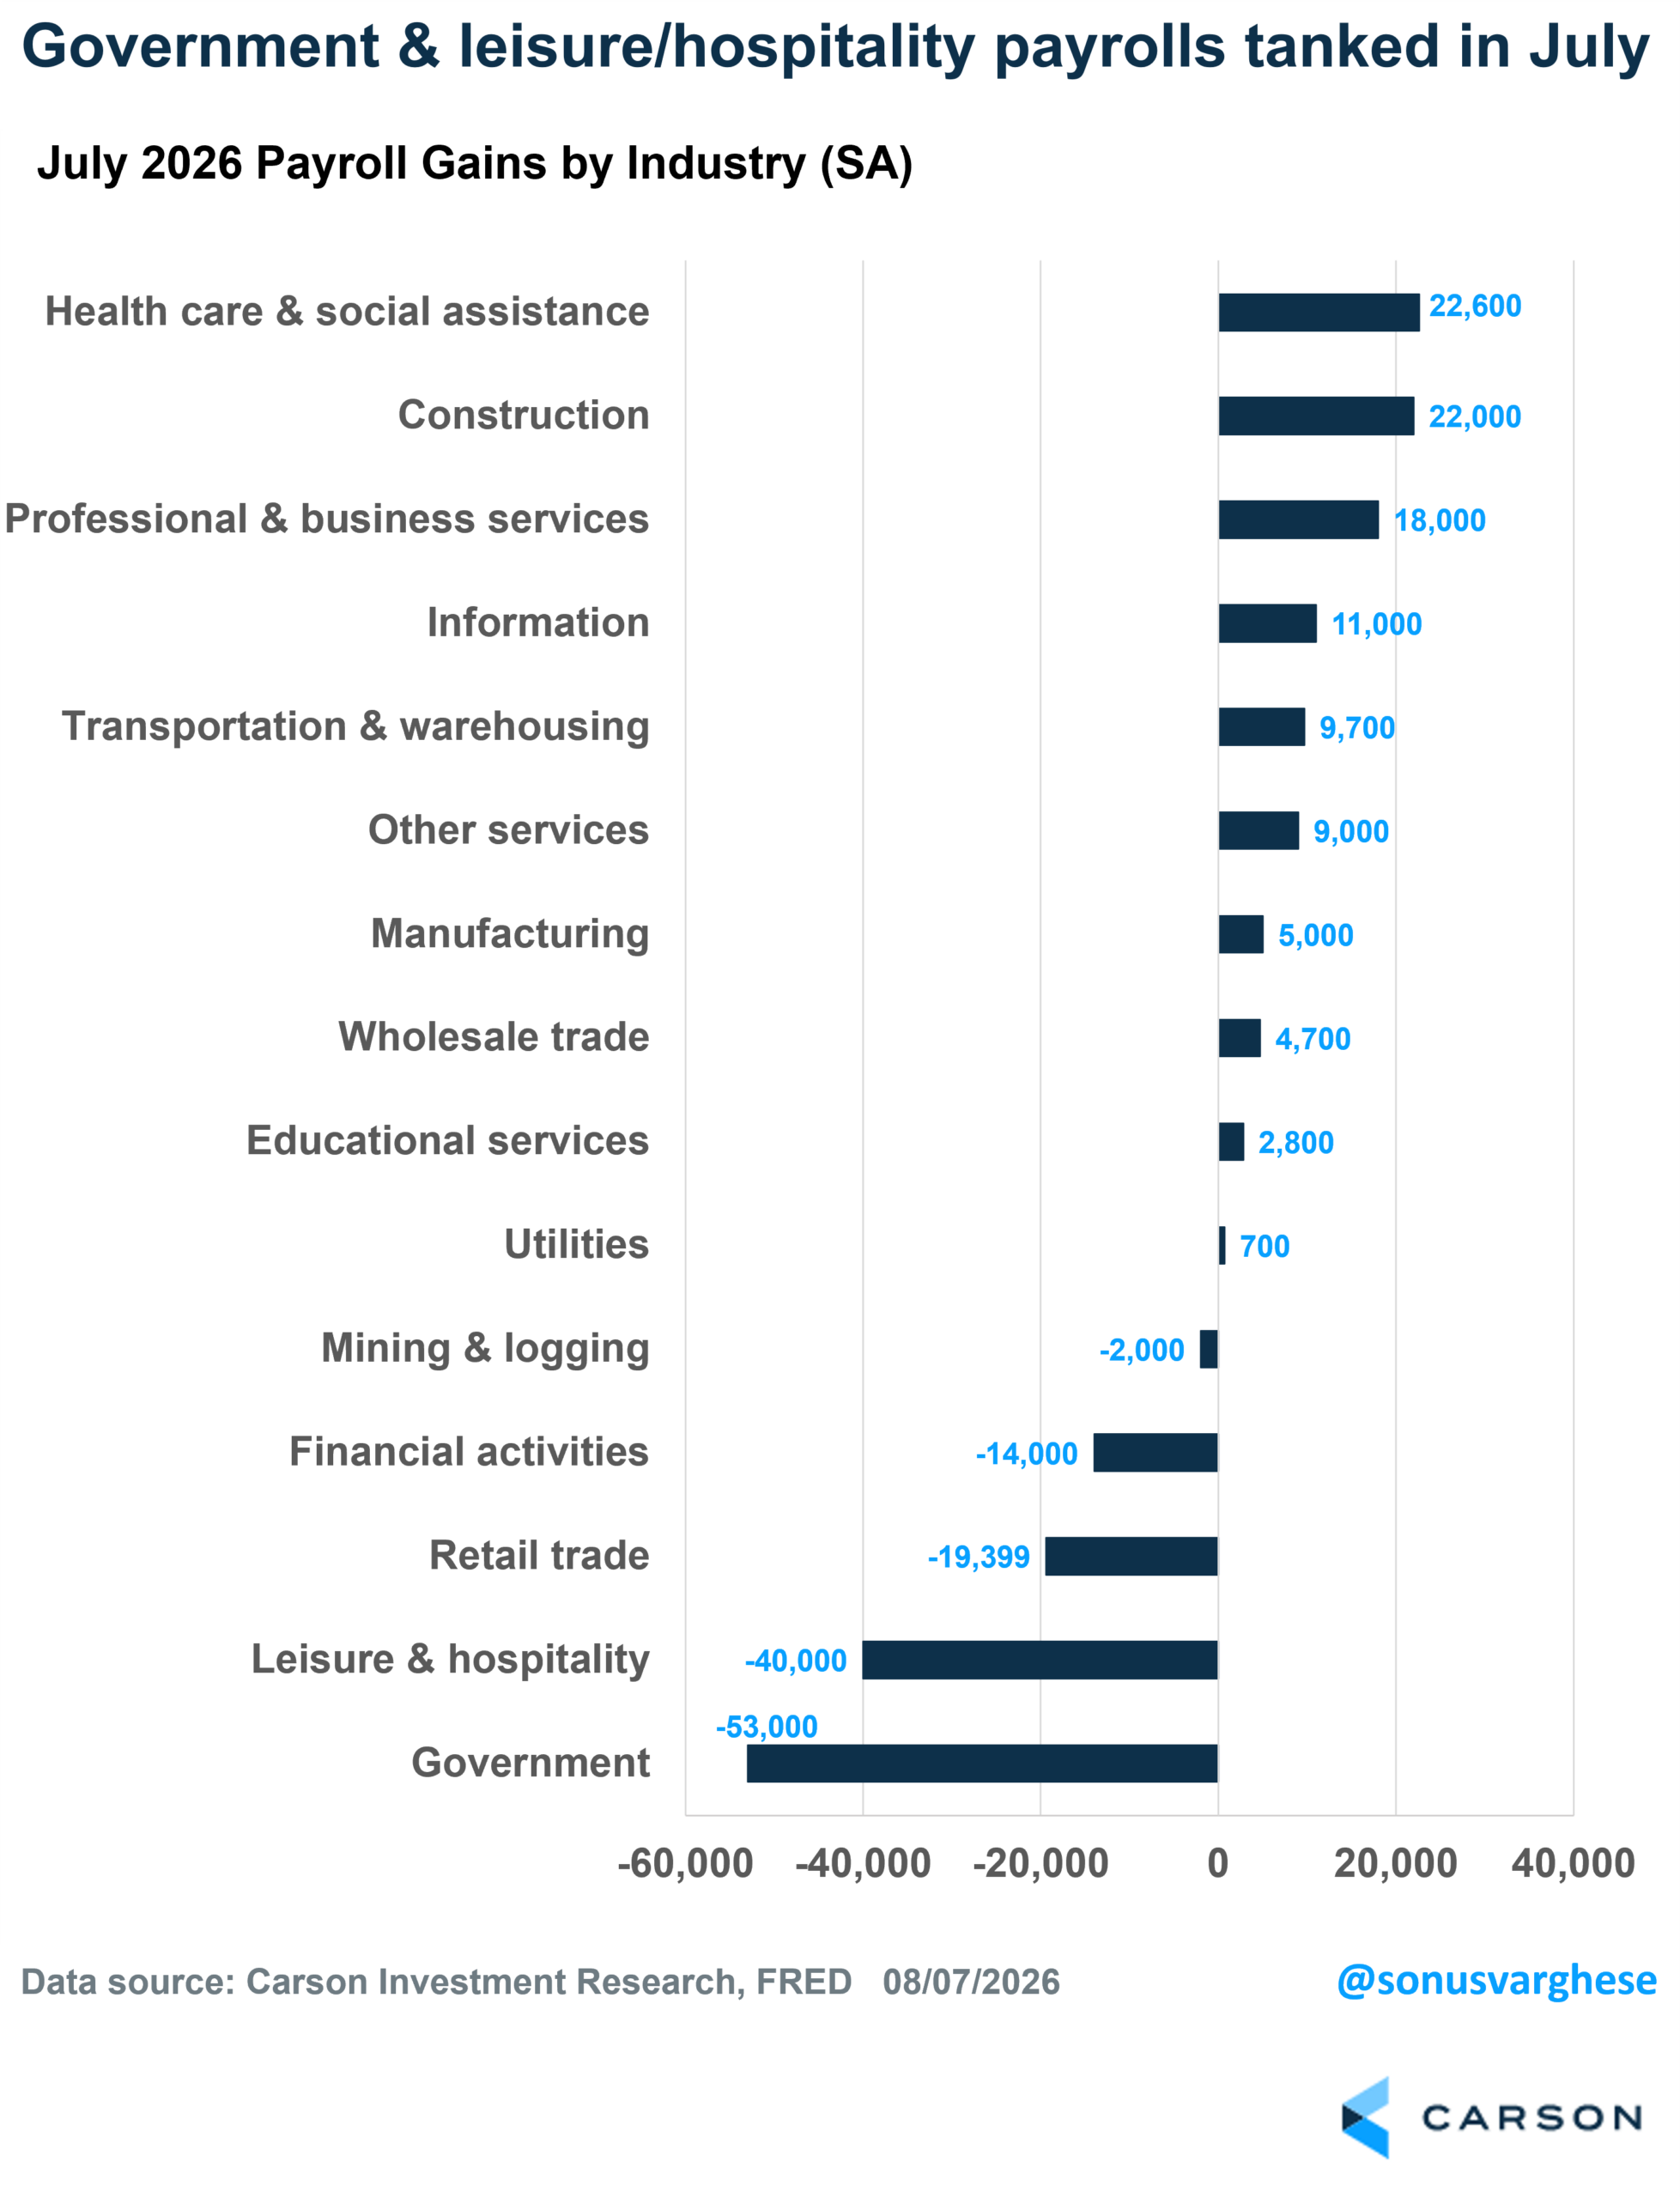
One interesting detail: construction added 22,000 jobs in July, and the gain came entirely from specialty non-residential contractors. Housing is not driving that. The much more likely explanation is the datacenter construction boom, which keeps showing up in the hard data even as people debate whether AI capex is sustainable. For now, it’s putting people to work.

Stay on Top of Market Trends
The Carson Investment Research newsletter offers up-to-date market news, analysis and insights. Subscribe today!
"*" indicates required fields
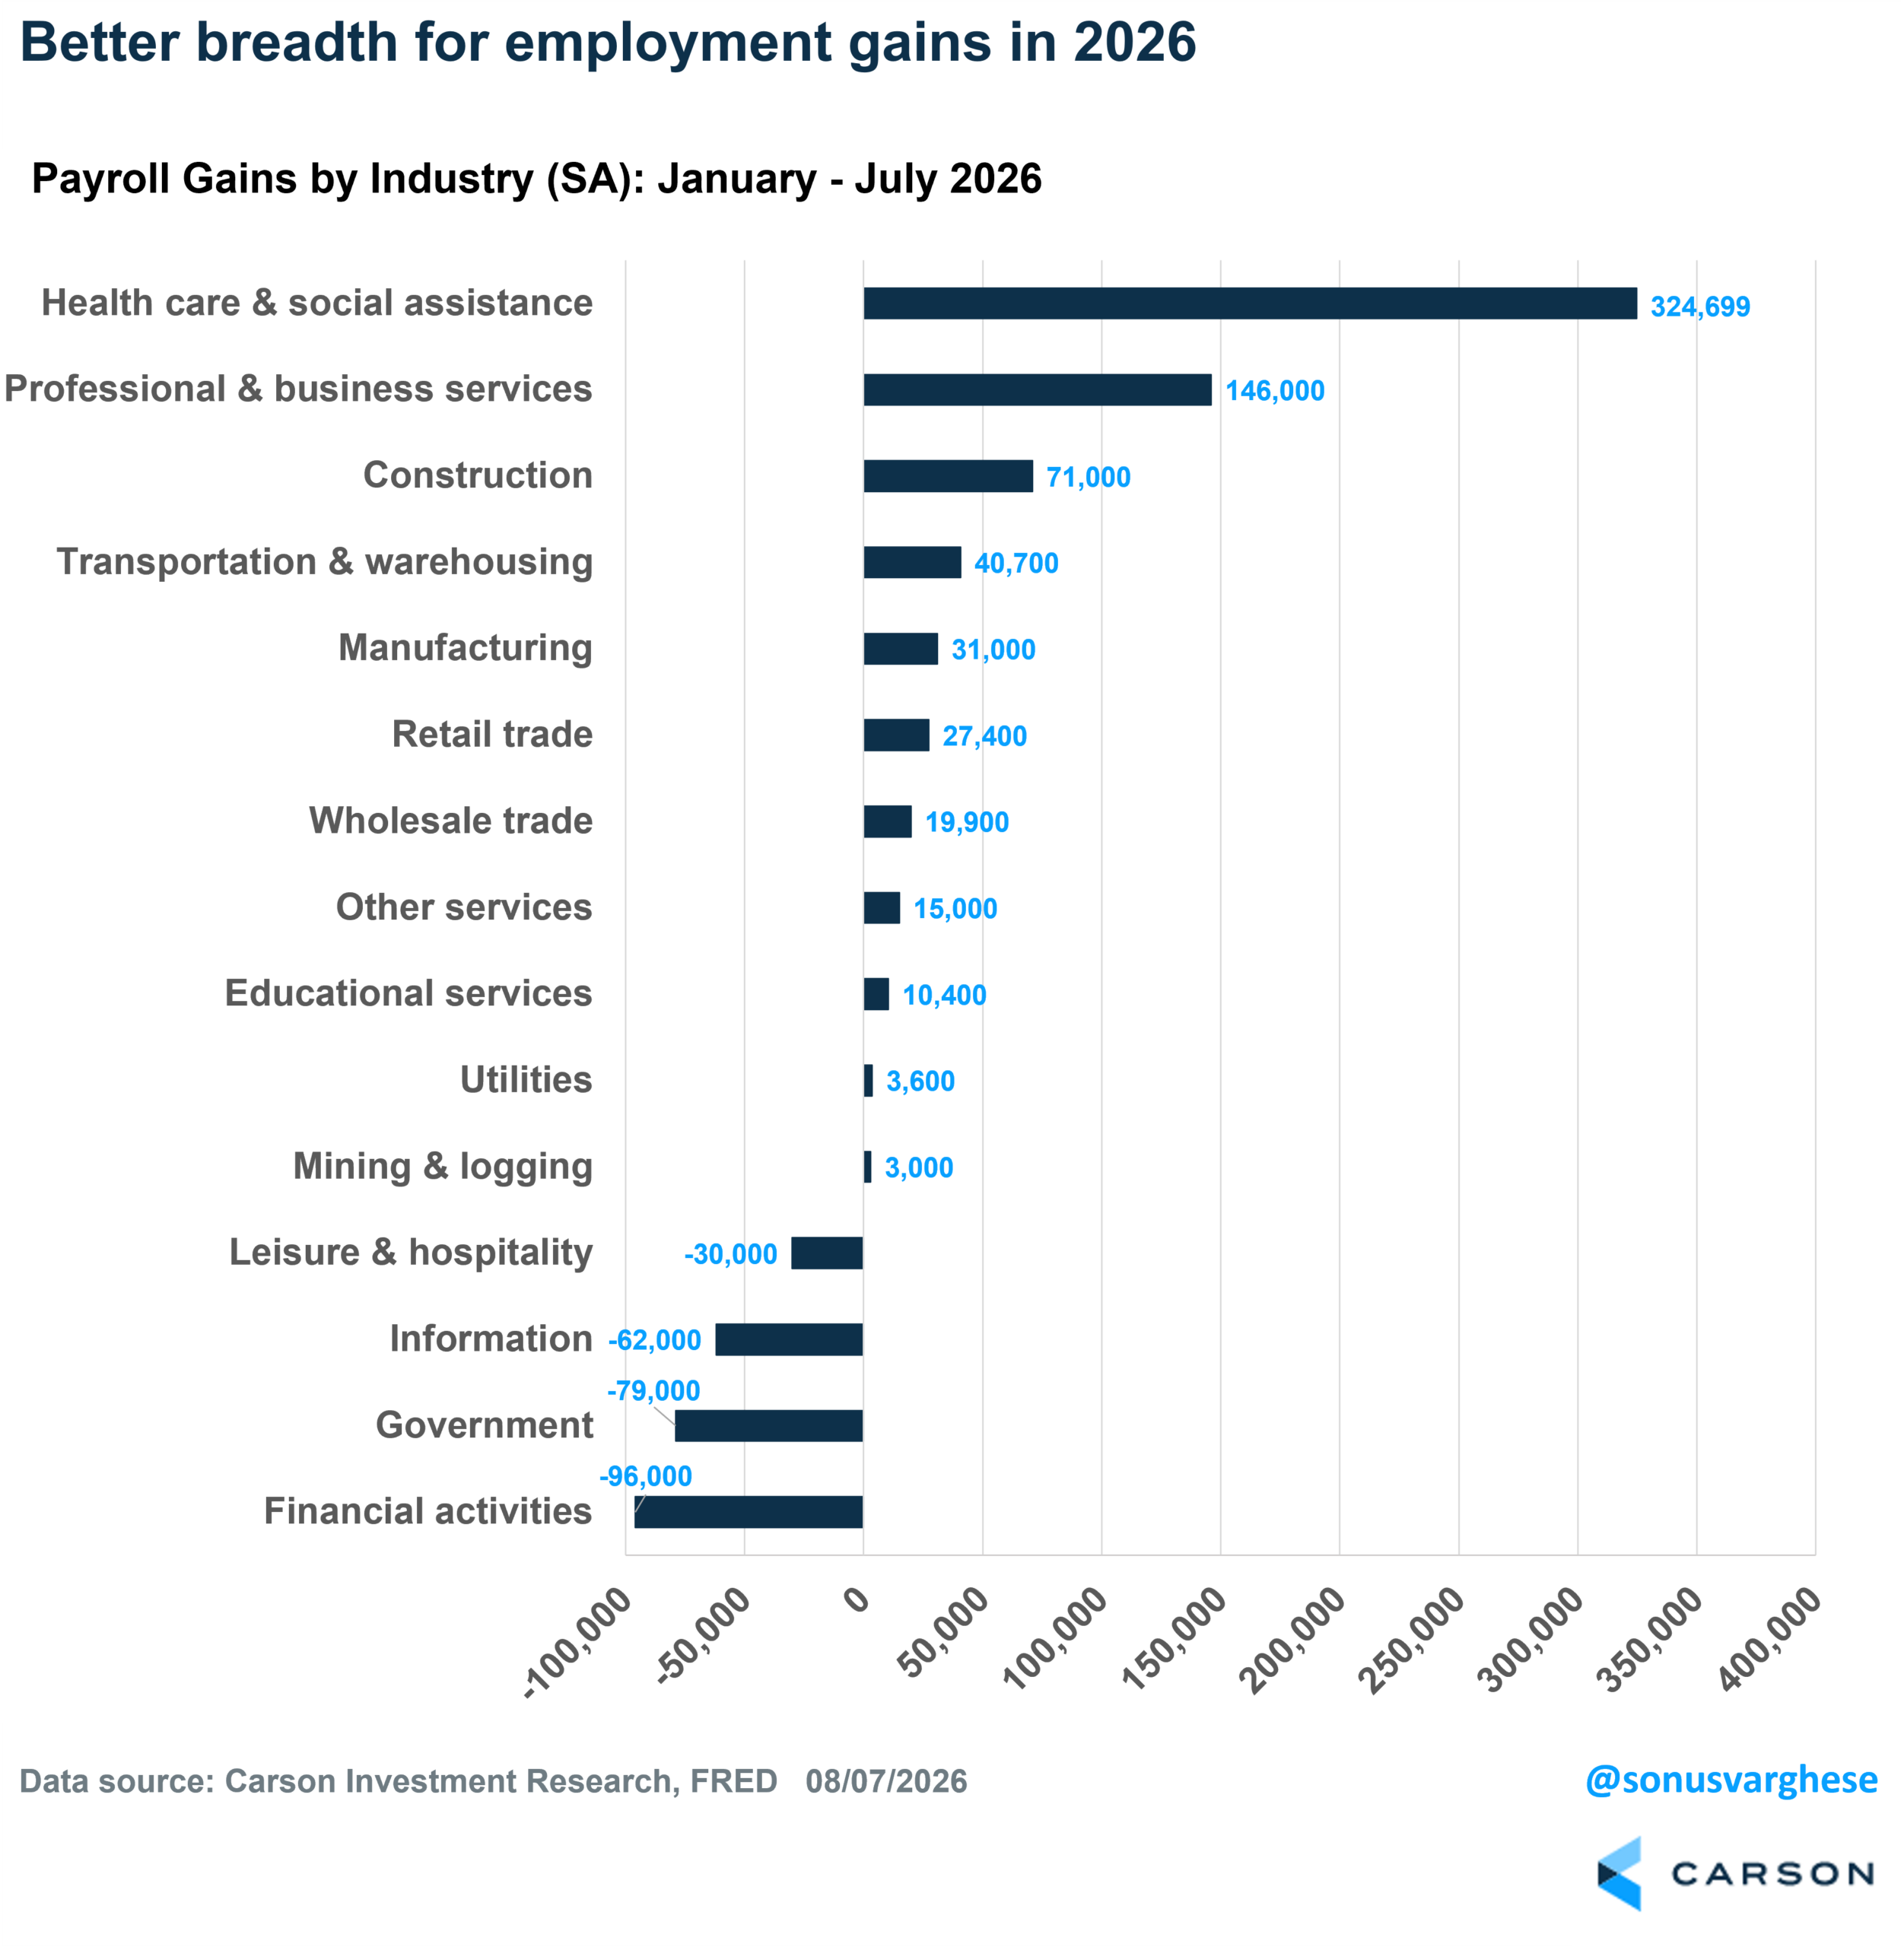
Zooming out to the full year makes the picture look better than the July headline. Job gains in 2026 have been broader than what we saw last year, when health care and not much else was carrying the load. Health care and social assistance still leads with about 325,000 jobs added through July. Still, professional and business services has added 146,000 and construction 71,000, with additional gains across transportation, manufacturing, retail, and wholesale trade. The weak spots are concentrated in financial activities (-96,000), government (-79,000), and information (-62,000). That’s a real drag, but it’s a narrow one.
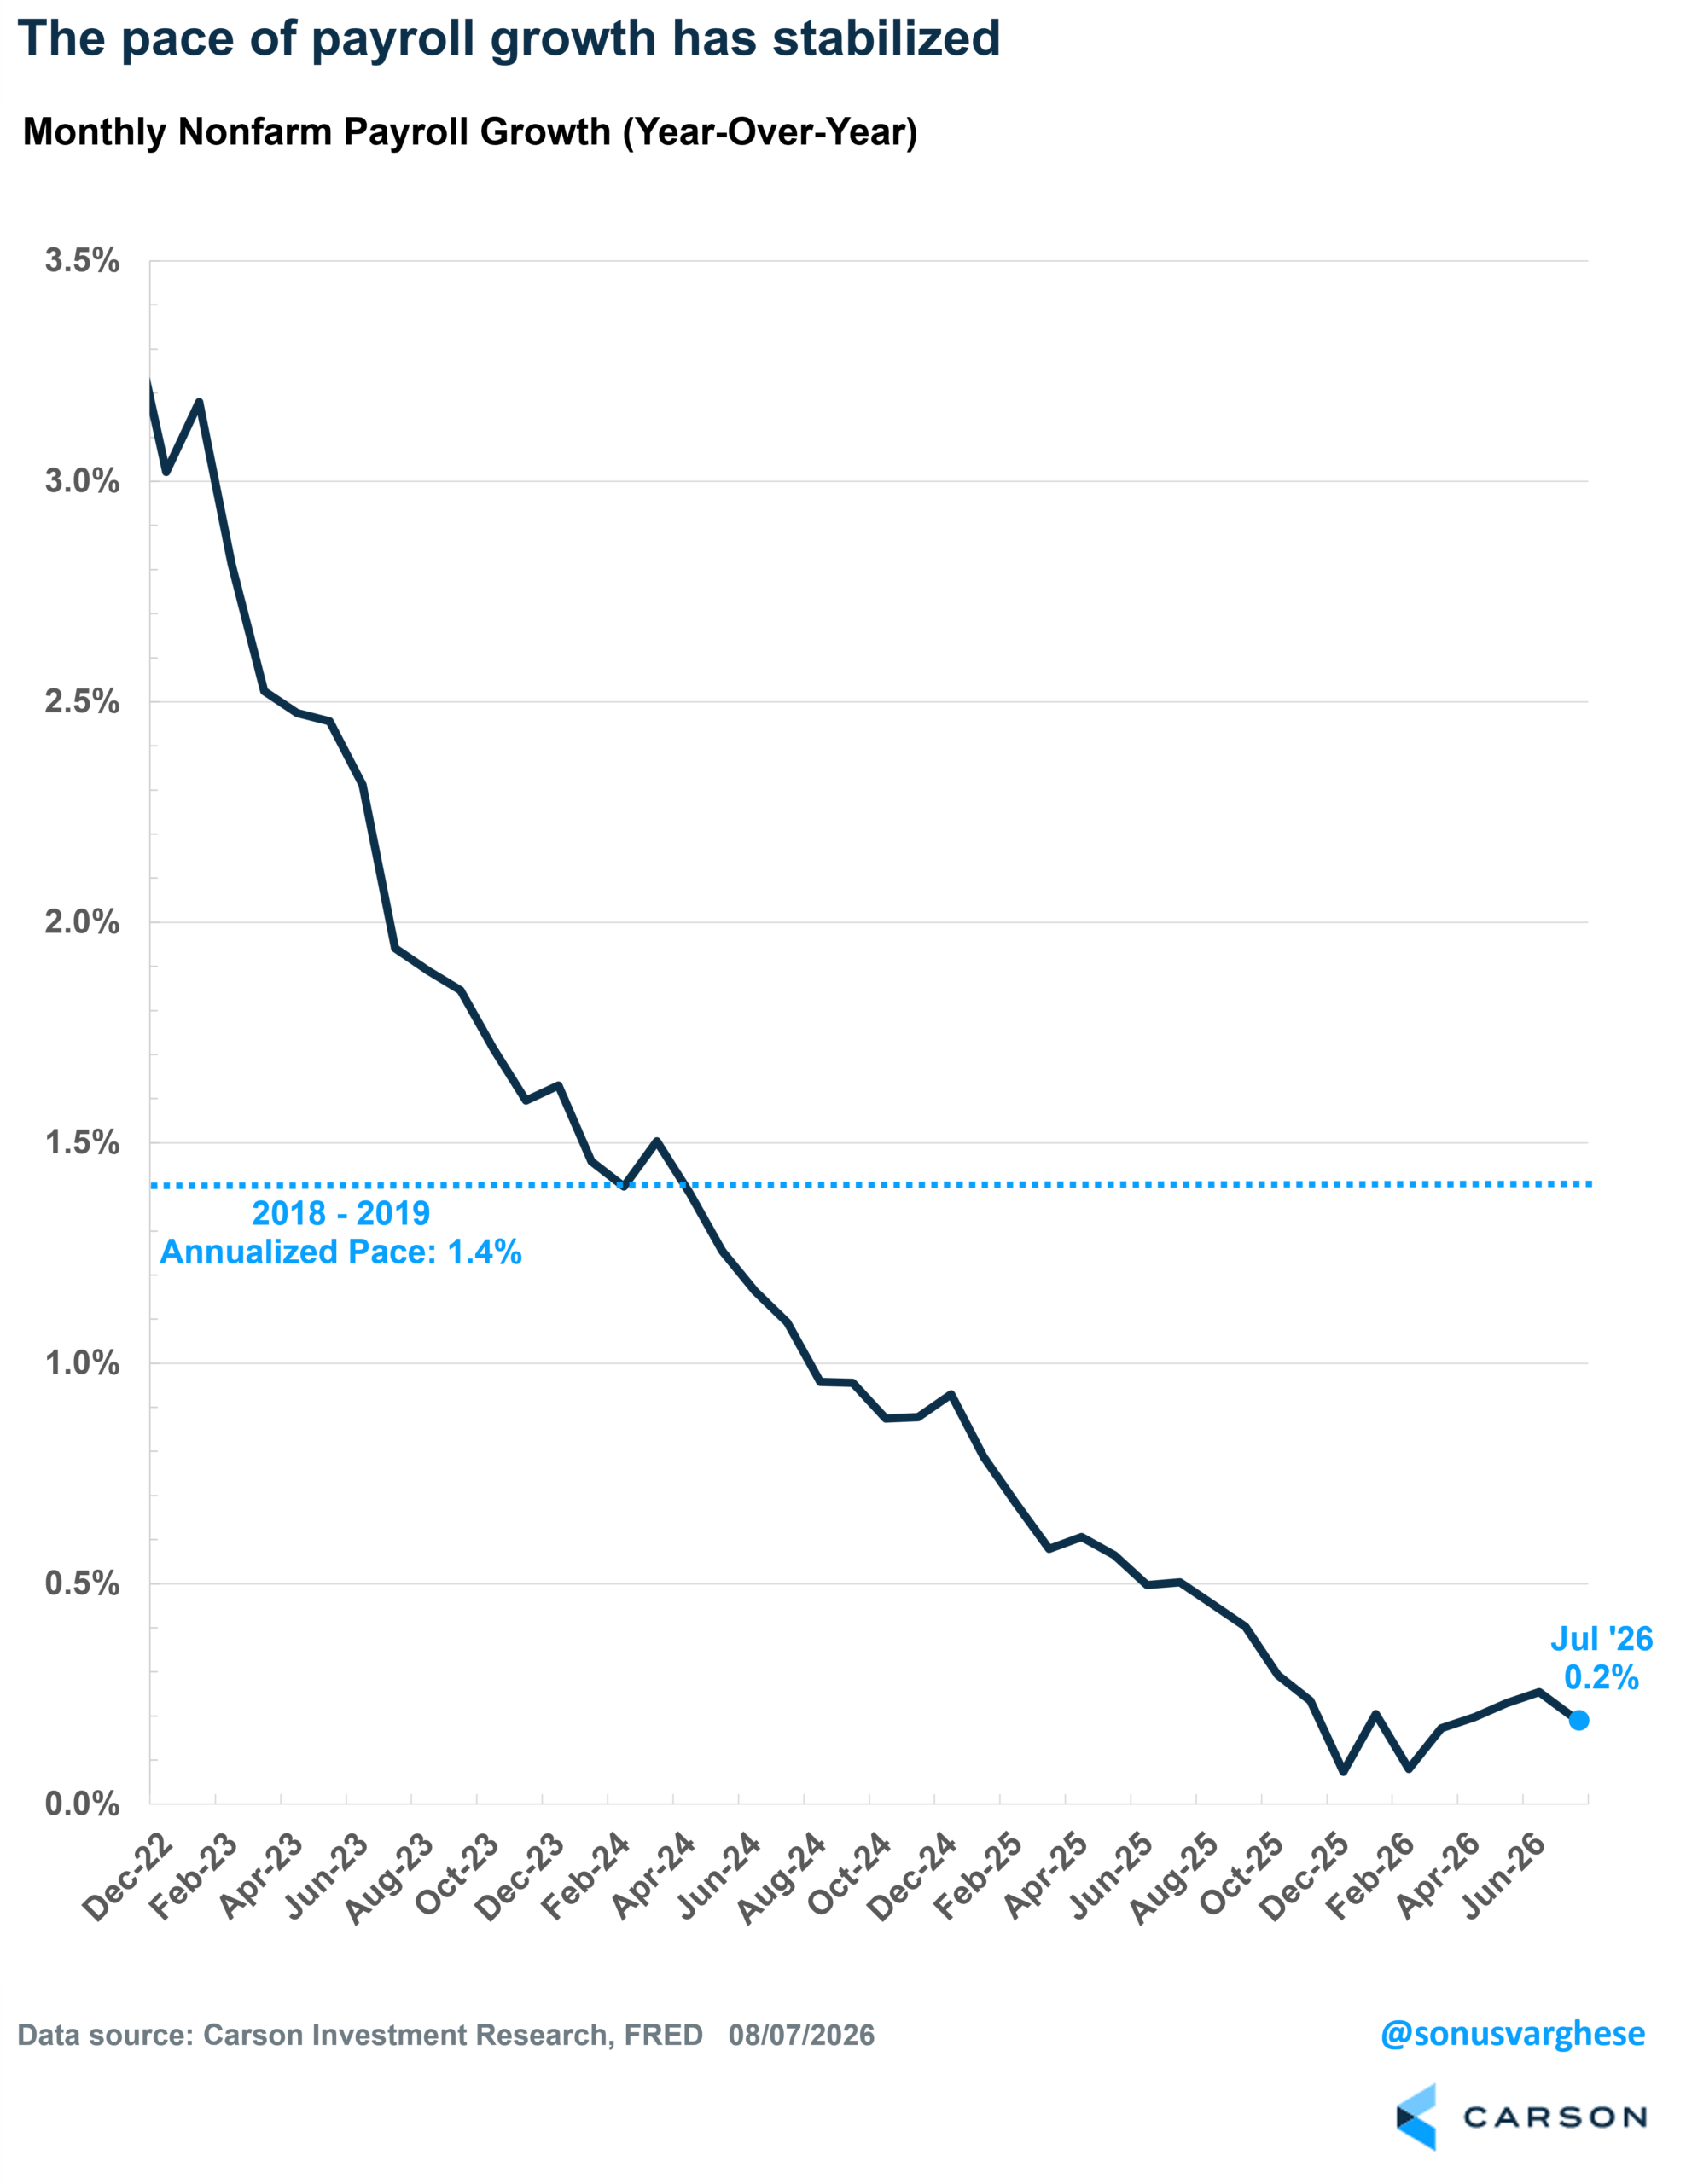
Another way to see where the labor market stands is the year-over-year pace of payroll growth, which is running at 0.2%. That’s well below the 2018-2019 pace of 1.4%, but the important thing is that the line has stopped falling. Job growth has stabilized, albeit at a low level, and that’s consistent with a labor market where supply has shrunk. With immigration having slowed sharply, there are fewer workers available to hire, which also means the “breakeven” pace of job growth needed to hold the unemployment rate steady is much lower than it used to be. The economy likely needs to create less than 50,000 jobs a month to keep the unemployment rate from going up. However, the payroll survey has a 90% confidence interval of plus/minus 120000 jobs, and that means a negative payroll print shouldn’t be surprising at all.
The Big Picture: Unemployment Is Historically Low, and Layoffs Are Even Lower
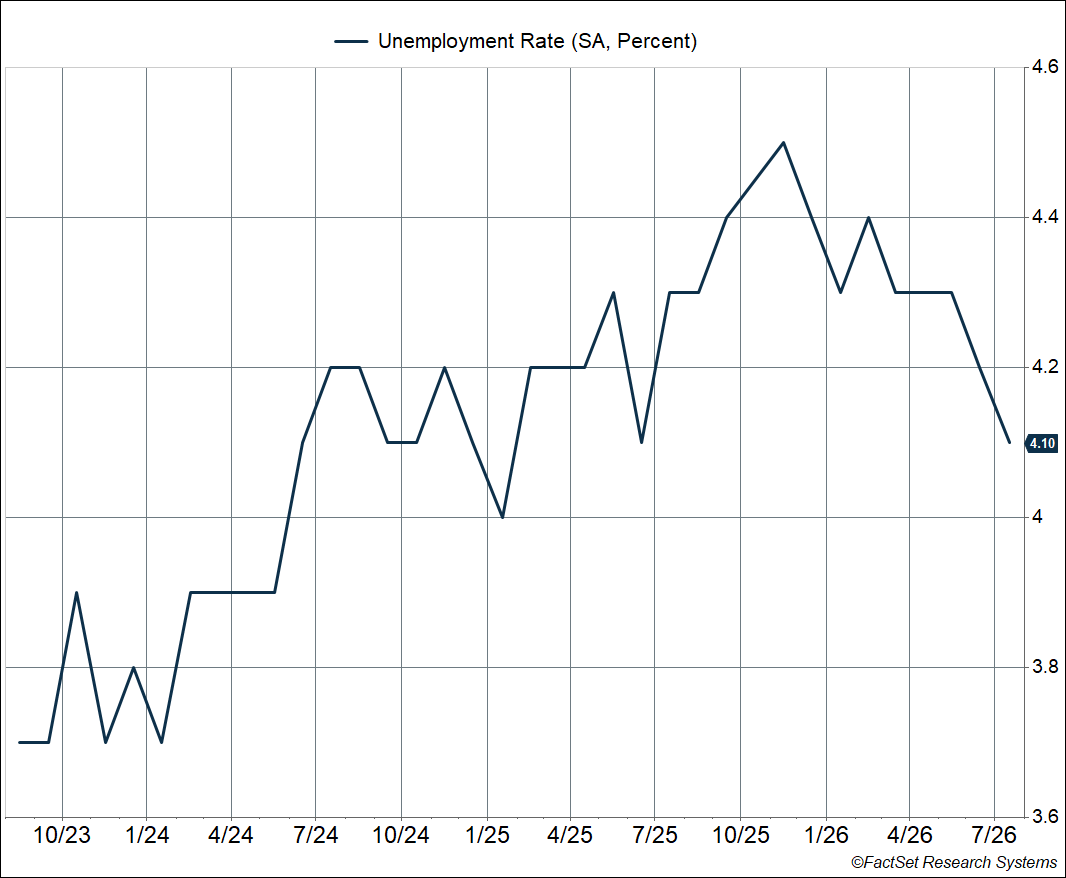
Which brings me to the best news in the report. The unemployment rate eased to 4.1% in July, the lowest level in a year. The rise we saw in 2025, when the unemployment rate climbed as high as 4.5% late last year, has now been fully unwound. Keep some perspective here: 4.1% is a historically low unemployment rate. It only looks elevated relative to mid-2023, when it plunged to 3.5%. What’s remarkable is that the unemployment rate rose, stabilized, and then reversed. Historically, once the unemployment rate starts climbing, it tends to keep climbing until we’re in a recession. That has not happened this cycle.
The prime-age employment-population ratio backs this up. The share of 25- 54-year-olds with a job rose to 80.4% in July. I like this measure because it cuts through a lot of the noise in the unemployment rate itself. A very high proportion of Americans in their prime working years are employed right now, and that’s not what a deteriorating labor market looks like.
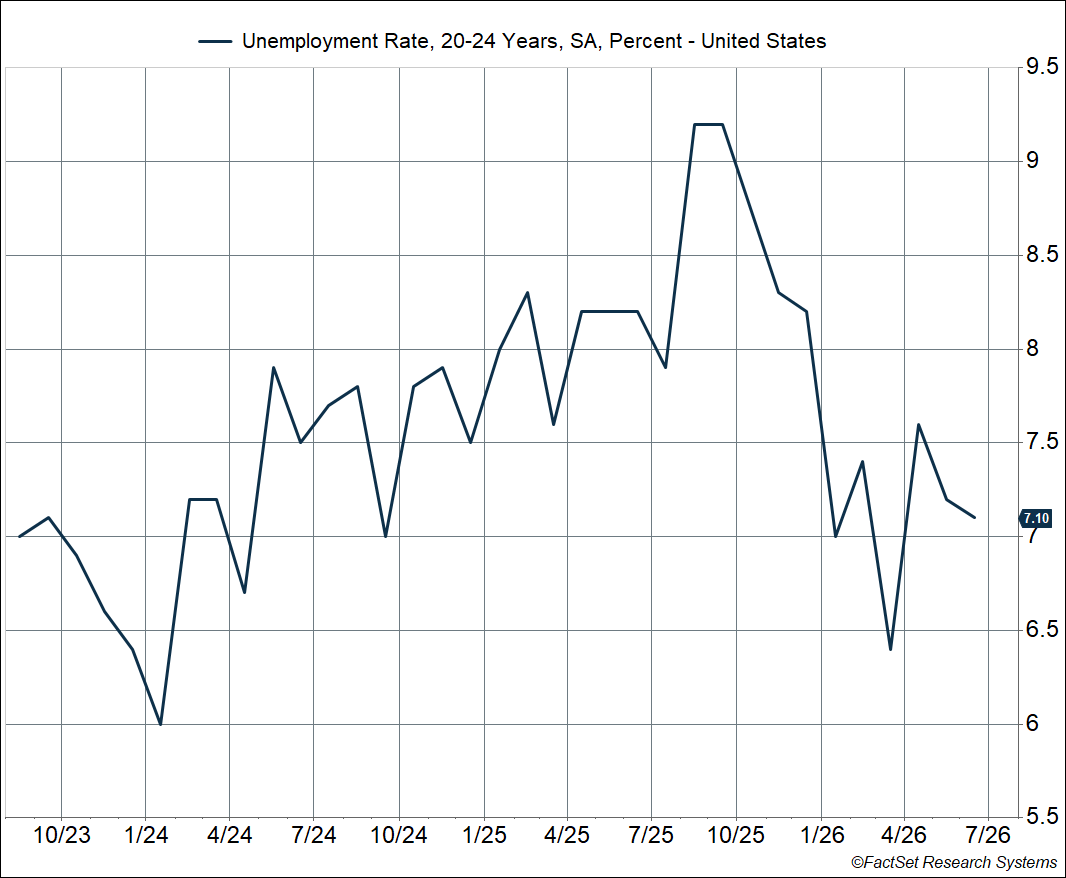
It’s also worth addressing the AI question, since “AI is taking entry-level jobs” has become a popular narrative. The data doesn’t support it, at least not yet. The unemployment rate for 20- 24-year-olds eased to 7.1% in July, well below the 9.2% peak we saw last fall and back in line with what we saw in 2023, when the labor market was running hot. The unemployment rate for teenagers (16- 19-year-olds) has been falling as well. If AI were displacing young workers at the entry level, you’d expect exactly the opposite: unemployment rates for the youngest workers rising even as everyone else held steady. Instead, young workers’ job prospects have been improving for most of this year.
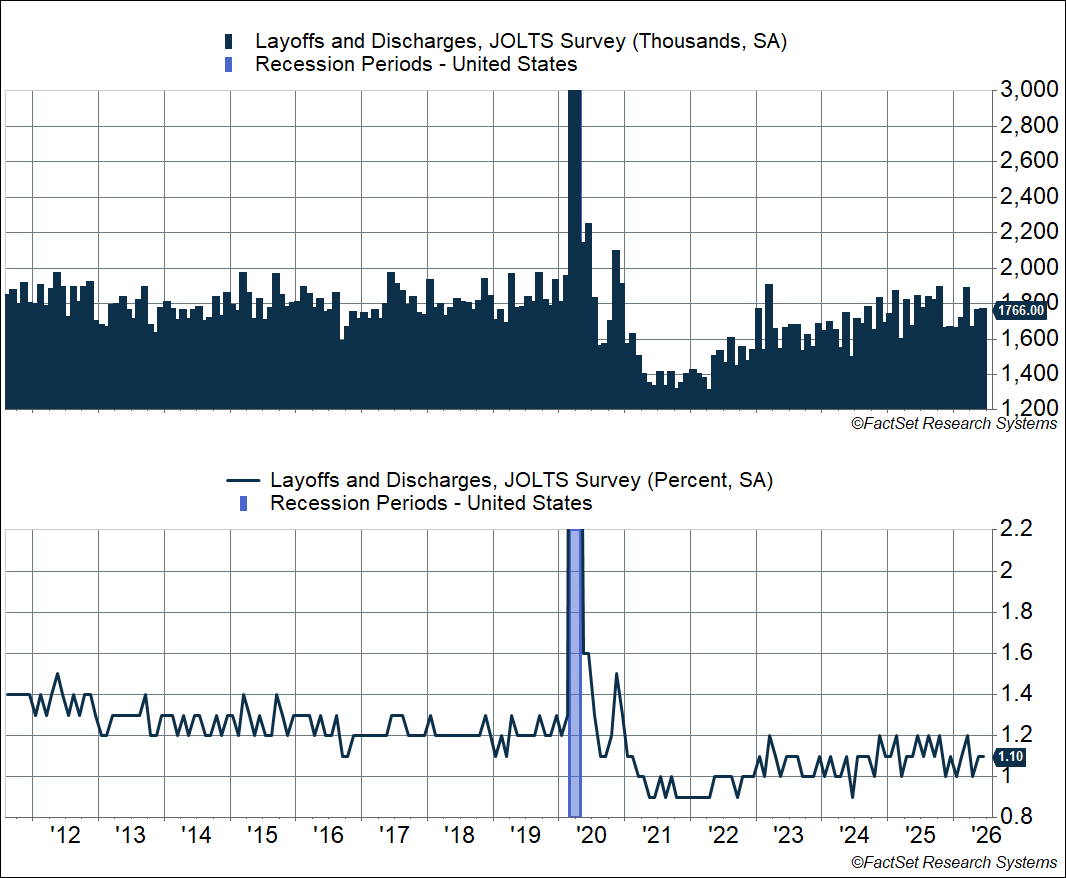
Finally, layoffs. The latest JOLTS data shows layoffs and discharges running at about 1.77 million, with the layoff rate at 1.1%. That’s below the 1.2-1.4% range that prevailed across the entire pre-pandemic decade. Initial claims for unemployment benefits tell the same story and remain very low by historical standards. Companies may not be hiring aggressively, but they’re not cutting either. This has been the defining feature of the labor market for a while now: low hiring, low firing.
Add it all up, and the July payroll report is less alarming than the headline suggests. The miss was driven largely by seasonal quirks in education payrolls and payback from the World Cup hiring boost, while the underlying trend of job growth is slow but stable, held down as much by labor supply as by demand. Meanwhile, the unemployment rate is the lowest in a year and near historic lows, prime-age employment is elevated, and layoffs remain unusually rare. Payrolls may be shaky, but the labor market is fine. That’s good news for households, and ultimately, good news for the economy.
Thanks to Harry McDonald, Analyst, Investment Research, for his help with this blog.
For more content by Sonu Varghese, Chief Macro Strategist, click here.
9065387.1. – 7AUG26A