Our theme heading into 2026 was riding the wave, and halfway through the year, that wave is still rolling. The S&P 500 returned 10.2% in the first half, and what matters most is that those gains came from fundamentals. Record earnings, expanding margins, and a still-accelerating AI investment boom did the heavy lifting.
The ride has not been smooth. Growth has slowed, inflation has climbed, the war with Iran added an energy shock, and bonds struggled. But the setup still favors stocks, and we have raised our full-year S&P 500 target to a total return of 15-18%. Here is our midyear story, told mostly through the charts.
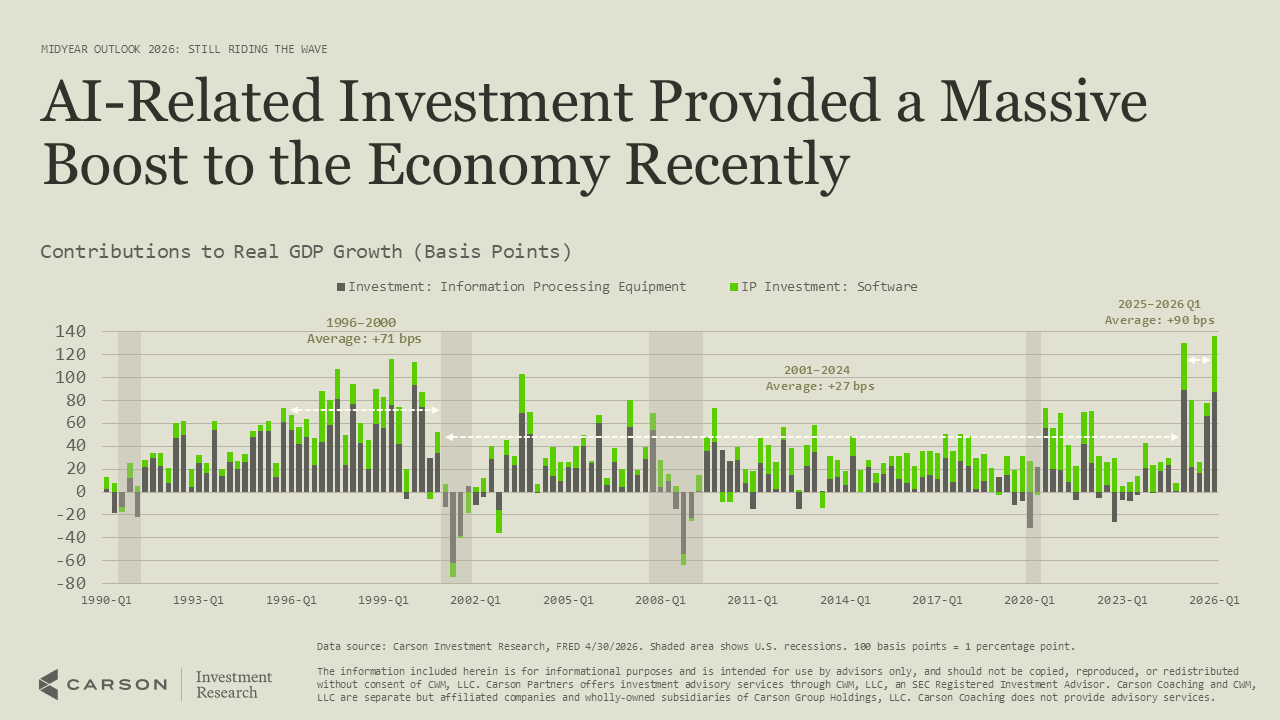
AI is showing up directly in the growth data. Over the last five quarters, real investment in IT equipment and software added about 0.9 percentage points per quarter to GDP growth, which is close to half of all growth coming from a part of the economy that accounts for under 5% of GDP.
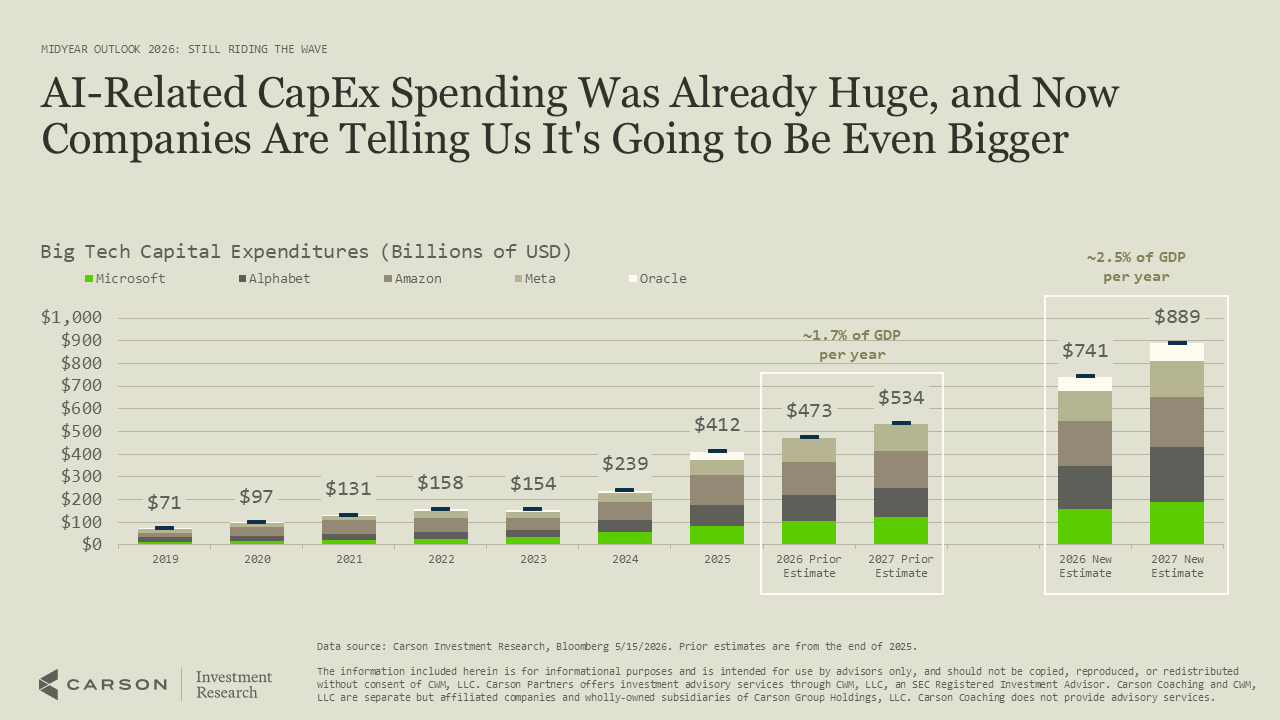
And the spending behind that growth is set to get bigger. Big tech’s 2026 capital expenditure estimate has climbed to around $740 billion, roughly 2.3% of GDP and more than four times the level of 2023.
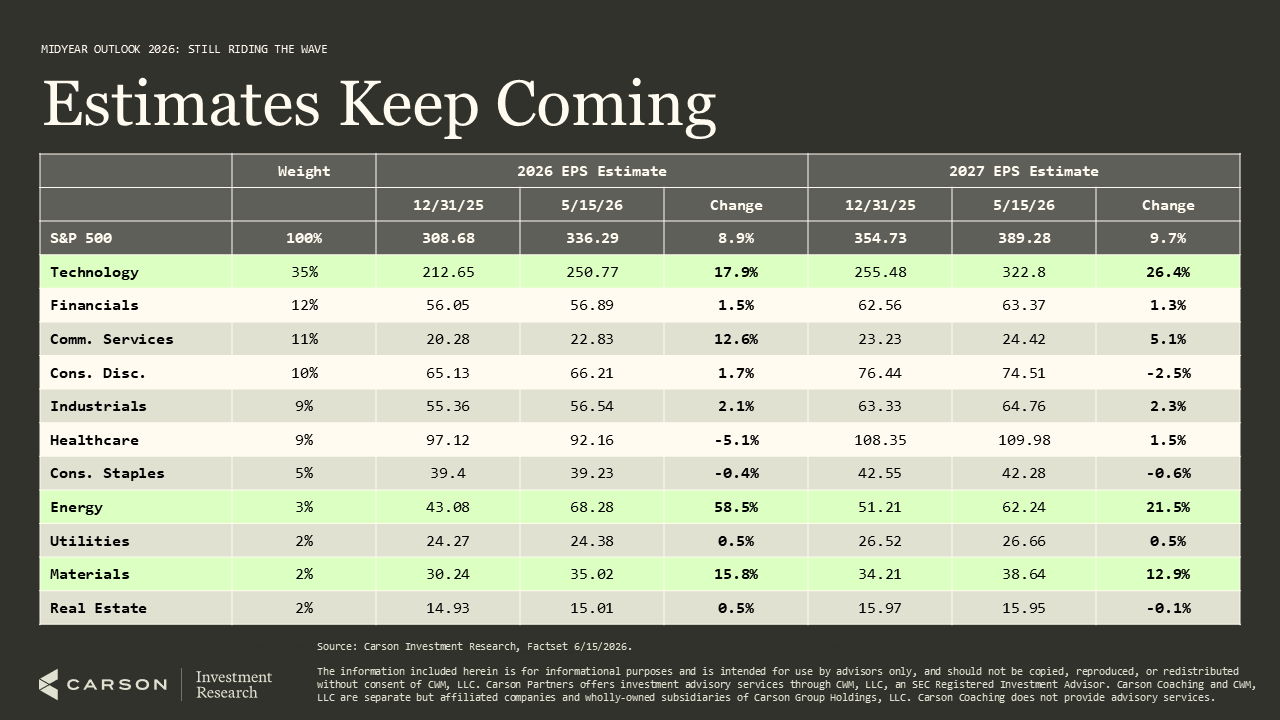
One company’s capital spending is another company’s revenue, and that link is flowing straight into profit estimates. Technology, energy, and materials have driven most of this year’s upward revisions, with tech’s 2026 estimate up nearly 18%.
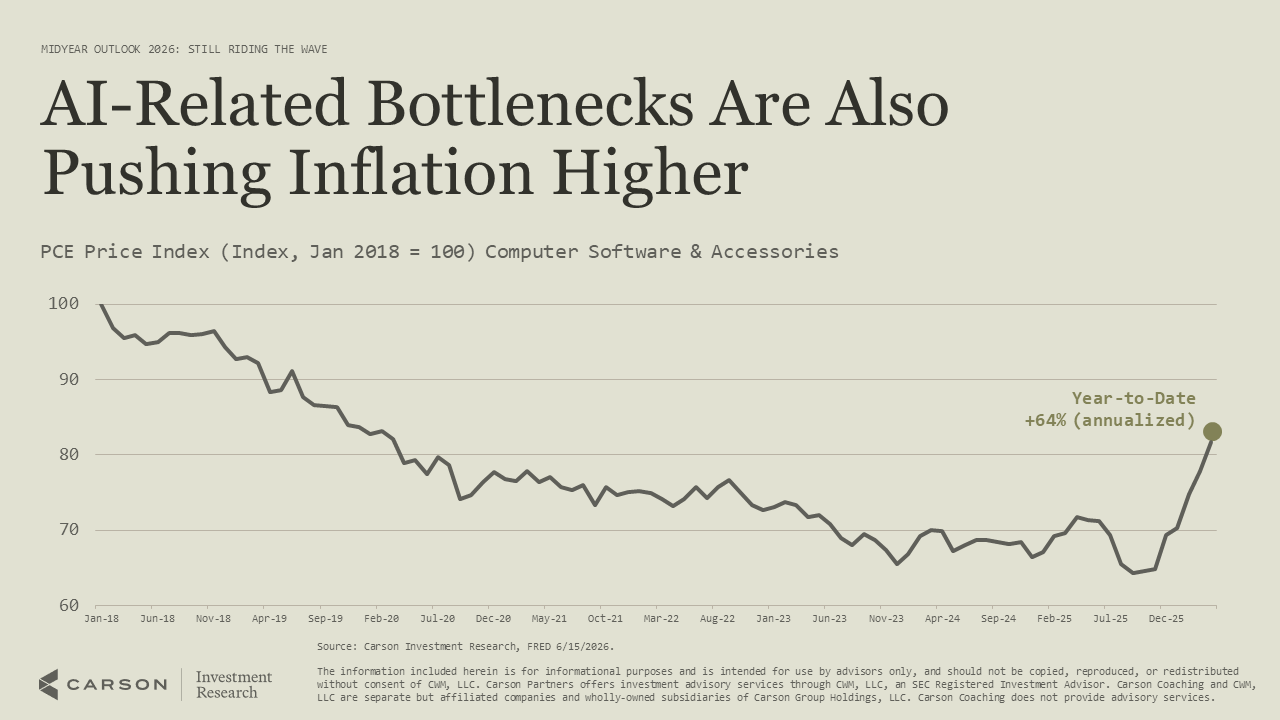
The same forces lifting those profits are also pushing prices higher. Computer software and accessory prices, which fell for two decades, have risen at a 64% annualized pace this year as demand outruns supply.
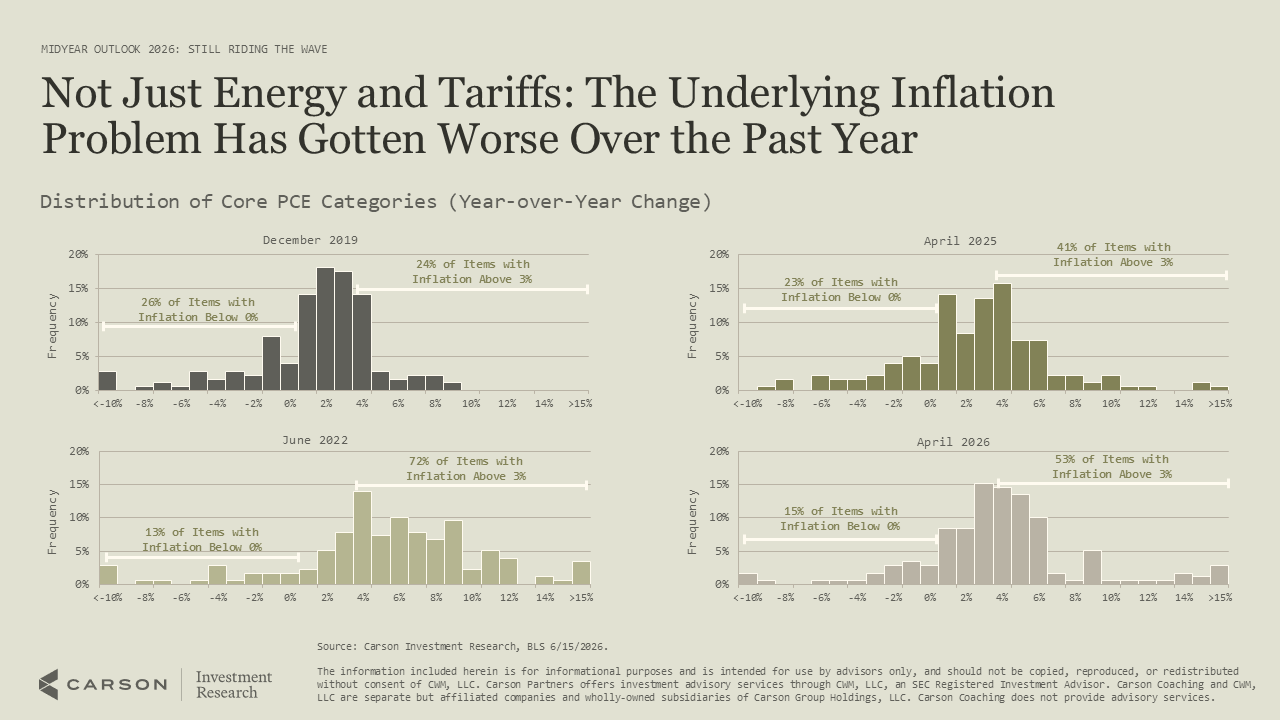
This is not just about energy or tariffs, and it is not limited to a few items. Across the core PCE basket, 53% of categories now show inflation above 3%, up from 24% at the end of 2019.
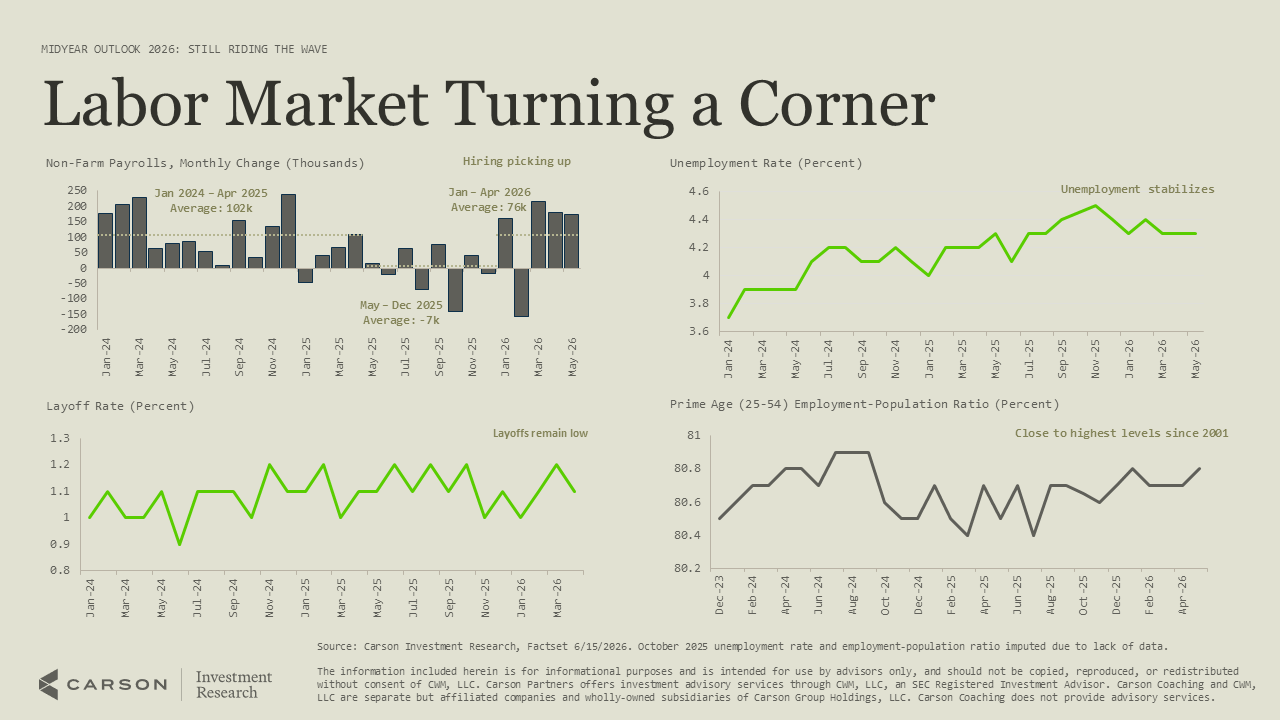
With inflation running hot, the labor market is the key thing to watch, and here the news has improved. After ten months of stalling, job growth has strung together back-to-back gains, unemployment is steady at a low 4.3%, and layoffs remain near historic lows.\
That steadier job backdrop is helping spending hold up. Nominal consumption is running near 8% annualized, well ahead of recent trends, though real spending is lagging as inflation takes its cut.

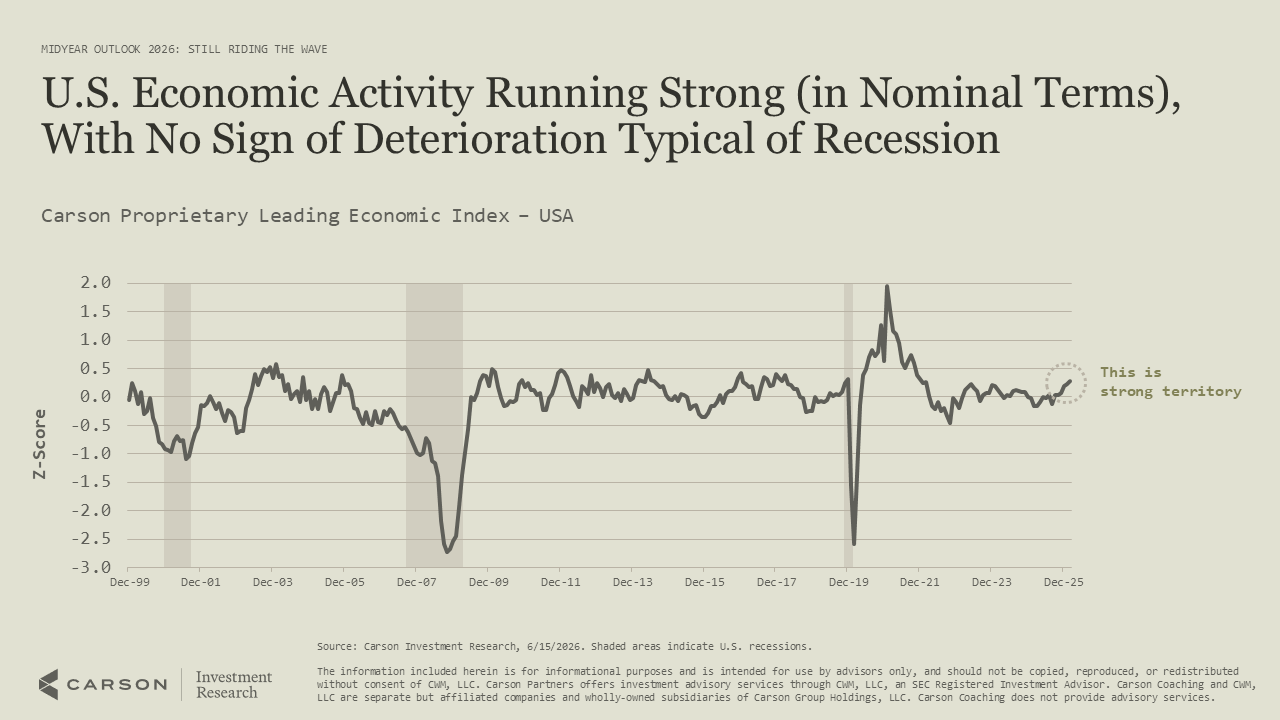
Strong nominal activity is exactly what our broader economic read is picking up. Our proprietary Leading Economic Index has moved from slightly below trend to above it, now in strong territory with none of the deterioration that usually precedes a recession.
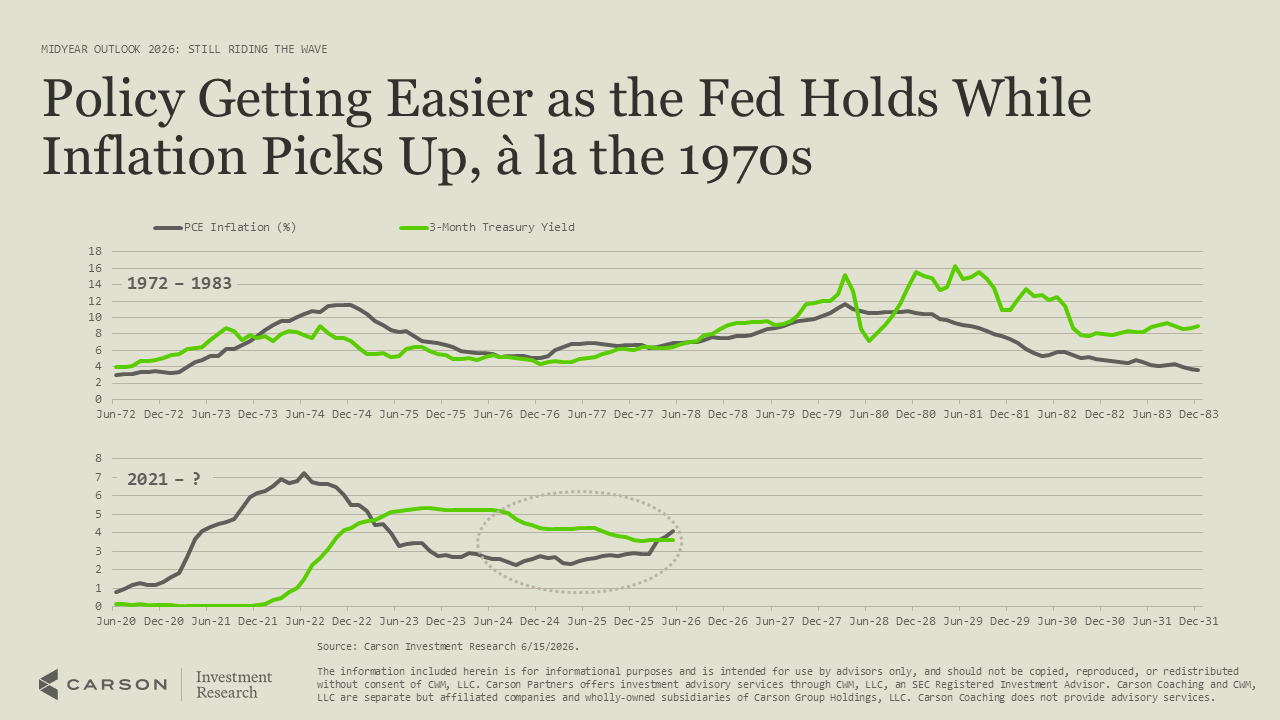
A hot economy also shapes how the Fed responds, and right now it is choosing to look through inflation. With rates on hold while inflation rises, policy is effectively getting easier, much like the setup in the 1970s before Volcker stepped in.
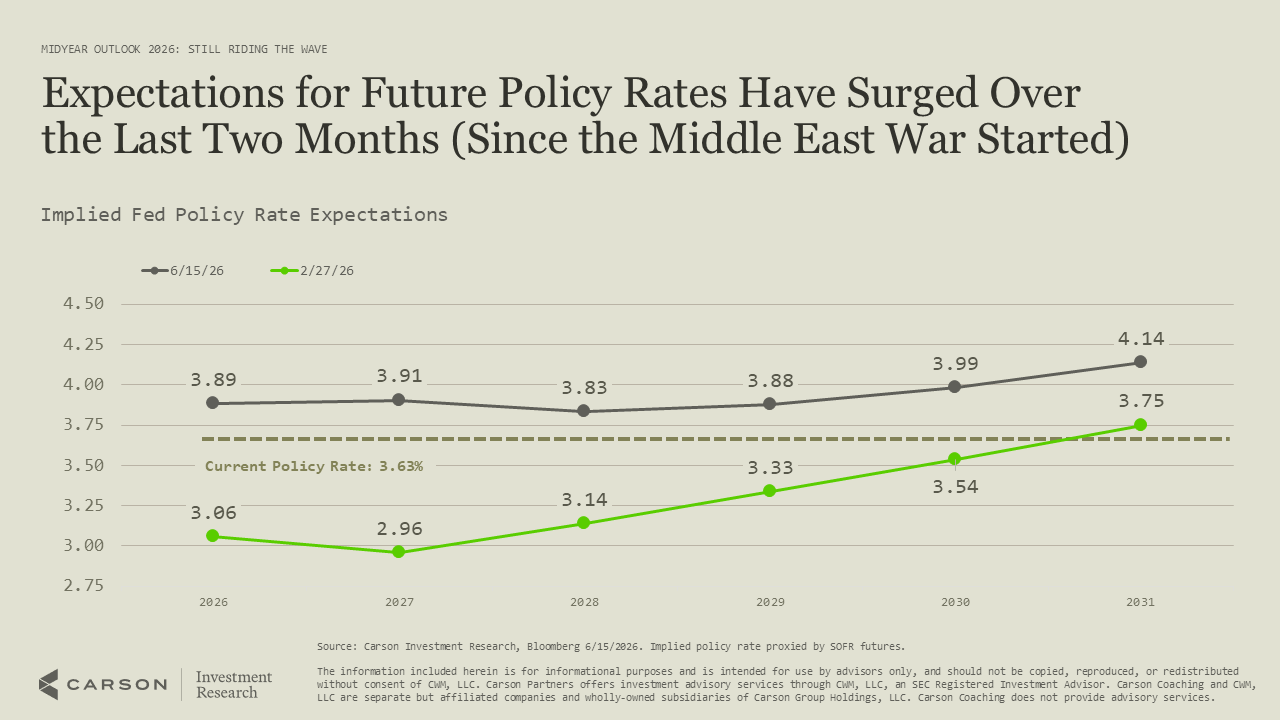
Markets have repriced that path in a hurry. Since the war in the Middle East began, the entire expected rate curve has shifted above the current 3.63% policy rate, implying hikes rather than cuts from here.
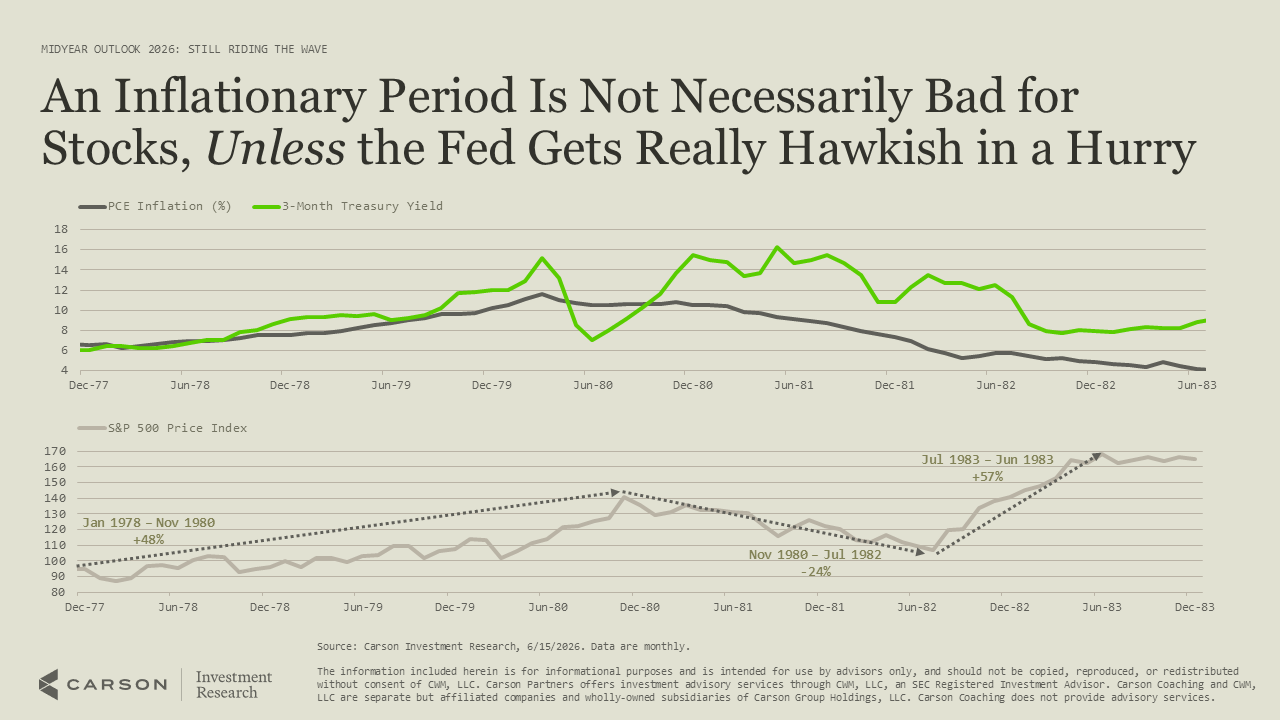
History says an inflationary stretch is not automatically bad for stocks, with one big caveat. The S&P 500 rallied 48% from 1978 into late 1980 even as the Fed raised rates, and only broke when Volcker pushed rates well above inflation.

Stay on Top of Market Trends
The Carson Investment Research newsletter offers up-to-date market news, analysis and insights. Subscribe today!
"*" indicates required fields
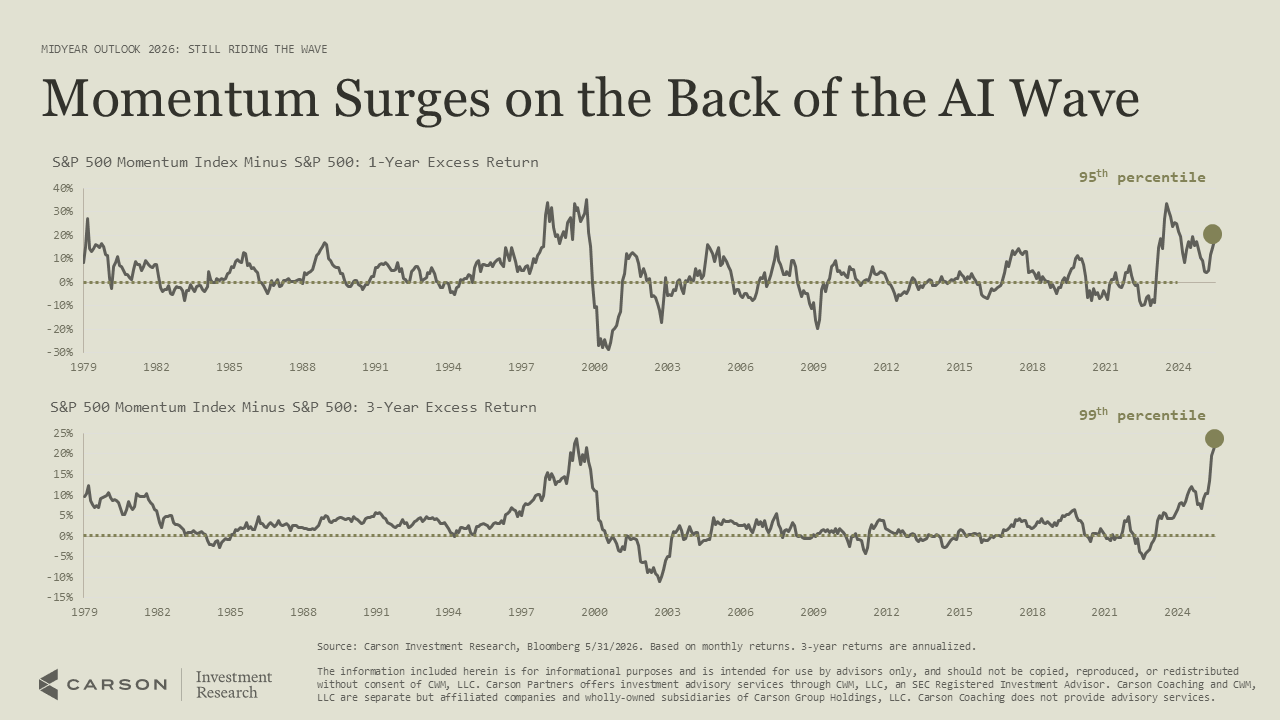
One of the cleanest ways to ride this wave has been momentum, though it is looking stretched. The S&P 500 Momentum Index sits near the 90th percentile for one-year excess returns and the 99th percentile for three-year excess returns, which is why we like it but won’t go all in.
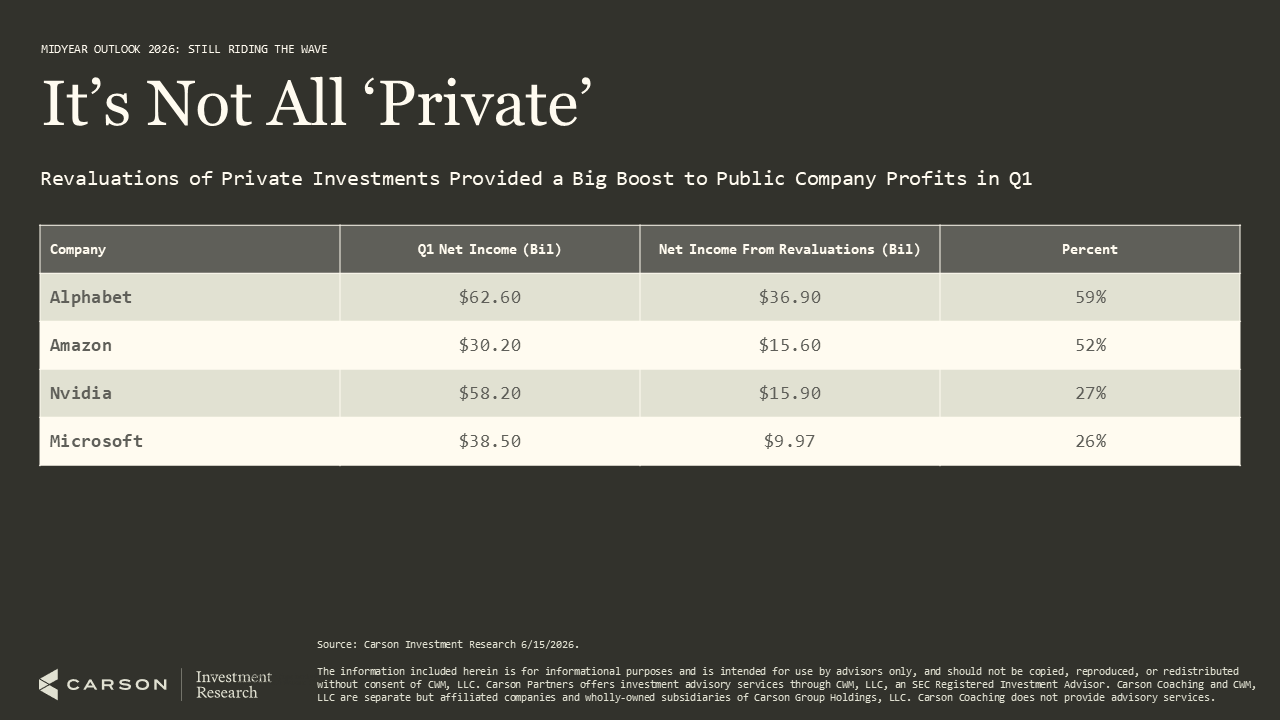
It is worth understanding where some of this earnings strength is coming from. A large share of Q1 profits for the mega-cap names came from revaluations of private AI holdings like OpenAI and Anthropic, more than half of GAAP earnings for both Alphabet and Amazon.
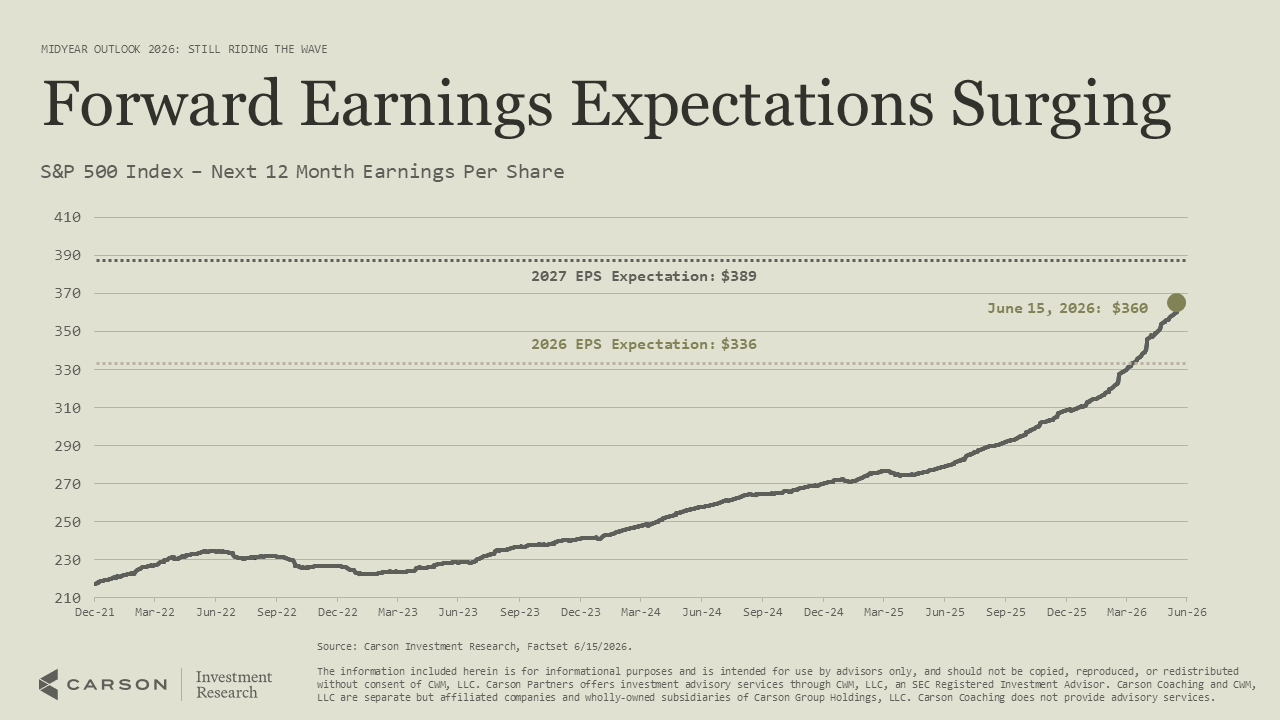
Set those revaluations aside, and the broader earnings trend still points firmly higher. Forward 12-month estimates have surged on upward revisions to 2026 and 2027, driven by fundamentals rather than sentiment.
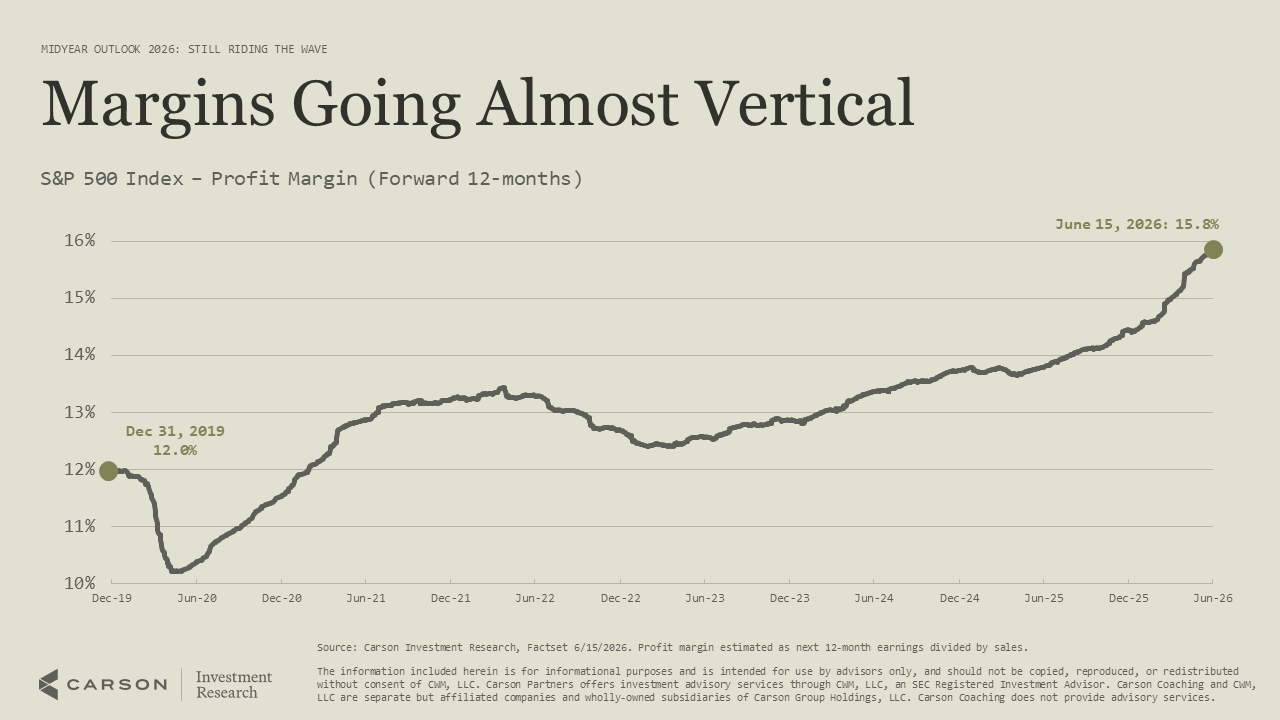
Margins have been the bigger surprise this year. Forward profit margins have gone nearly vertical to almost 16%, up from 12% at the end of 2019 and a fresh all-time high.
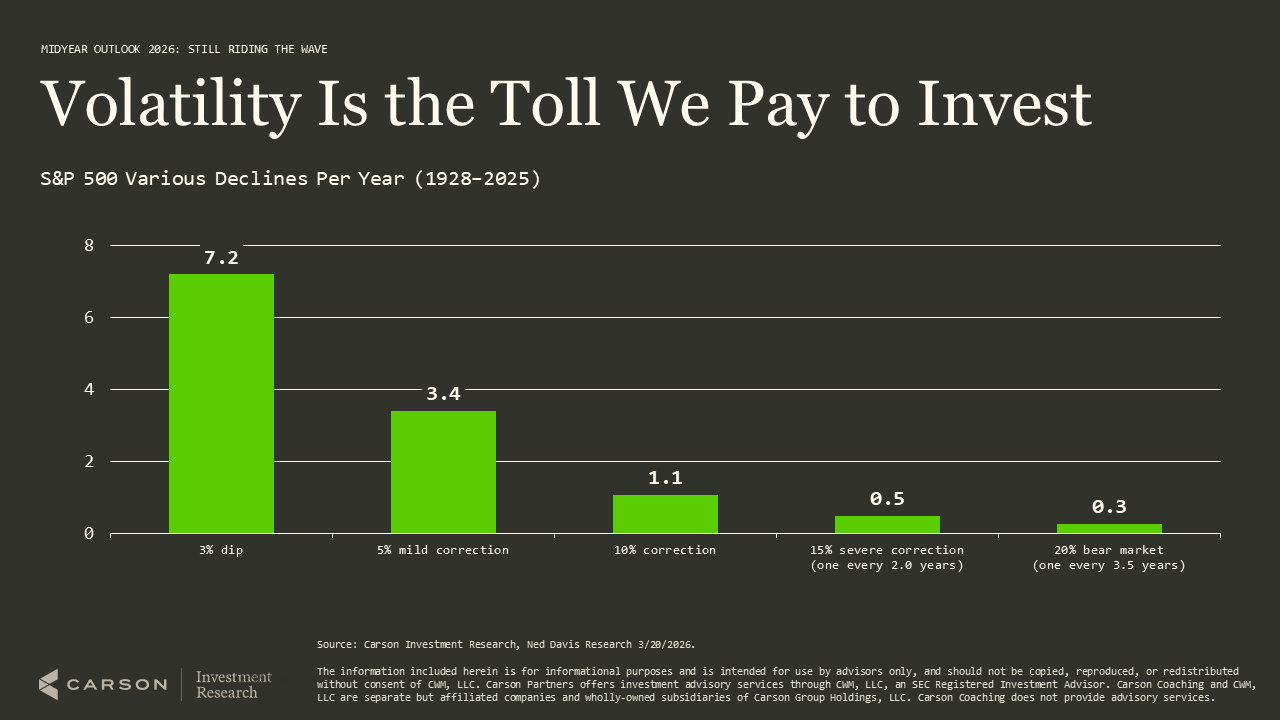
None of this means the ride is smooth, and it helps to expect some chop. In a typical year, the S&P 500 sees a double-digit correction plus several smaller pullbacks, and 2026 has already delivered a near-double-digit drop into late March.
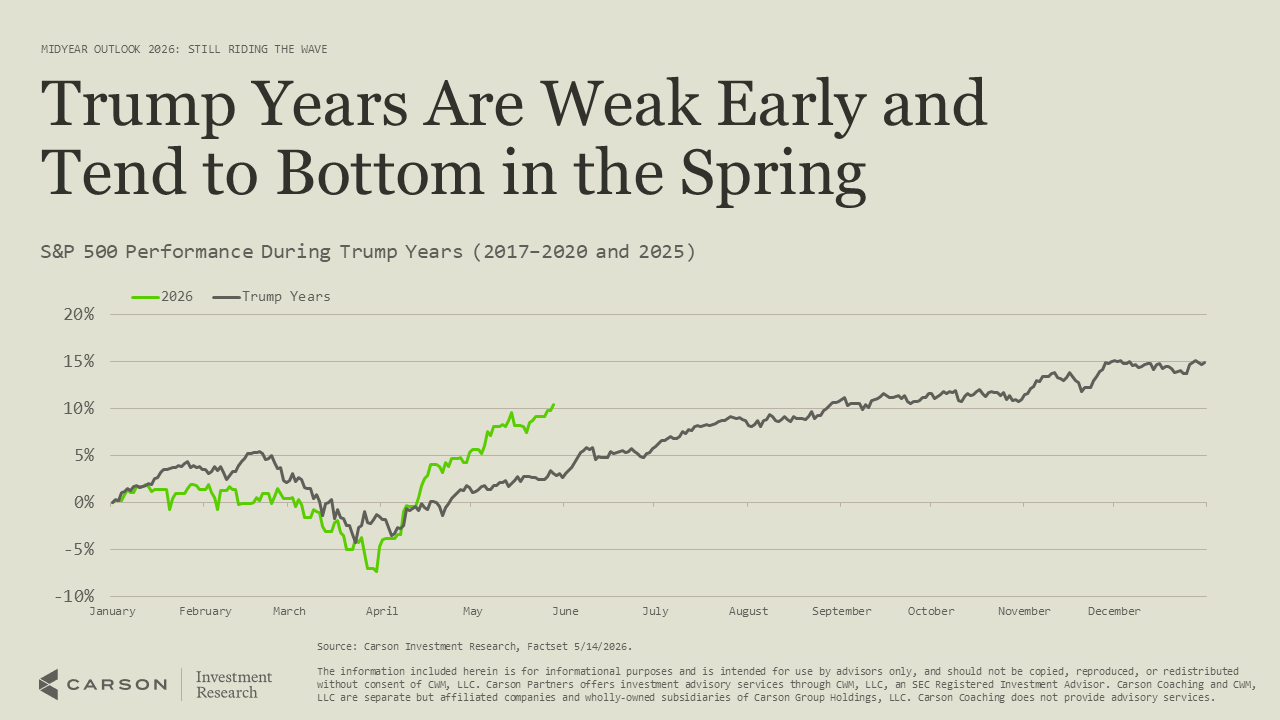
The timing of that dip fits a familiar pattern. Years under President Trump have tended to start weak, bottom around March or April, and rally into year-end, and 2026 has followed that script so far.
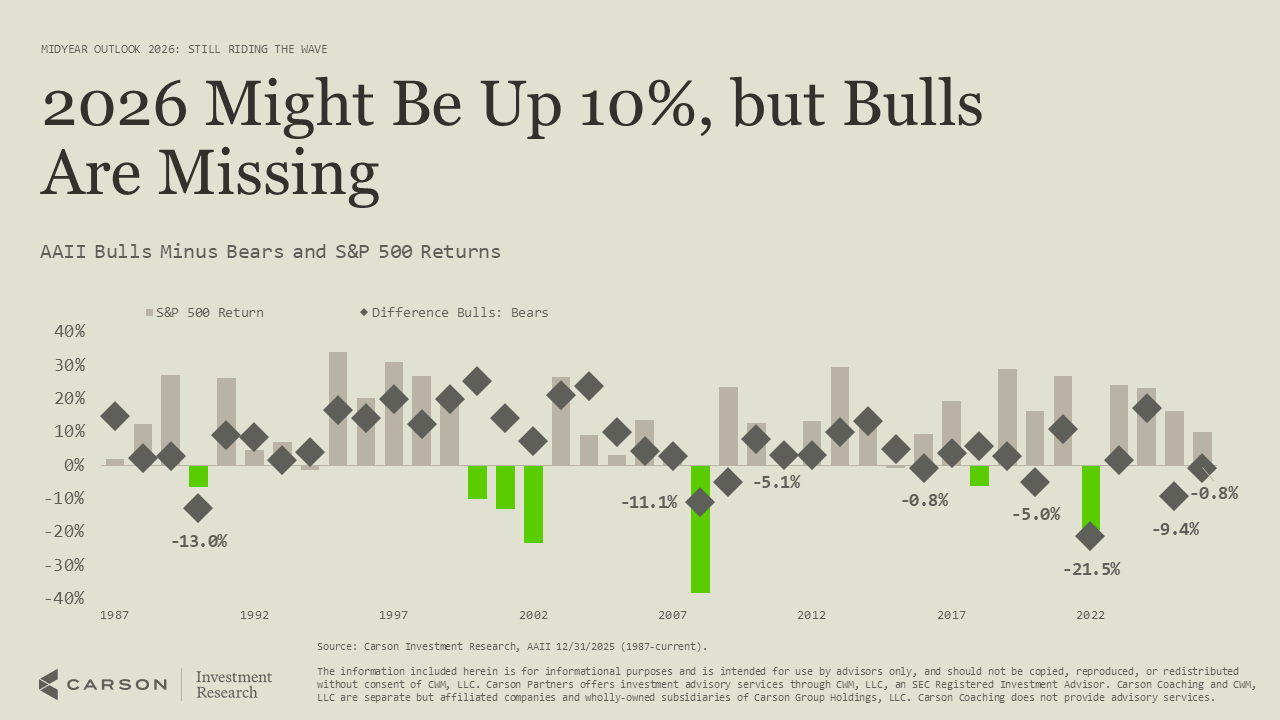
What stands out is how few investors are enjoying the gains. Even with stocks up close to double digits, the AAII survey has shown more bears than bulls this year, and sentiment is nowhere near optimistic.
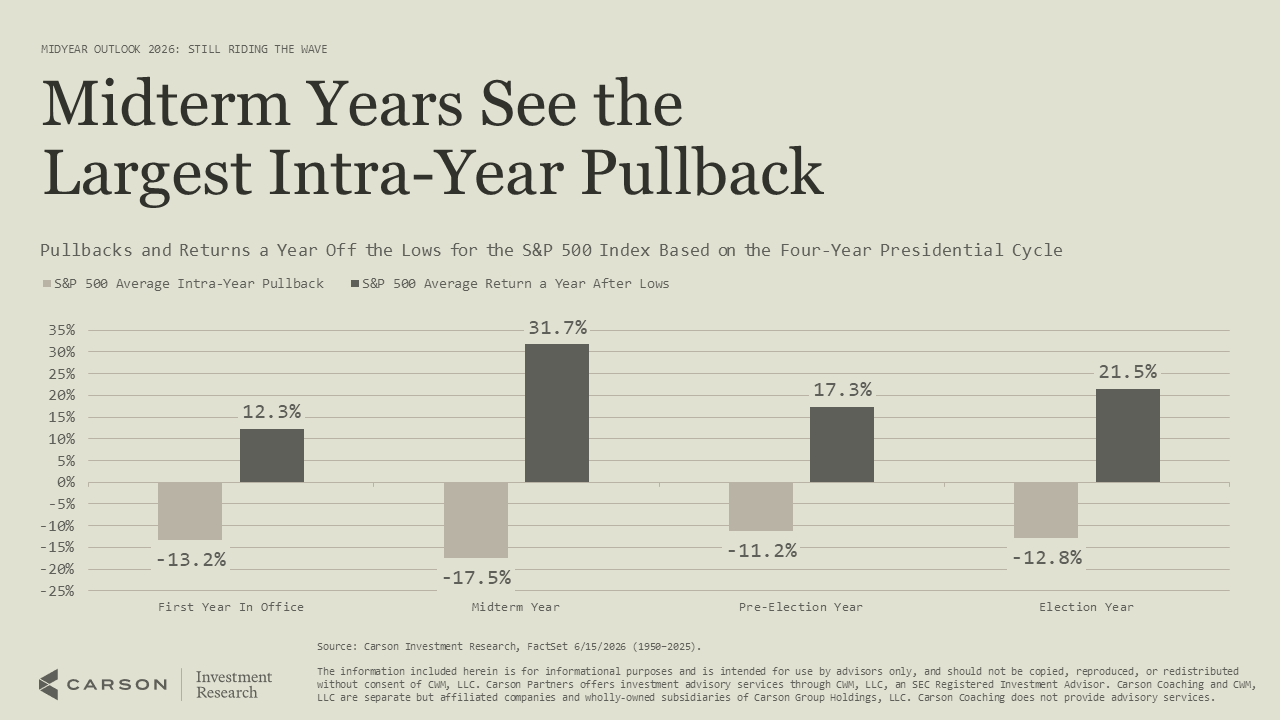
That lingering wall of worry suggests room to run, but a midterm year still calls for caution. Midterm years see the largest average intra-year pullback of the four-year cycle at 17.5%, though the year off those lows has averaged nearly 32%.
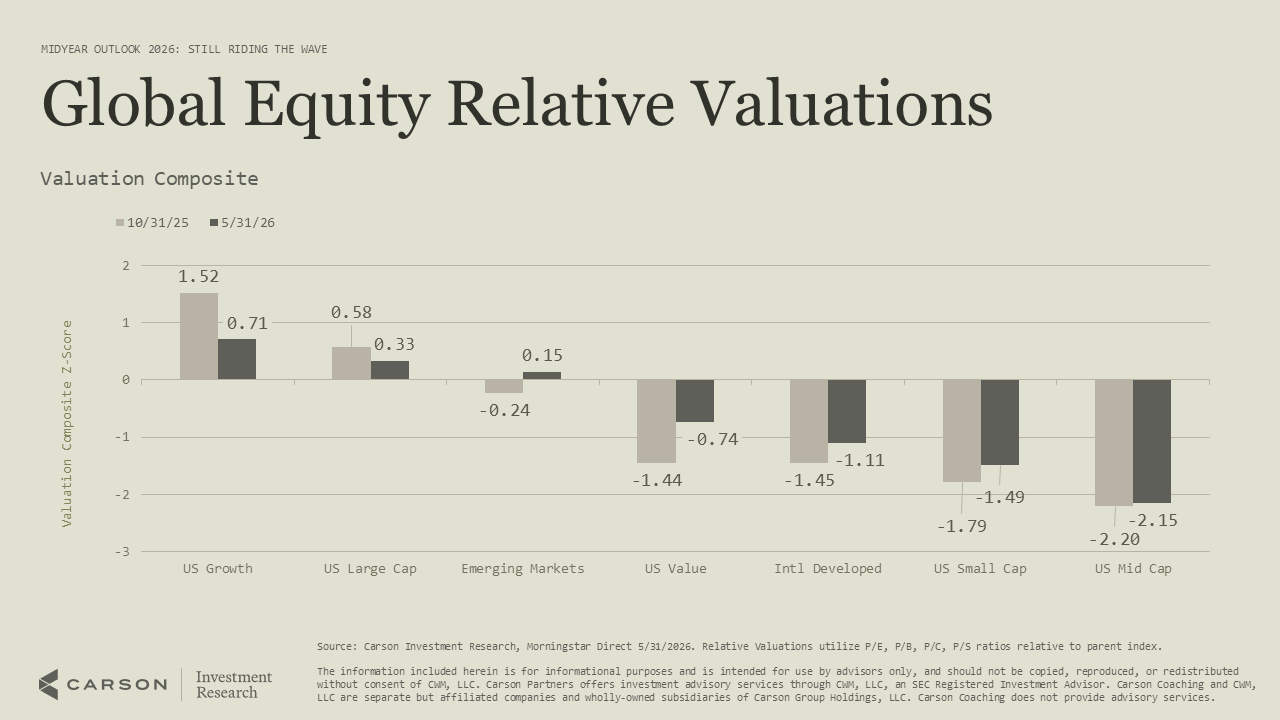
Strip out the noise, and the bubble question comes down to valuations. Large-cap US growth has cheapened since last fall, while value, international, and smaller-cap stocks screen as the cheapest, leaving the picture less lopsided than it was.
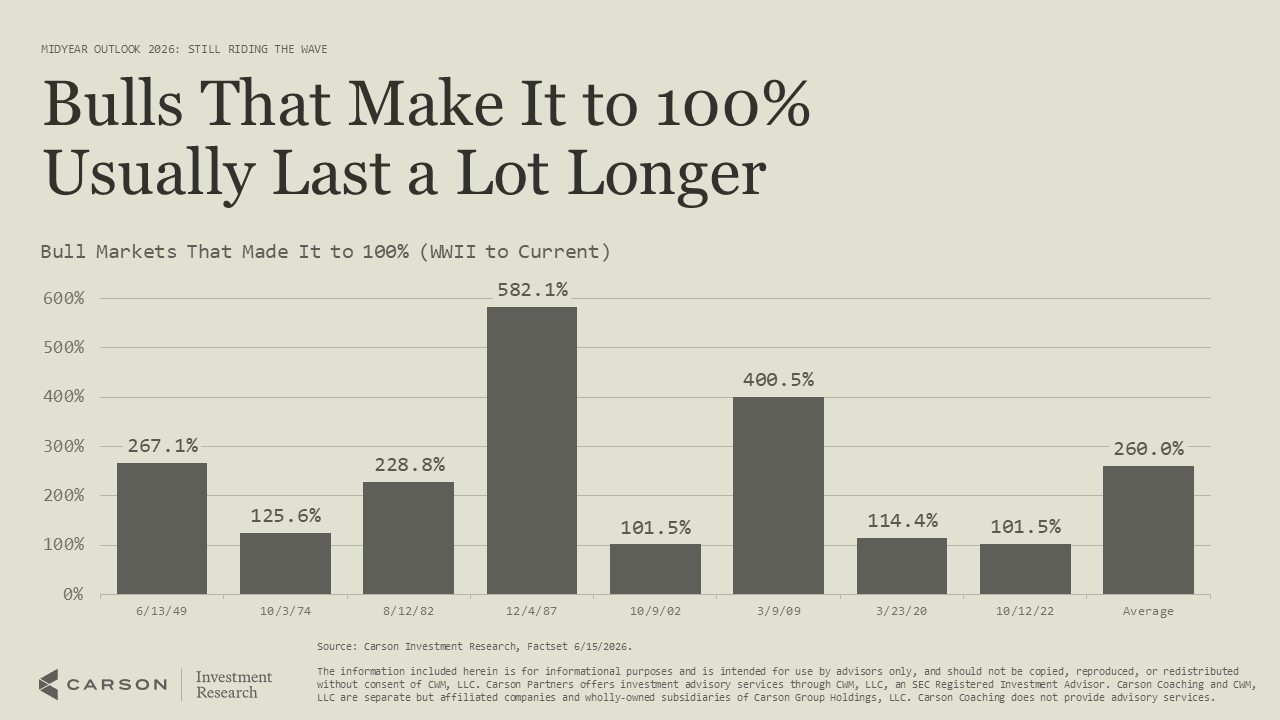
History also favors a young bull like this one. When a bull market doubles, as this one did in May, it has gone on to last another 3 years and gain an average of 260% before ending.
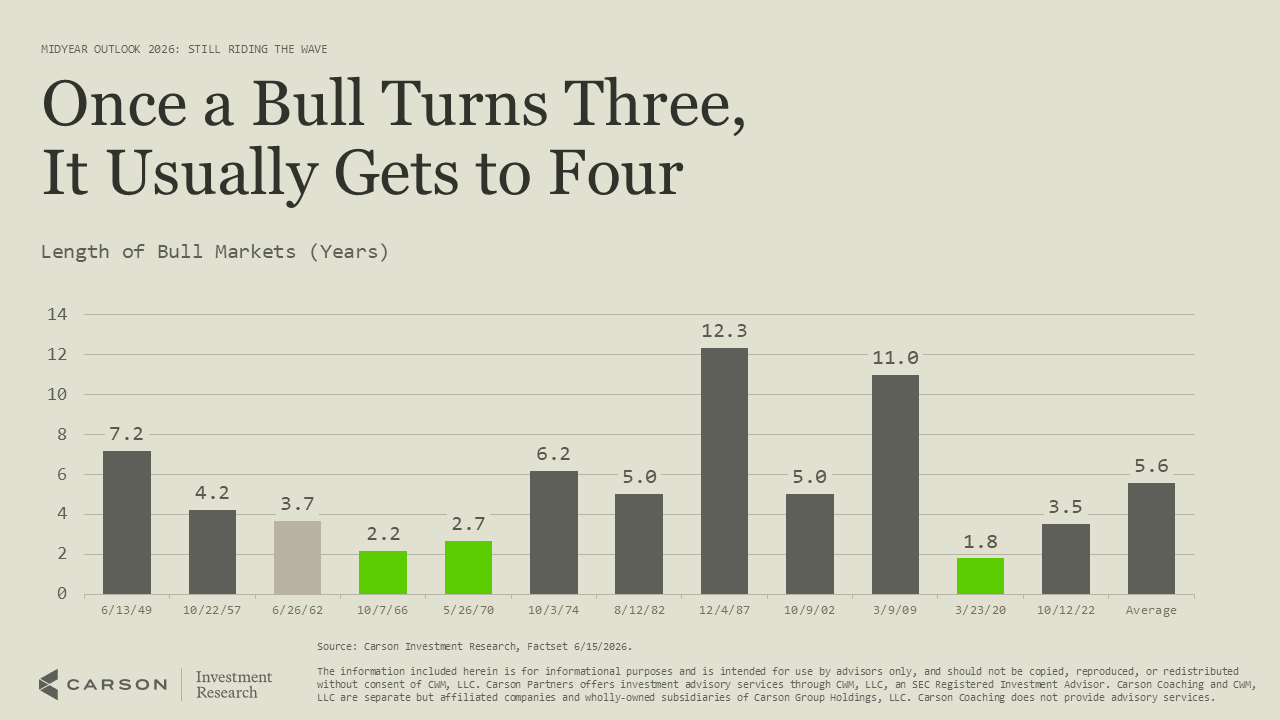
The length pattern points the same way. Once a bull passes its third birthday, seven of the past eight reached a fourth, and the five that made it this far over the past 50 years lasted an average of eight years.
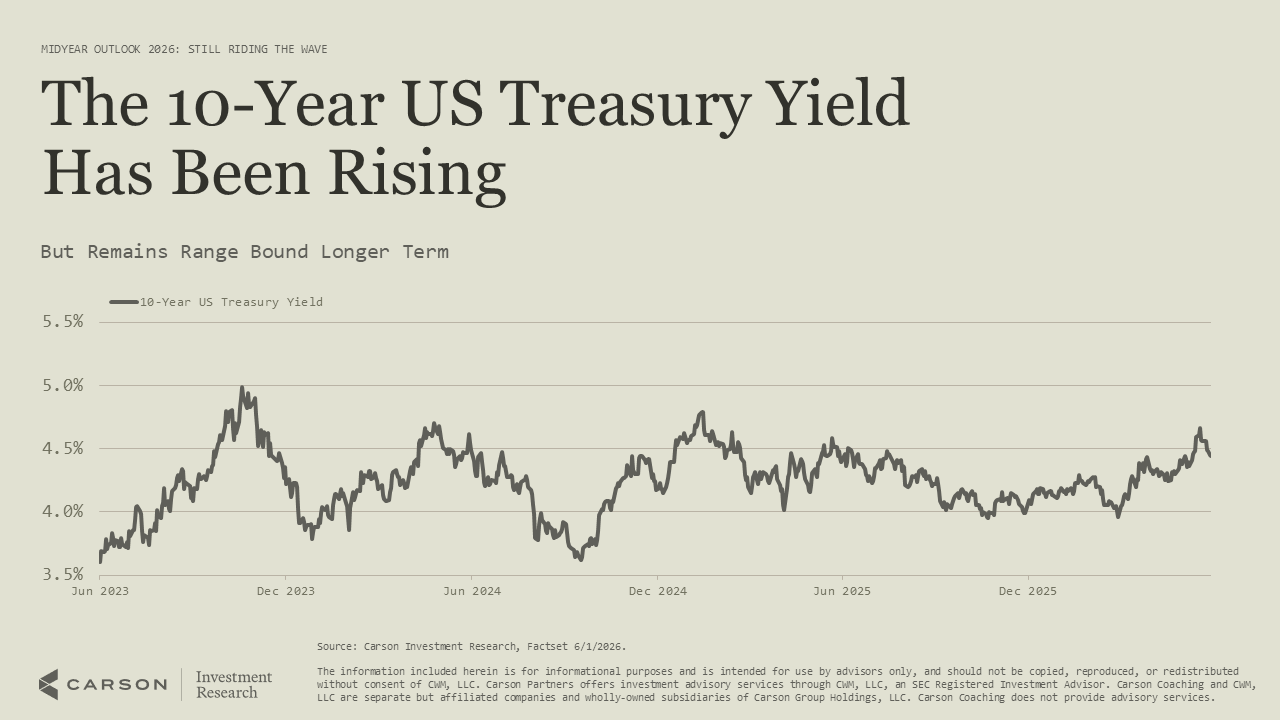
Bonds were a tougher story in the first half. The 10-year Treasury yield has ground higher on rising inflation and shifting Fed expectations, though it remains within its longer-term range, and we’ve nudged our year-end target to 4.5%.
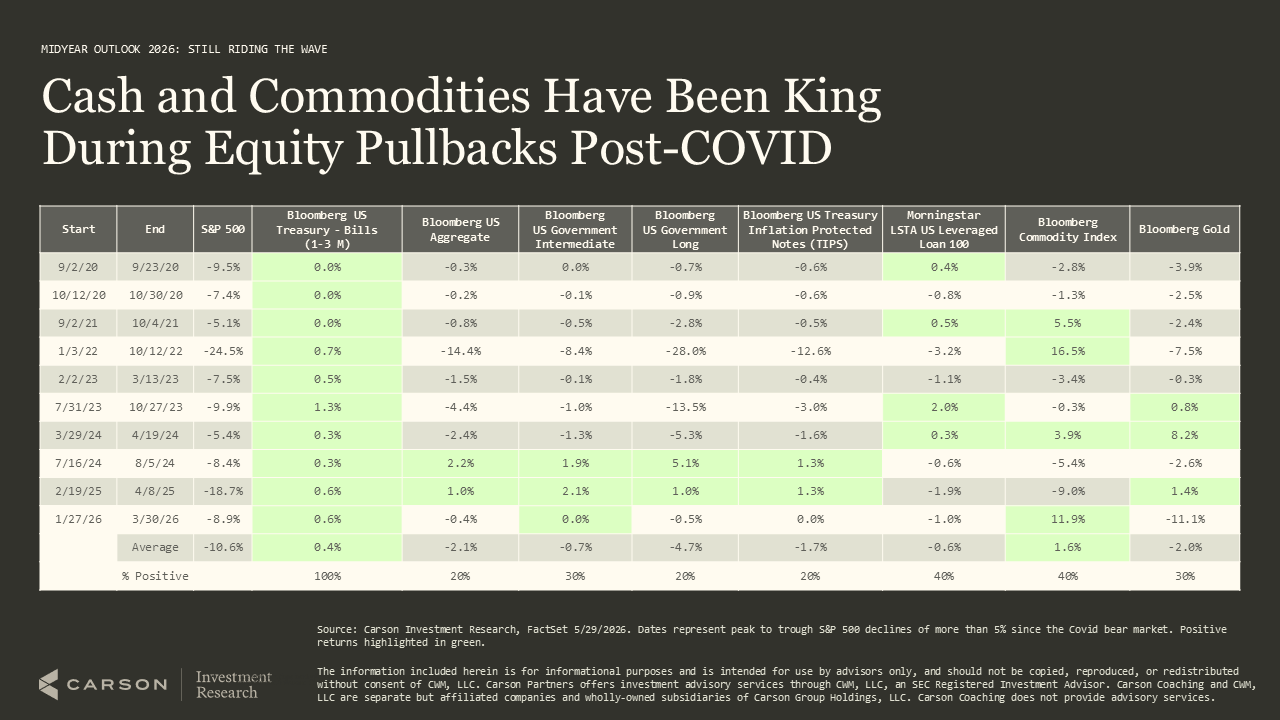
During recent equity selloffs, bonds have not been the reliable shock absorber they once were. Across post-COVID pullbacks, cash and commodities have often held up better than core bonds, which is why we keep diversifying our diversifiers with gold, managed futures, and TIPS.
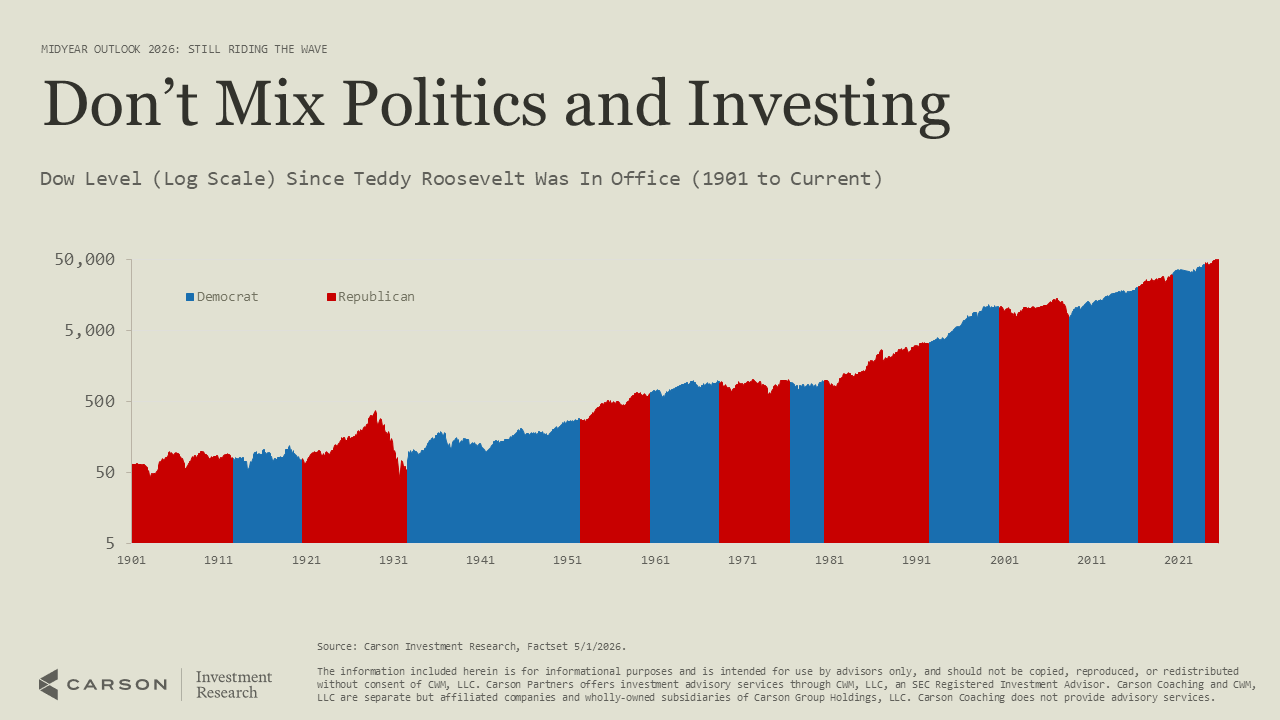
With midterms approaching, a quick word on politics and portfolios. The Dow has climbed across more than a century of both Republican and Democratic administrations, a reminder not to let the party in power dictate your market view.
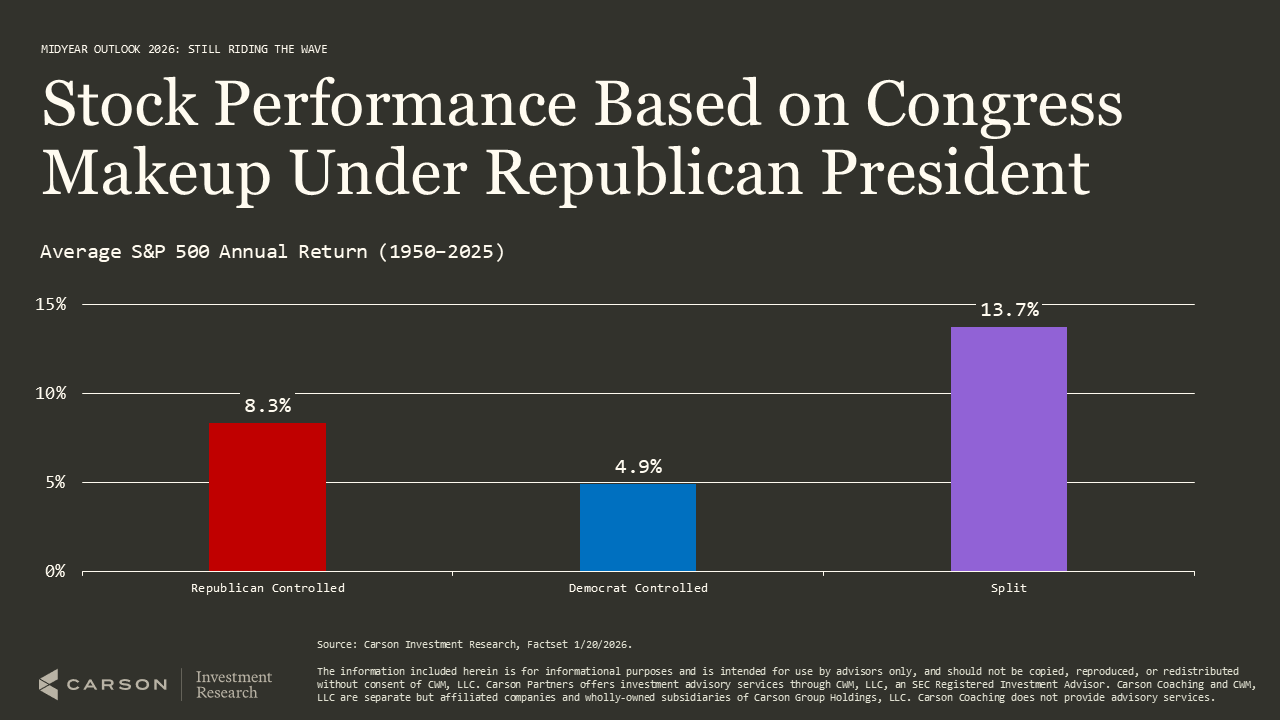
What has mattered more for returns is the makeup of Congress. Under a Republican president, stocks have historically done best with a split Congress, averaging 13.7% a year.
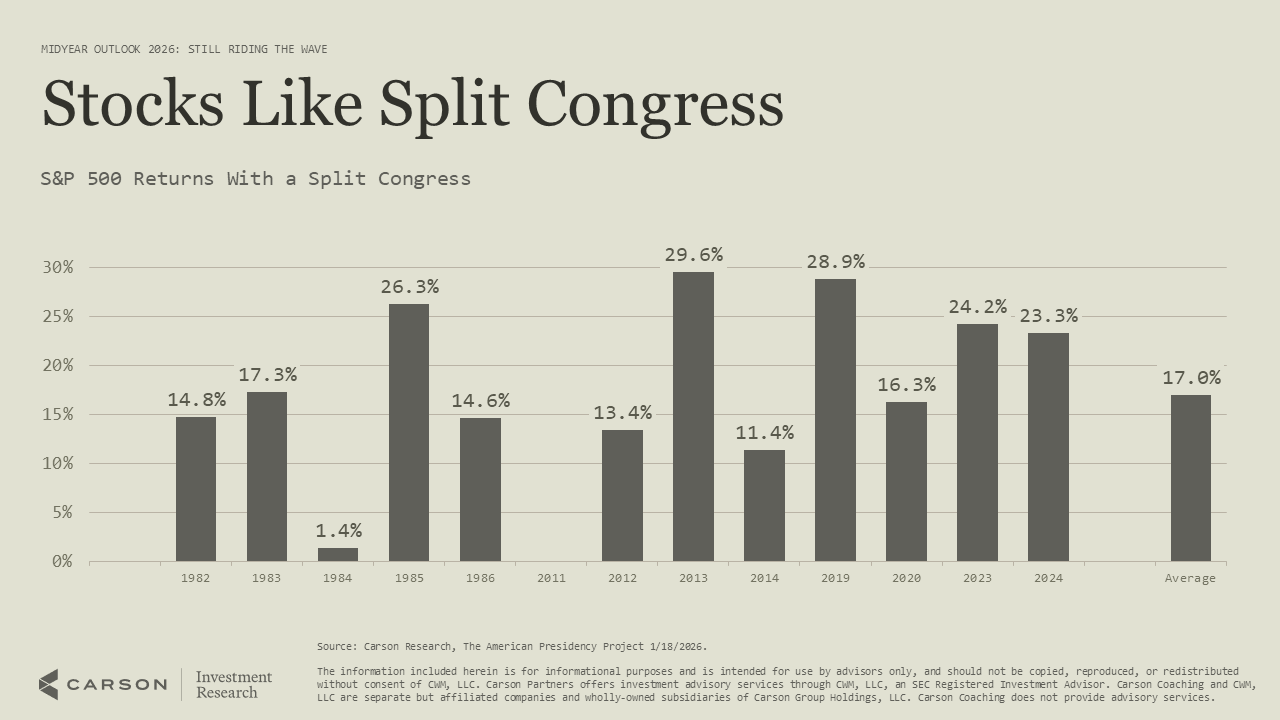
That gridlock pattern holds up on its own, too. Over the past 13 years with a split Congress, the S&P 500 gained every time and averaged a 17.0% return, which may well be the setup for 2027 and 2028.
Where This Leaves Us
As we look to the second half, the economy is still growing, companies are still making money, and we are still in the middle of AI’s generational infrastructure buildout. The water may be rougher now, with the Fed on hold, inflation harder to tame, and geopolitical risk in play, so this stretch calls for a little more care rather than a reason to get out.
Our advice is the same as it has been all year: stay invested, stay diversified, and keep your balance. There will be moments where bailing feels tempting, but patiently navigating volatility is one of the most important skills a long-term investor can have. We expect to close the year still riding the wave.
Click below to watch the latest Facts vs Feeling Podcast!
By the Carson Investment Research Team
9025116.1. – 15JULY26A