
Normally by the end of the quarter we get the second estimate for the prior quarter’s GDP growth (which is slightly more reliable than the first estimate). In the case of this Q3 GDP report, we missed the first estimate because of the shutdown and so the second estimate was the first full picture we got of what the economy looked like in Q3. Yes, it is lagged data at this point, but the details are certainly interesting and it points to solid momentum for Q4 and even 2026. The big picture is that the economy ran strong in Q3 and even most of the details looked pretty good. But let’s dig in.
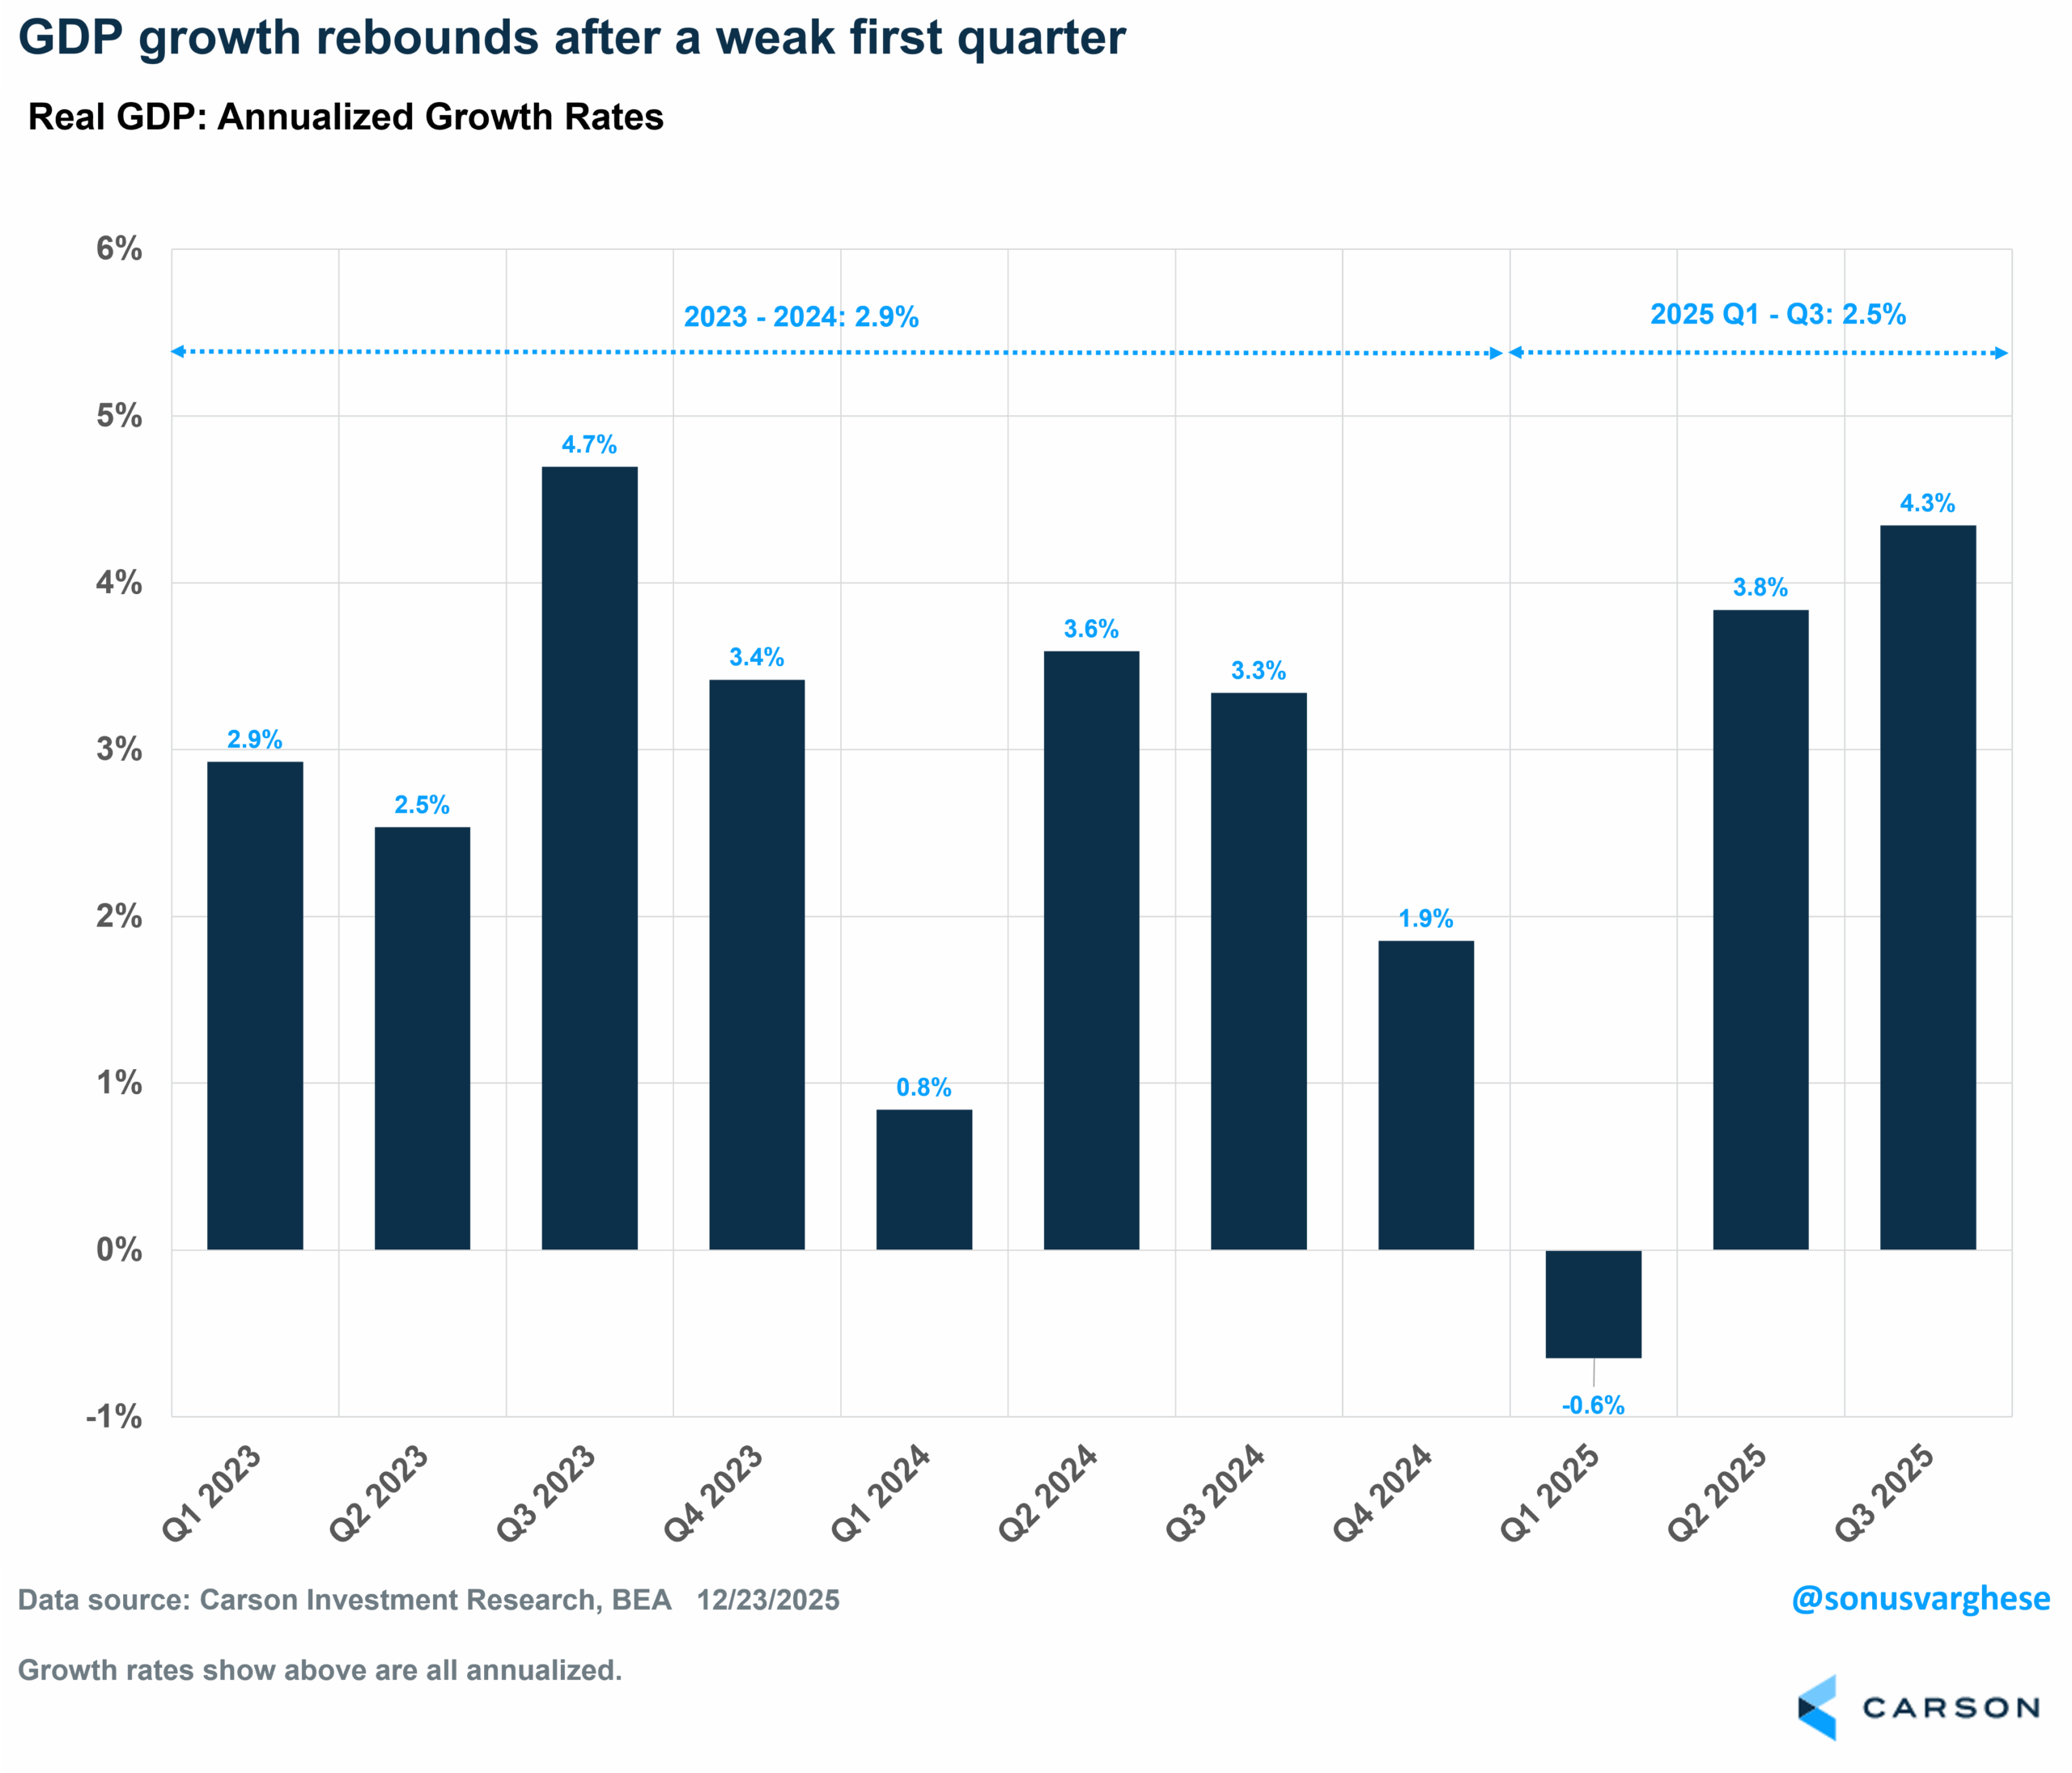
I’ll start with the headline: real GDP growth (so after adjusting for inflation) surged at an annualized pace of 4.3% in Q3, accelerating from an already strong 3.8% pace in Q2. The last two quarters have now made up for the big slowdown in Q1 and the annualized pace of growth over the first three quarters is 2.5%. That’s not as strong as the 2.9% pace we saw in 2023–2024, but is similar to the 2.4% trend growth we saw from 2010–2019.
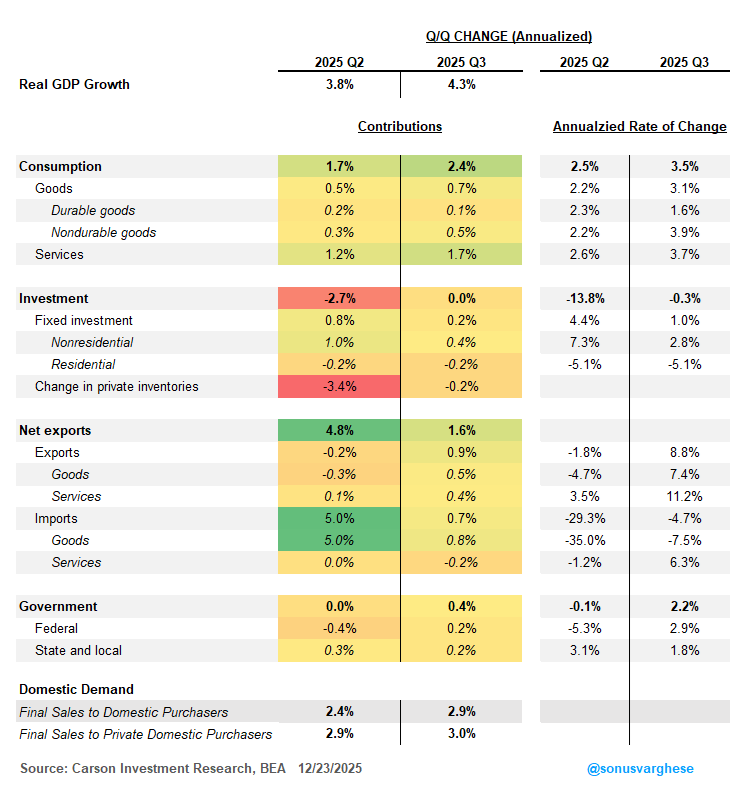
Now for some details: the next chart shows contributions from the big categories that make up GDP, including consumption (consumer spending), investment (including inventory changes), net exports, and government. Net exports and inventories tend to be the noisy parts of GDP growth, and in fact, the pullback in Q1 was driven by surging imports (as companies front-ran tariffs) and the subsequent rebound in Q2 was fueled by a reversal in imports. On the other hand, inventory build-up surged in Q1 and reversed in Q2.
Some highlights from the Q3 details:
- Inventories were less of a factor in Q3 and imports continued to slide. Net exports contributed 1.6%-points to the headline but over half of that was because both goods and services exports surged, helped along by a weaker dollar
- The good news is that consumption accelerated in Q3, rising at an annualized pace of 3.5% and contributing 2.4%-points to headline growth. That’s solid, even more so because it came on the back of strong goods and services spending. Spending was buoyed by recreational spending on both goods and services, offsetting a pullback in auto sales and belying concerns that households are struggling amid a cooling labor market.
- Business investment (“nonresidential investment”) was weaker than what we saw in Q2 but still relatively strong, rising at a solid 2.8% pace. What happened was software spending pulled back from the breakneck pace we saw in the first half of the year. This is related to the AI story and it’ll be interesting to see if this is just a blip or if companies really are taking a breather on investing in AI-related software.
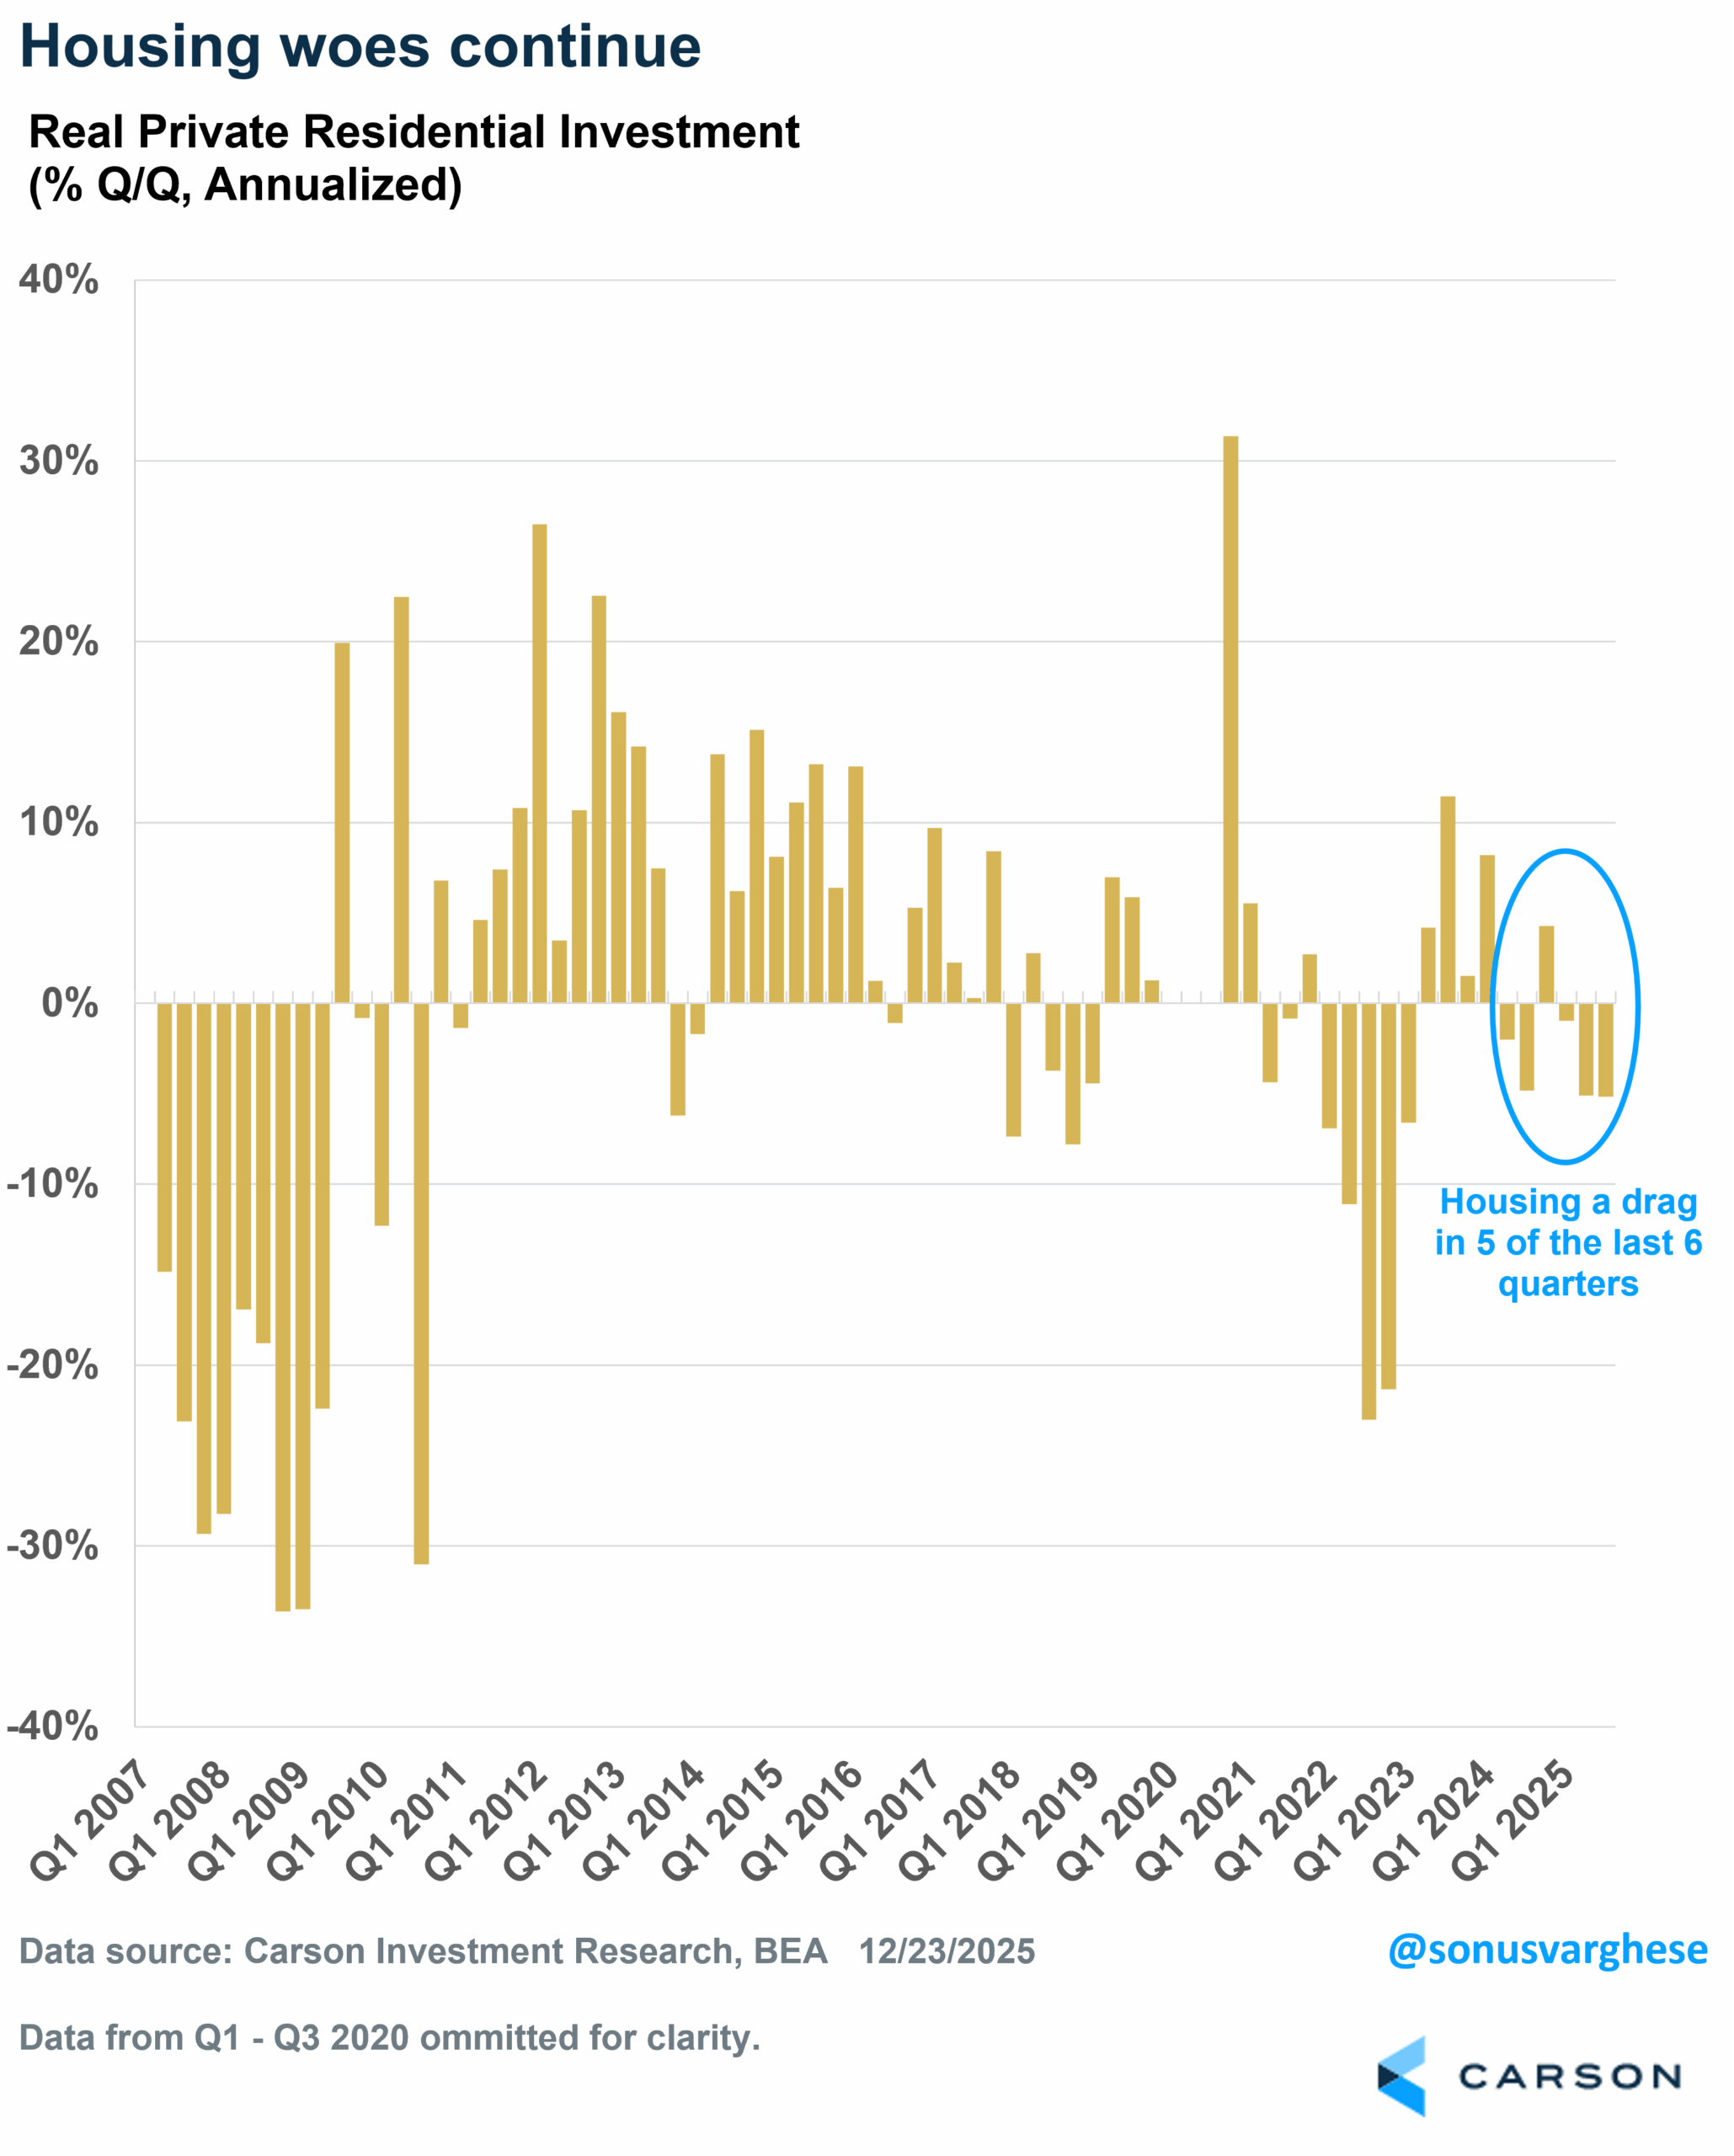
- Housing (“residential investment”) continues to struggle. It pulled back over 5% annualized in Q3, repeating what we saw in Q2.
- Government spending was also a positive after two quarters of being a drag on headline growth, contributing a solid 0.4%-points to headline GDP growth. Federal government spending was boosted by a near 6% jump in defense spending, the fastest in a year. State and local government spending and investment is actually twice as large as federal, and that also ran at a solid 1.8% pace.
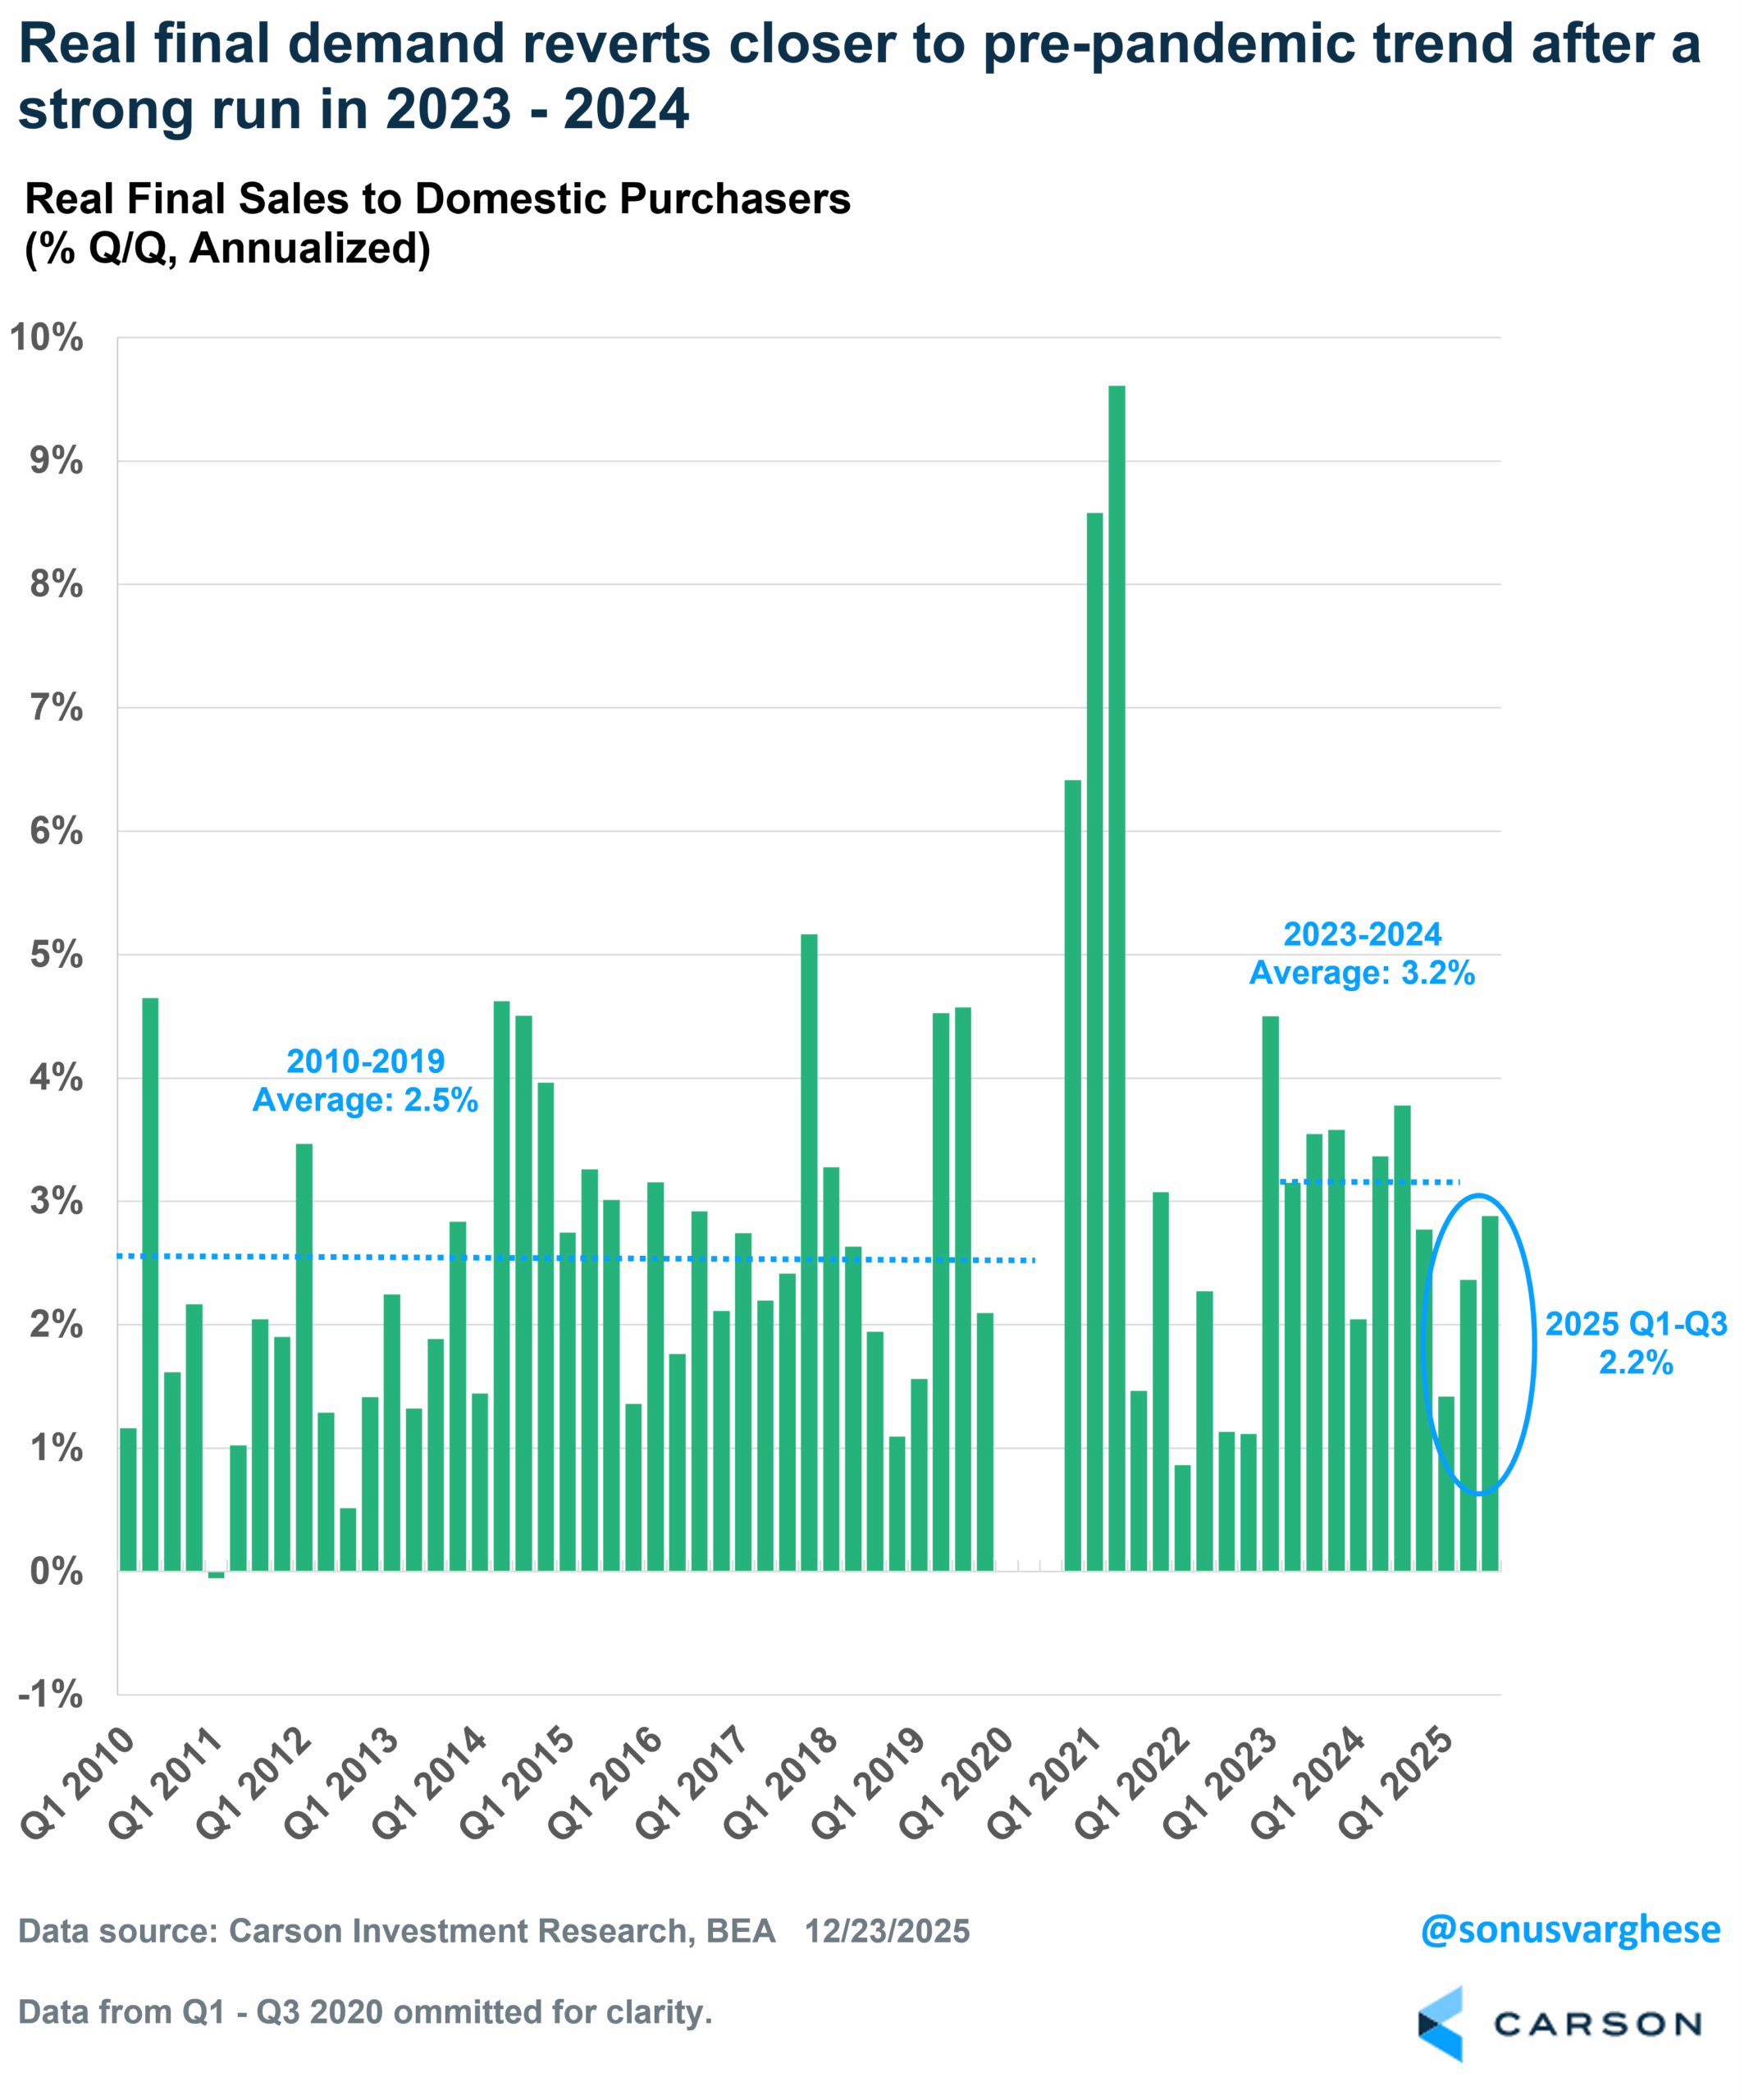
At the end of the day, what matters most is GDP growth excluding the volatile inventories and net exports data. Think of it as “core GDP,” which combines consumption, investment, and government. This is captured by “real final sales to domestic purchasers” and it rose at a solid pace of 2.9% in Q3, not far below the 3.3% annual pace we saw in 2023–2024. The rebound in Q3 brings the year-to-date pace of final sales to 2.2%, very close to the 2010–2019 trend of 2.5%. The big story here is that economic growth is running close to trend in 2025, albeit with a lot of ups and downs across the year.
The good news is that we came into Q4 with some momentum, and that could continue into 2026. In fact, private final sales (excluding government) has run at a near 3% annualized pace over the last two quarters. The Q3 data was even better than Q2 because consumption picked up, adding to the boost from AI-related investment spending and more than overcoming the drag from housing.
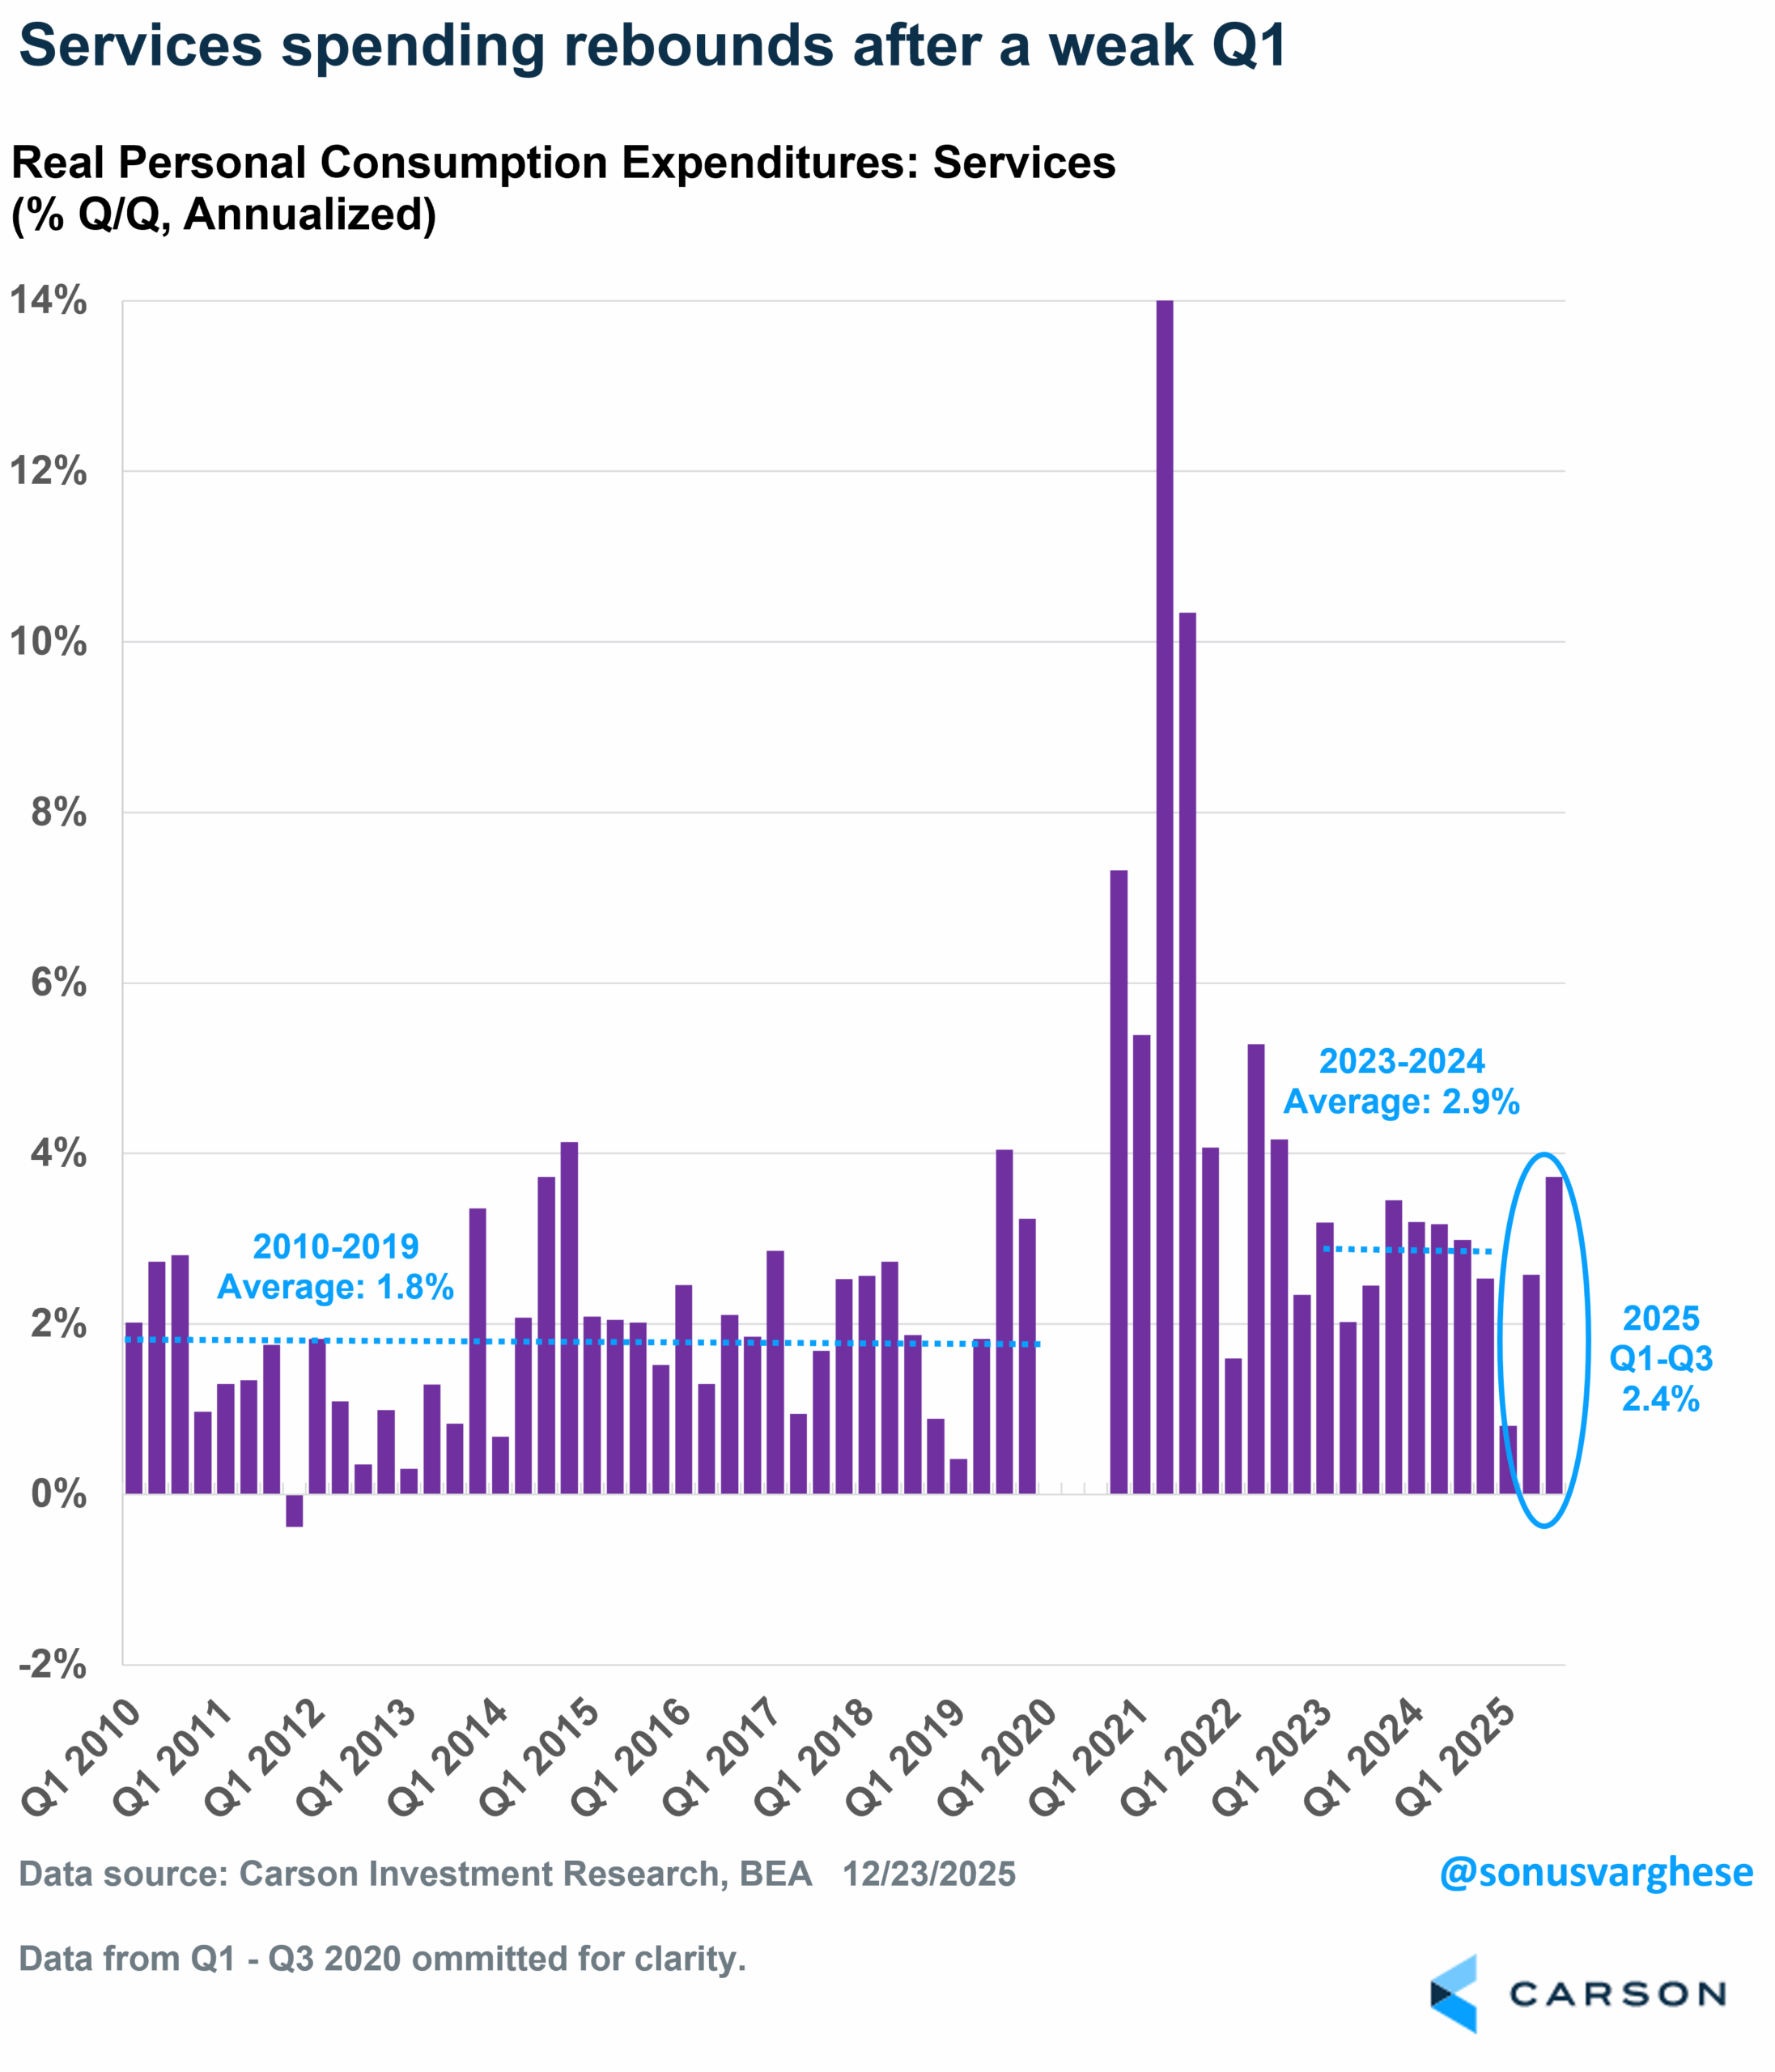
As I noted above, consumption was strong in Q3, on the back of goods and services spending. Goods spending can be quite volatile, but services makes up 45% of the economy and so it’s encouraging that it ran at a whopping 3.7% annualized pace in Q3, the fastest since the third quarter of 2022. Now, a chunk of that came from increased health care spending, but the rebound in Q3 brings the overall year-to-date pace of services spending to 2.4%. While that’s slower than what we saw in 2023–2024 (2.9%), it’s quite a bit ahead of the 1.8% annual pace we saw from 2010–2019. You’d think that services spending would suffer amid a cooling labor market, but wage growth is likely running at a faster clip than in the 2010s, boosting spending on things like recreational services, restaurants, and travel.
Stay on Top of Market Trends
The Carson Investment Research newsletter offers up-to-date market news, analysis and insights. Subscribe today!
"*" indicates required fields
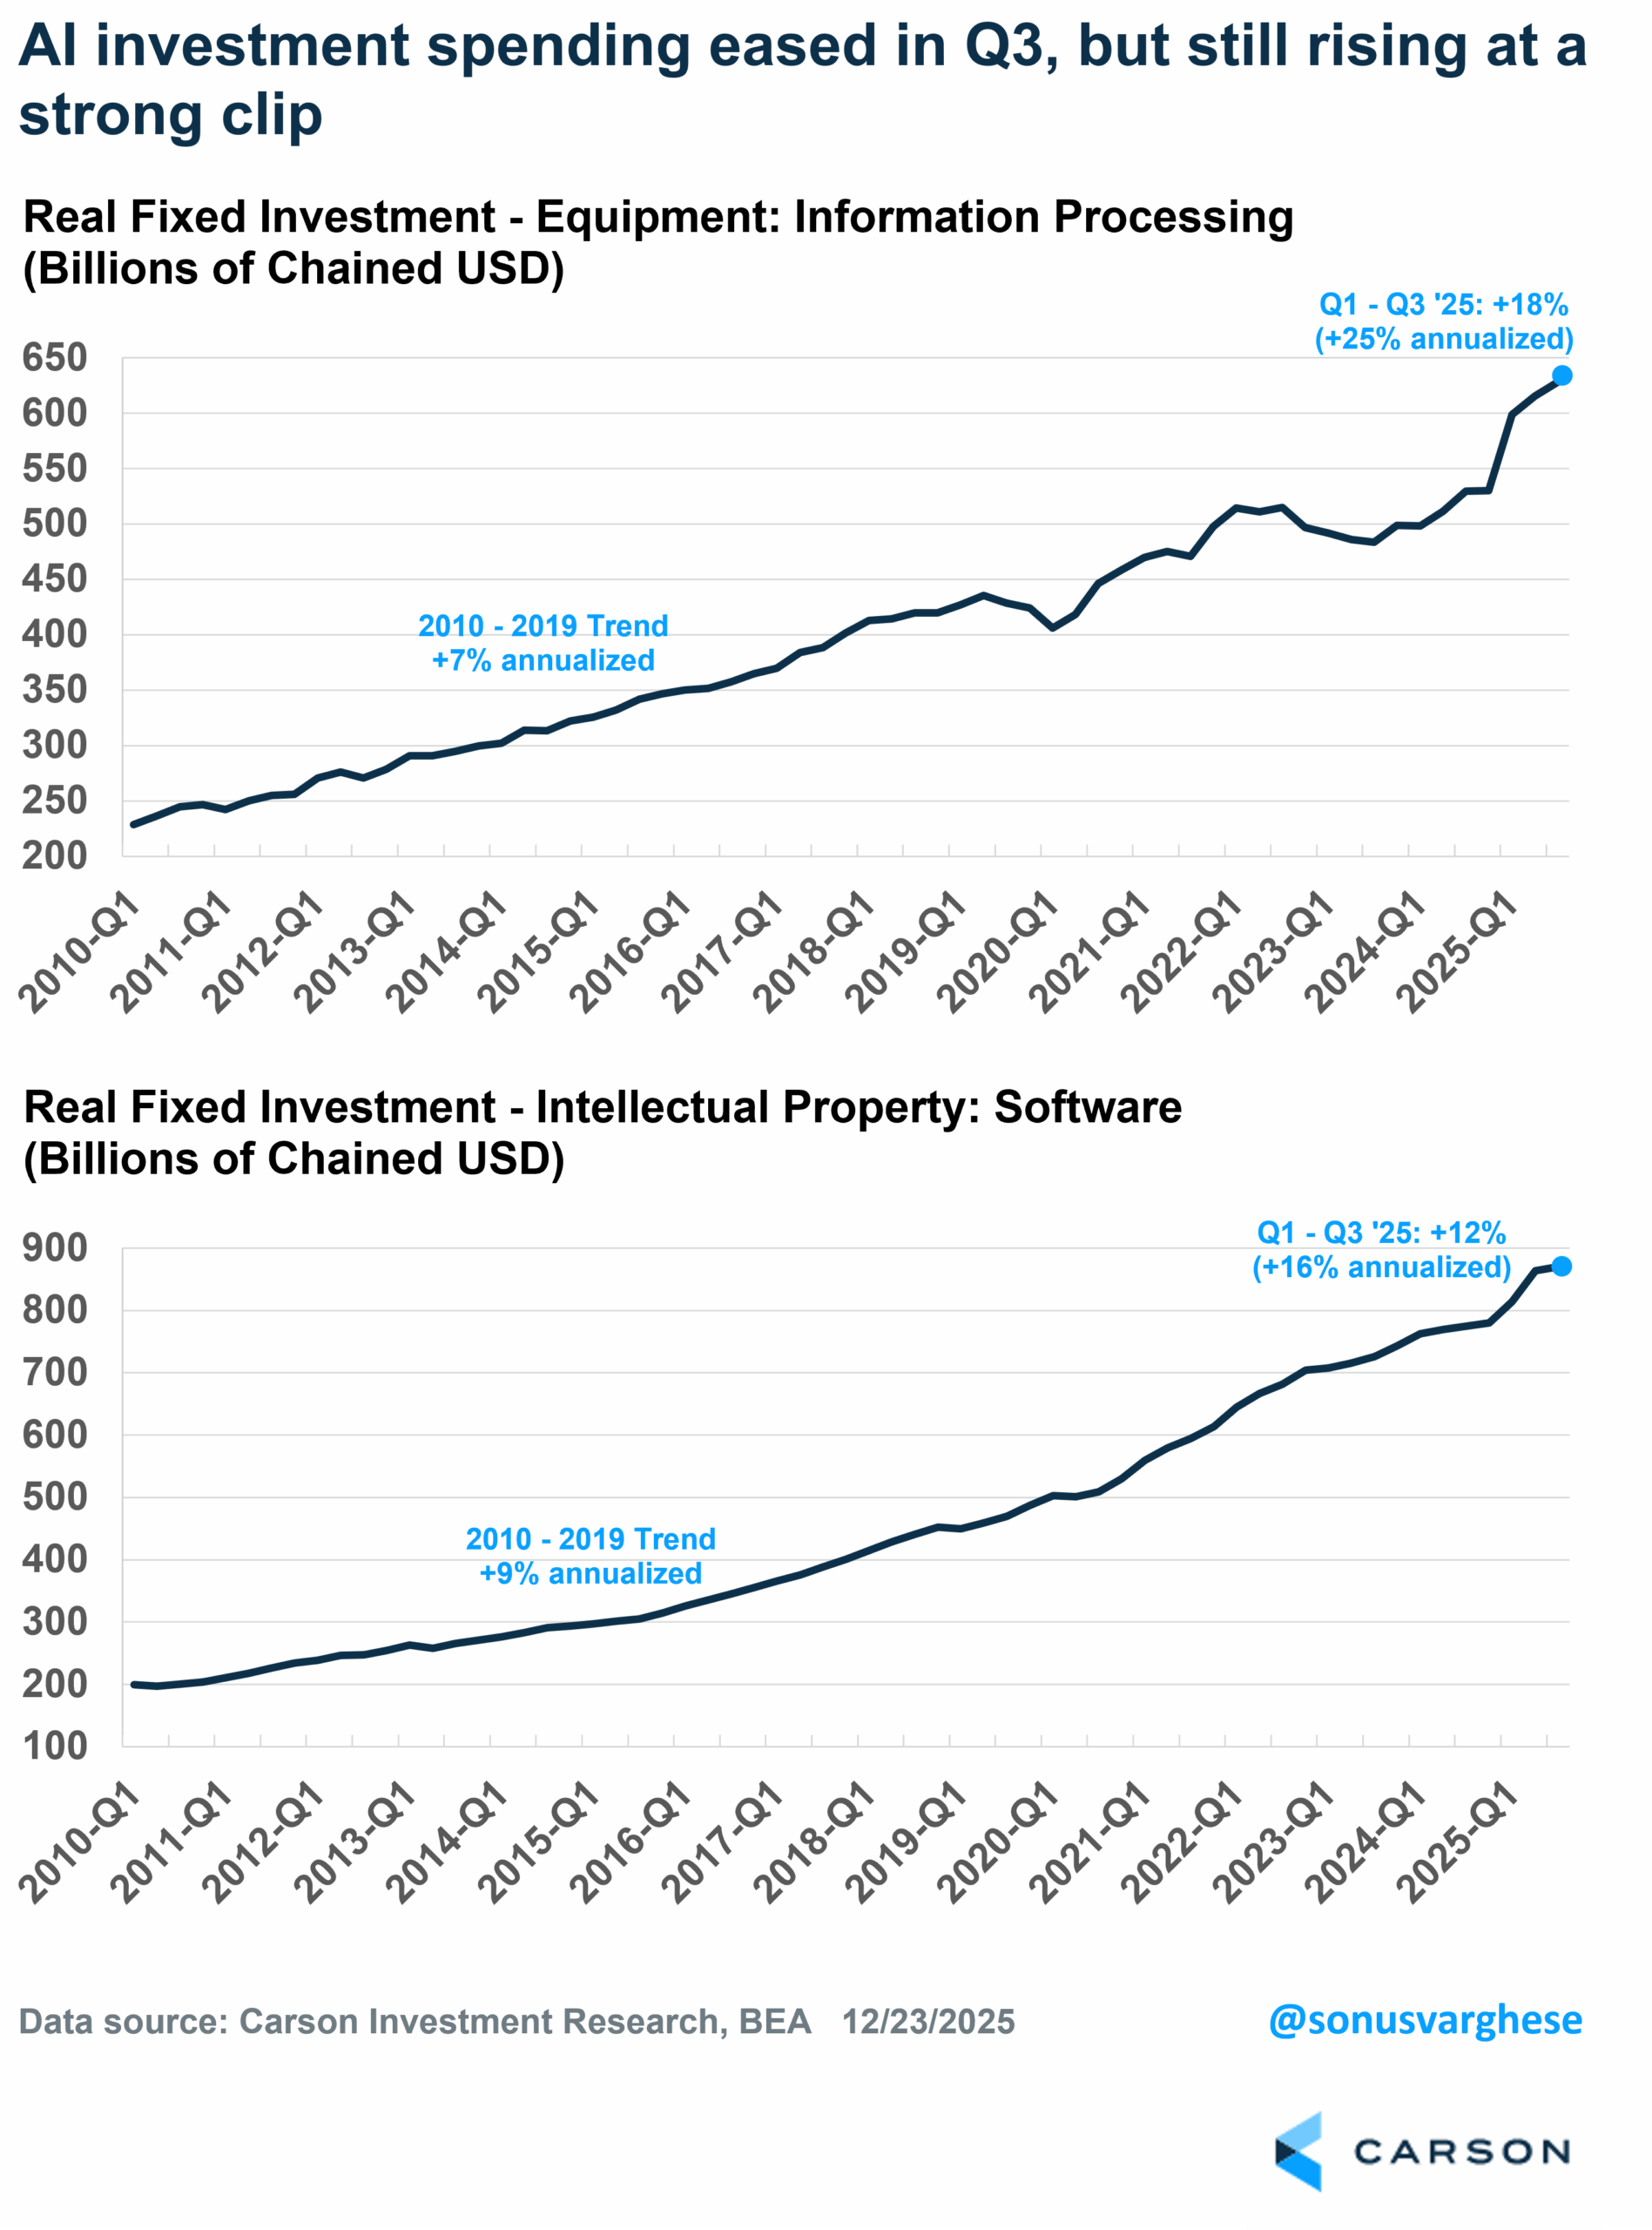
The top story now is AI and it certainly showed up in a big way in the macro data in 2025. Investment related to information processing equipment and computers and software spending contributed an average of 1.05%-points to real GDP growth in the first half. However, that eased in Q3, with these two categories contributing just 0.23%-points to headline GDP growth. Of course, that’s not nothing and the big picture is that AI-related spending remains quite strong, running well above the 2010-2019 trend:
- Investment in information processing equipment rose at an annualized pace of 8% in Q3, bringing the year-to-date pace to 25% (2010-2019 trend: 7%).
- Investment in software pulled back to an annualized pace of 3% in Q3, bringing the year-to-date pace to 16% (2010-2019 trend: 9%).
It’ll be interesting to see whether the pullback in software spending continues. If it does, that could be a sign that companies are becoming more cautious about deploying AI-related software, even as investment on the hardware side remains strong.
To no one’s surprise, housing was the big downer in the GDP. Residential investment fell for the third straight quarter and has now been a drag on GDP growth in five of the last six quarters. This is the area of the economy where monetary policy seems much tighter. Mortgage rates remain north of 6%, but the reality is that these are more tied to longer-term 10-year yields rather than short-term rates that are explicitly controlled by the Fed. And for long-term yields to fall much further, we’re going to need the inflation outlook to look much better than it does right now.
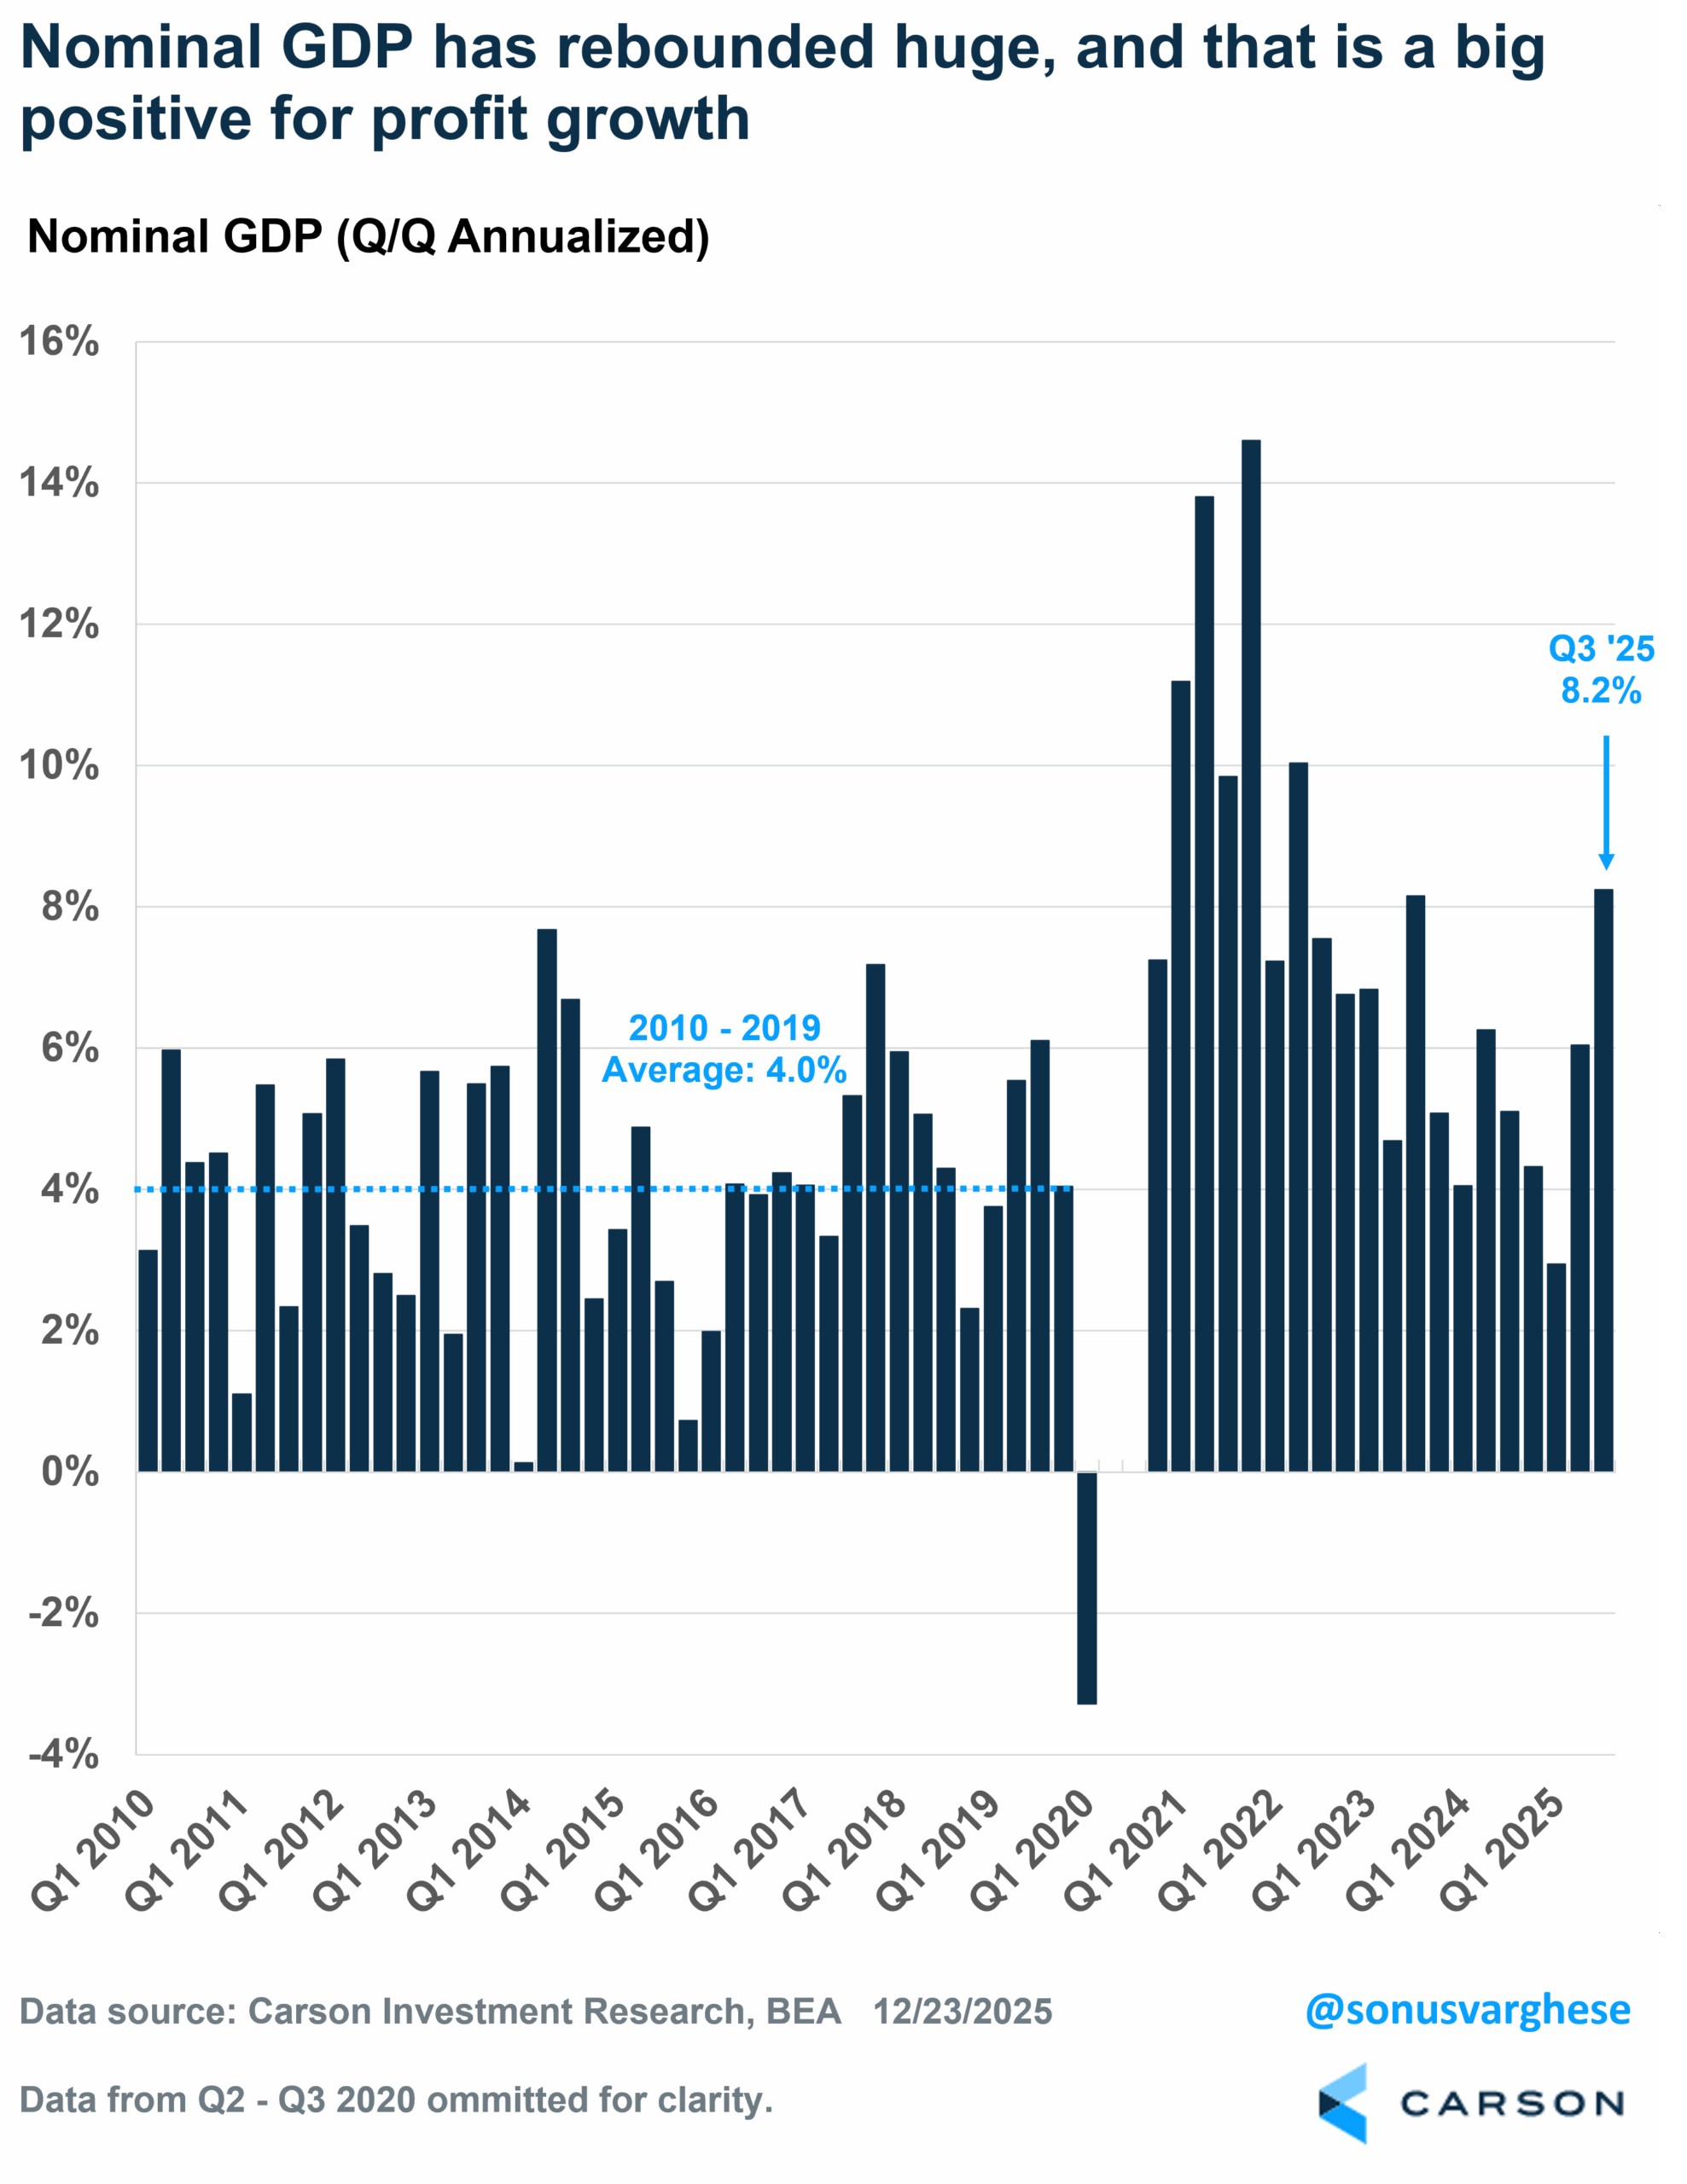
All the numbers I’ve discussed so far are adjusted for inflation. However, from the perspective of company revenues and profit growth, which is what is important for stocks, it’s nominal GDP growth that matters (GDP growth including inflation). Nominal GDP grew at an astounding 8.2% annualized pace in Q3, which follows an already hot 6% pace in Q2. The economy has grown at an annualized pace of 5.6% so far in 2025, which matches the annual pace we saw in 2023–2024 and is well above the 4% trend from 2010–2019.
Of course, the reason for the big jump in nominal GDP growth is inflation. The “GDP deflator” (total inflation from a GDP perspective) rose 3.7% annualized in Q3 and is up 3.2% year to date. Note that this measures price changes for all domestic goods, whether purchased by consumers, businesses, and/or government, whereas the Consumer Price Index measures price changes for just consumers. If you’re surprised by how strong profit growth has been this year, look no further than the fact that nominal GDP growth is running well above trend. And over half of that is due to elevated inflation.
The overall picture points to inflationary growth and that is not necessarily a bad thing for stocks. Profit growth comes from sales growth (which benefits from stronger economic growth) and margin expansion (which can result in higher prices), and the outlook as we move into 2026 looks good. The pickup in pace for final sales suggests consumer spending has some momentum on top of AI-related investment spending, and next year we’re going to see tailwinds from tax cuts and Fed rate cuts as well.
For more content by Sonu Varghese, VP, Global Macro Strategist click here.
8684279.1. – 30DEC25A
