July was an interesting month for markets. The S&P 500 was nearly flat, falling only 0.06% (including dividends). At the same time, the volatility around AI names was enough to blow up the AI-leveraged hedge fund Situational Awareness.
Even with the S&P 500 decline and the near-term correction for AI stocks, there were plenty of positive areas that could act as a diversifier (although bonds were certainly not among them this month). Our thesis heading into the year was that AI would have an impact across multiple areas of the economy and markets, making getting “AI exposure” somewhat unpredictable and defying traditional categories. The simplest approach if you had conviction in AI, or the AI infrastructure buildout, was simply to be overweight equities.
We think that thesis has generally held true. Few expected that AI would appear in value stocks or that emerging markets would suddenly be about South Korea and Taiwan, not China and India, or that the megacap tech stocks that were among the early AI darlings would come to be viewed, at least near term, as an inefficient way to get AI exposure. I don’t think the surprises are over from AI.
Remember, Amazon didn’t enter the S&P 500 until 2005, more than eight years after its IPO and well after the tech bubble burst. Google only went public in 2004; Meta (Facebook) in 2012. These were the companies that fulfilled the promise of the tech bubble and were among its real winners. And they weren’t even part of the tech bubble itself. So if someone asked me who the AI winners were going to be over the next 10 years, I would say that it’s better than even odds it’s a company no one is talking about now, or possibly one that doesn’t exist.
That’s a lot to take away from an up-and-down July for AI, but it hasn’t been just July.
Here’s a deeper look at how markets did in the month named after the person who gave us a calendar of 365 days to a year with a leap day every fourth year.
Broad Markets
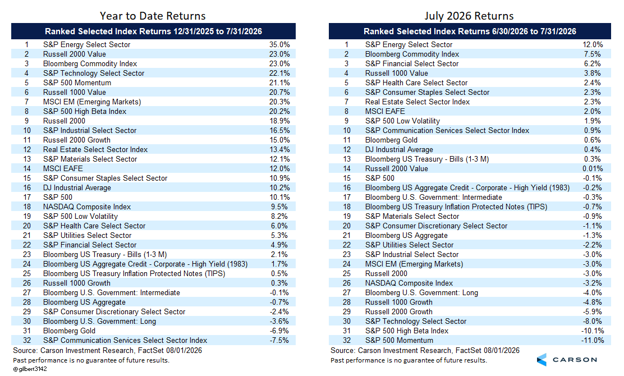
- The S&P 500 was down a total return of 0.06% in July for its second straight monthly decline, following a 0.95% decline in June. But that’s following gains of 10.5% and 5.3% in April and May, respectively. After such strong gains, taking a breather is perfectly normal.
- Despite the decline, stocks were still better than bonds. The Bloomberg US Aggregate Bonds Index (“Agg”) was down 1.3% in July.
- At the end of July, the S&P 500 was still up 10.1% year to date including dividends.
- Outside the S&P 500, there were plenty of indexes that saw gains in July, including the Russell 1000 Value Index (+3.8%), the MSCI EAFE Index of international developed market stocks (+2.0%), and the S&P 500 Low Volatility Index (+1.9%).
- The source of underperformance was not the “Magnificent Seven,” the seven technology-oriented megacap stocks. The Mag 7 saw an equal-weighted return of 2.8% in July. Nevertheless, their year-to-date equal-weighted average of 0.5% still trails the overall S&P 500 by a wide margin.
Equity Sectors
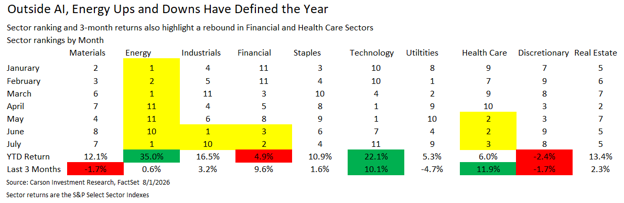
- Six of 11 sectors saw gains in July, the same as in June. All 11 sectors are higher one year trailing, and nine of 11 are higher year to date. Financials, staples, healthcare, and real estate were repeat gainers while materials, technology, and consumer discretionary were down both months.
- The longest current monthly win streak is healthcare at three. Materials has the longest losing streak, also at three months.
- Energy has been up and down this year, finishing in the top two or bottom two of the 11 sectors every single month. In January, February, and March, energy finished first, second, and first, respectively. In April, May, and June, it was last, last, and second to last. With the renewed tensions in the Middle East, energy was back to the top performer in July. Despite the ups and downs, energy is the best-performing sector this year (+35.0%) and trailing year (+40.9%), with a large lead on second place. (Technology stands second both year to date at +22.1% and year trailing at 34.4%.)
- Healthcare finished in the top three for the third month in a row and is the top performing sector over the last three months at +11.9%. However, it’s still middle of the road for the year at +6.0%, good for only seventh place of the eleven sectors.
- After starting the year as the worst performing sector in January, financials were in the top three for three of the next five months, including both June (#2) and July (#3). That was good enough for third place over the last three months (after healthcare and technology), but year-to-date it’s still third worst, ahead of only consumer discretionary and communication services.
- Industrials went from the best-performing sector in June to second-to-last in July.
Equity Style
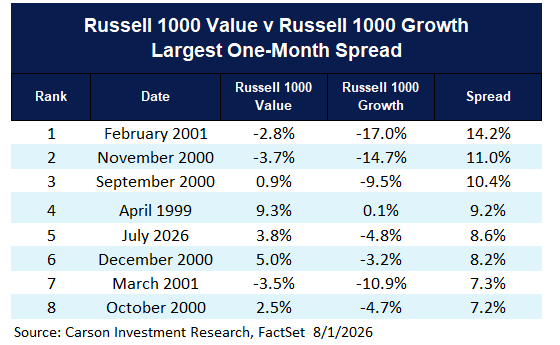
- The Russell 1000 Value Index outperformed the Russell 1000 Growth Index by 8.6 percentage points (+3.8% to -4.8%). That’s the fifth best performance for value of all time over the 571 months (or almost 48 years) of data we have.
- Seven of the eight best months for value versus growth (outside of last month) all took place around the 1990s tech bubble bursting.

Stay on Top of Market Trends
The Carson Investment Research newsletter offers up-to-date market news, analysis and insights. Subscribe today!
"*" indicates required fields
- The S&P 500 Low Volatility Index outperformed the S&P 500 High Beta Index by 13.0 percentage points (+1.9% to -10.3%). That’s good for the 12th best month over 428 months of available data, or a little less than 26 years. What’s extraordinary about it is it was not a month of sharp equity declines, with the S&P 500 nearly flat.
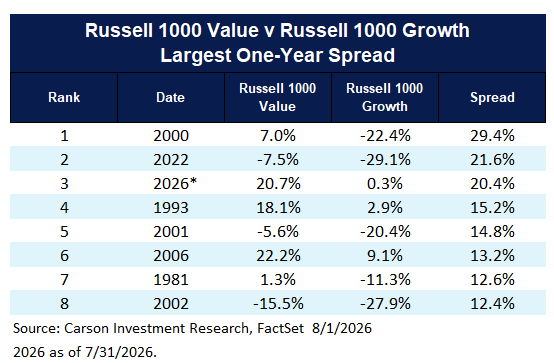
- The difference between value versus growth and high beta versus low vol? Value was already much better than growth and padded its lead. Year to date, the Russell 1000 Value Index is up 20.7% to the Russell 1000 Growth Index’s 0.3%. But high beta has dominated low volatility, and July just helped narrow the spread a little. As of the end of July, the High Beta Index is +20.2% to Low Volatility’s 8.2%.
Fixed Income
- After three consecutive months of very modest gains, the Bloomberg US Aggregate Bond Index (“Agg”) fell over 1% in July, its second decline of over 1% this year, joining March. Prior to that, there hadn’t been a month with a more than 1% decline since December 2024.
- The Agg has a 0.34 correlation with the S&P 500 (monthly data) over the last year, a 0.54 correlation over the last three years, and a 0.61 correlation over the last five years. (Bonds are more valuable as a diversifier when their correlation with stocks is near 0 or negative.)
- The Agg is down 0.7% year to date as of the end of July. If interest rates don’t move over the rest of the year, it would still be expected to finish with a positive return because of its coupon (interest payments).
- Very short maturity Treasury bills (Bloomberg US 1-3 Month Treasury Bill Index) are up 2.1% year to date and don’t really carry any volatility.
Commodities
- Gold ended its four-month losing streak in July, picking up 0.6%.
- The broad Bloomberg Commodity Index was stronger due to energy commodities, rising 23.0% in July.
As we head into August, our general view remains that the wave of inflationary growth and extraordinary AI spending has not yet run its course. For investors, that continues to argue for an overweight to equities paired with real equity diversification, since the AI trade keeps showing up in unexpected places. But July reminded us that there’s a lot of volatility beneath the surface of the AI wave, and one day there very well could be a tech-bubble-like wipeout. I’m an AI optimist, but I’m also a student of markets, and market history suggests that this wave of capex spending and AI enthusiasm will have its cyclical downturn. July held just a hint of it, but some investors, certainly Situational Awareness, must already be thinking, Et tu, AI? That thought will likely be more widespread one day, even if AI achieves its speculative promise. But we don’t think we’re there yet.
For more content by Barry Gilbert, VP, Asset Allocation Strategist, click here.
9058098.1. – 4AUG26A