Anthropic priced its IPO on Wednesday, and shares begin trading today. It will be the largest IPO of all time, with the company raising $81.3 billion by selling its stock, plus another $26 billion in a concurrent private placement. That’s a total of $107 billion! For context, SpaceX raised $75 billion in its IPO back in June, which was a record at the time.
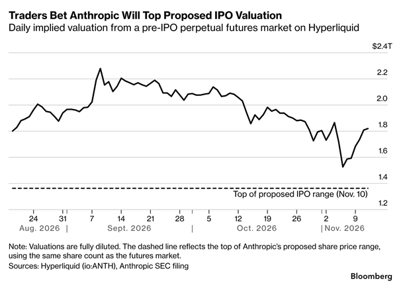
The amended S-1 filed on November 10 set a price range of $70–78 a share, valuing the company at up to about $1.4 trillion on a fully diluted basis. Traders were betting on more. Hyperliquid runs a pre-IPO perpetual futures market on Anthropic, and the implied valuation there was running around $1.8 trillion, almost 30% above the top of the proposed range. The implied valuation has bounced around quite a bit. It peaked above $2.2 trillion in early September and fell to about $1.5 trillion at the start of November, before rebounding over the past week. But it stayed above the top of the proposed range the entire time.
Ahead of the SpaceX IPO, we looked at what history tells us about IPOs. SpaceX has now been public for five months, so we get to see how that played out, and what it might mean for Anthropic. First, a refresher on the history.
What History Says About IPOs
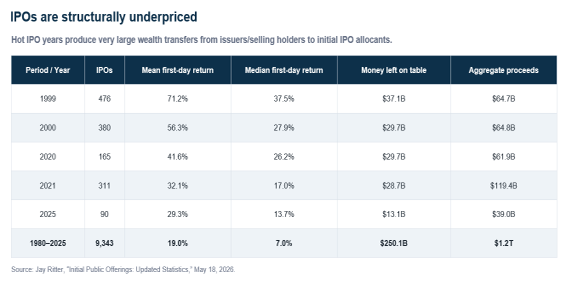
Professor Jay Ritter at the University of Florida maintains a deep IPO database covering 1980 to 2025. He uses a conservative, consistent definition of an IPO (excluding SPACs, REITs, penny stocks and the like), which allows apples-to-apples comparisons over time. One metric he tracks is the first-day return, the gap between the first-day closing price and the offer price. Multiply that gap by the shares offered and you get “money left on the table,” the extra amount the company and selling shareholders could have raised had the IPO been priced at the first-day close. For example, if a company sells 10 million shares at $20 and the stock closes Day 1 at $30, it left $100 million on the table.
That said, few investors actually capture a first-day pop. The company sells at the offer price, insiders are typically locked up for about 180 days, and flipping by those who receive allocations is usually discouraged. What ultimately matters is the long-term return, both in absolute terms and relative to the market. With that, here are some big-picture observations.
IPOs Are Structurally Underpriced
Ritter’s sample includes 9,343 IPOs from 1980 to 2025. The mean first-day return was 19.0%, with much higher returns in hot IPO years like 1999, 2000, 2020, and 2021. The median first-day return was 7.0%. Aggregate proceeds came to $1.2 trillion, but there was another $250 billion of money left on the table. 2025 was a strong year. There were 90 IPOs, with a mean first-day return of 29.3% and a median of 13.7%. Aggregate proceeds were $39 billion, with $13.1 billion (33%) of money left on the table.
IPO Underpricing Is High Even Outside the Internet Bubble
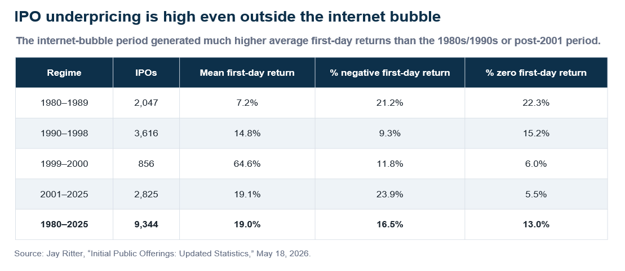
During the internet bubble of 1999–2000, the average first-day return was a massive 64.6%. But even outside of that period, average first-day returns are large. Since 2001, the average is 19.1%.
IPOs Have Shifted Toward Less-Profitable Companies, but Those Have Higher First-Day Pops
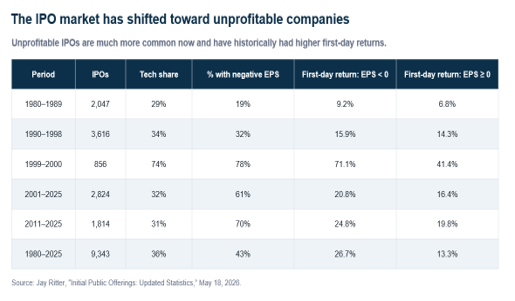
Across 1980–2025, 43% of IPOs had negative trailing earnings, but that share has shifted higher over time. It was 19% in the 1980s, rose to 32% from 1990–1998, and surged to 78% during the 1999–2000 internet bubble. It was 61% from 2001–2025, and 70% from 2011–2025. Interestingly, the average first-day return for IPOs with negative earnings was 26.7%, about double the 13.3% average for IPOs with positive earnings.

Stay on Top of Market Trends
The Carson Investment Research newsletter offers up-to-date market news, analysis and insights. Subscribe today!
"*" indicates required fields
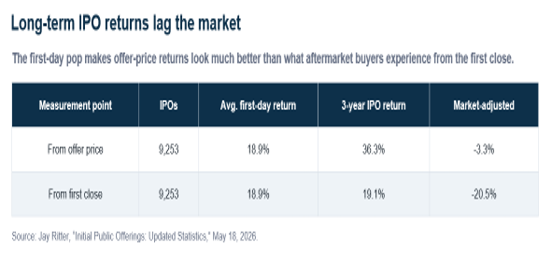
Long-Run IPO Returns Lag the Market Historically
If you’re holding for three years, you’re better off buying the broad market than the IPO. The average three-year buy-and-hold return from the first-day closing price is 19.1%. That lags the market by 20.5 percentage points! Long-term returns look better if you’re able to get the IPO at the offer price, with an average return of 36.3%. But even that lags the market by 3.3 percentage points. (The market-adjusted return is the IPO’s buy-and-hold return from the first close minus the compounded market return over the same three-year period.)
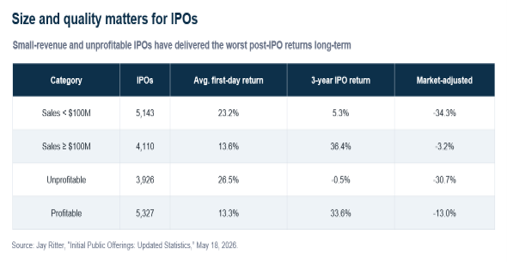
Historically Larger and More Profitable IPOs Fare Better Over the Long Term
When it comes to IPOs and long-term returns, size and quality matter. IPOs with less than $100 million in sales had a 23.2% average first-day return, but their three-year average return was just 5.3%, lagging the market by 34.3 percentage points. IPOs with more than $100 million in sales had less of a pop, with a 13.6% average first-day return, but their three-year average return was 36.4%, lagging the market by only 3.2 percentage points.
It’s a similar story with profitability (defined as positive trailing 12-month earnings before the IPO). Unprofitable IPOs had a larger first-day pop, averaging 26.5%, but their three-year average return was -0.5%, lagging the market by 30.7 percentage points. Profitable IPOs had an average first-day return of 13.3%, and a three-year average return of 33.6%, lagging the market by 13 percentage points.
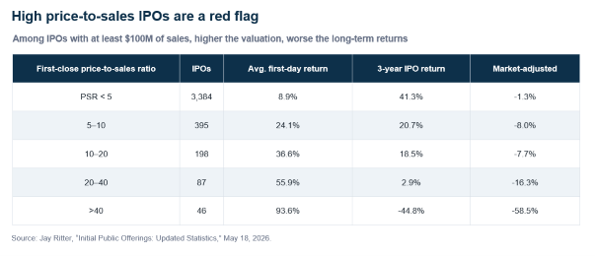
High Price-to-Sales (P/S) Ratios Can Be a Red Flag
Among IPOs with at least $100 million in sales, the most expensive ones (measured by price-to-sales ratio) had the biggest first-day pops but lagged the broad market significantly over the next three years. IPOs with a P/S above 40 had an average first-day return of 93.6%, but their three-year average return was -44.8%, lagging the market by 58.5 percentage points. IPOs with a P/S below 5 had an average first-day return of just 8.9%, but their three-year average return was 41.3%, lagging the market by only 1.3 percentage points.
SpaceX: How Did It Play Out?
Back in June, we pointed out a few statistics from the SpaceX S-1. 2025 revenue was about $18.7 billion, well above the $100 million threshold. At a $1.7 trillion valuation, the price-to-sales ratio would be about 91x. And SpaceX was unprofitable, reporting a net loss of $4.9 billion in 2025 and $4.27 billion in Q1 2026.Based on history, you’d expect a very large Day 1 pop, but a slog over the long term. That’s pretty much what happened. SpaceX priced its IPO at $135 and opened at $150, 11.1% above the offer price. It closed Day 1 at $160.95, a first-day return of 19.2%.
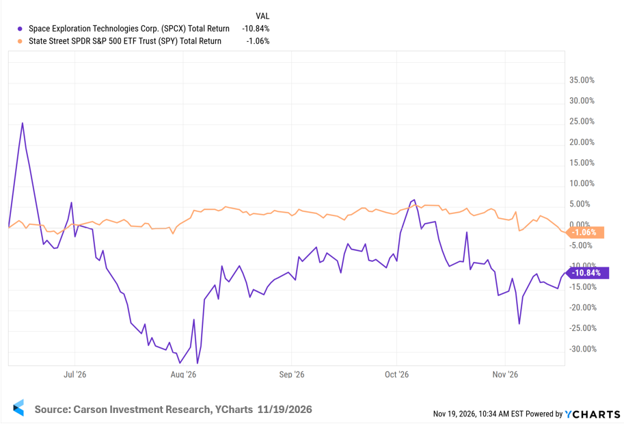
It’s been a rough ride since then. The stock peaked on June 16, just a few days after the IPO, about 25% above its Day 1 close. It then fell 46.4% from that peak by August 5. As of this morning, SpaceX is trading around $143.50, about 29% below its June peak. That’s roughly 6% above the IPO price, but 10.8% below the Day 1 close. If you bought at the Day 1 close, you’d have been better off buying the S&P 500 (SPY), which has a total return of -1.1% over the same period. The S&P 500 has basically gone nowhere for five months, but buying SpaceX near the close on Day 1 would have left you down almost 11%.
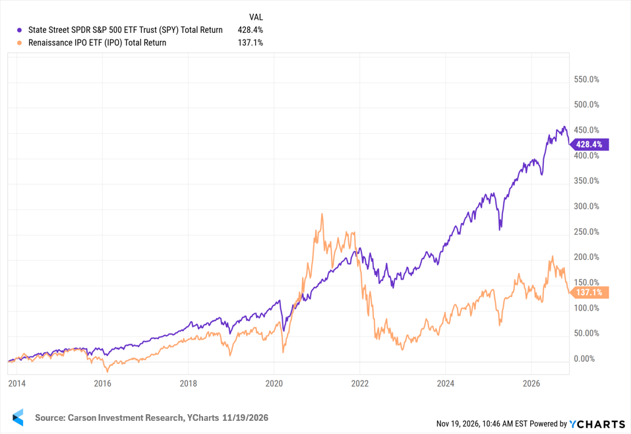
Taking a longer view, IPOs as a group have trailed the broad market. The Renaissance IPO ETF (IPO), which holds recently public companies, has returned 137.1% including dividends since its launch in late 2013, well short of the S&P 500’s 428.4% total return over the same period.
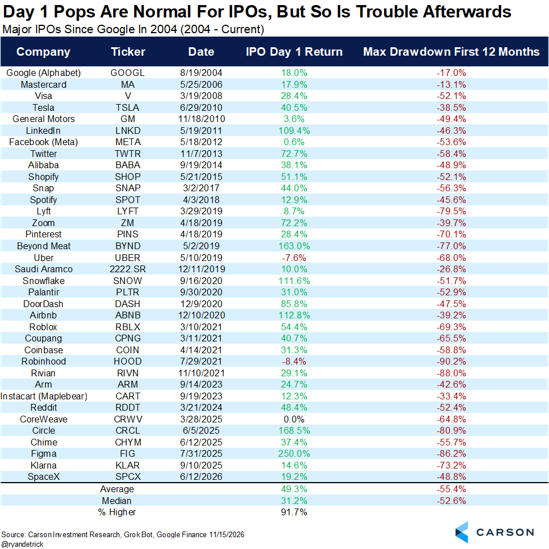
SpaceX isn’t unusual. Ryan Detrick, Chief Market Strategist, put together a table of 36 major IPOs since Google in 2004, and it’s a good reminder that Day 1 pops are normal, but so is trouble afterward. Of those 36 IPOs, 91.7% closed higher on Day 1. The average Day 1 return was 49.3%, and the median was 31.2%. But the average maximum drawdown over the first 12 months was -55.4%, and the median was -52.6%. Every single one of these IPOs had a drawdown of at least 13% in its first year. That includes Mastercard (-13.1%) and Google (-17.0%), which turned out to be big long-term winners. Robinhood fell as much as 90.2%
What About Anthropic?
Here are some statistics from the Anthropic S-1. 2025 revenue was about $4.6 billion, well above the $100 million threshold, and it surged to $33.2 billion in the first nine months of 2026, including $17 billion in Q3 alone. At a $1.4 trillion valuation, the price-to-sales ratio would be about 305x on 2025 revenue. On trailing 12-month revenue of roughly $35 billion, it would be 40x, and at a $1.8 trillion valuation, it would be 51x. Anthropic is also unprofitable, reporting a net loss of $42.0 billion in 2025 and $23.3 billion in Q3 2026.
That puts Anthropic right at the edge of the P/S above 40 bucket that has historically seen the biggest pops and the worst long-term results, and it’s unprofitable to boot. Rapid revenue growth could change the math over time, but history is a useful guide to what to expect.
The Bottom Line
History offers a useful framework for thinking about IPOs. Large, high-profile offerings have often seen strong first-day gains, while longer-term results have varied widely and have frequently trailed the broader market. Of course, every company is different, and past patterns don’t guarantee future results. Anthropic’s rapid revenue growth is one factor that sets it apart, and how the stock performs from here will depend on the company’s execution and on broader market conditions.
For investors, the takeaway isn’t to chase or avoid any single IPO, but to keep a long-term perspective. The first year after an IPO often comes with plenty of volatility, so it pays to be selective, stay diversified, and keep position sizes in check. Anthropic’s debut is a milestone moment for markets, and we’ll be watching closely to see how it unfolds.
For more content by Sonu Varghese, Chief Macro Strategist, click here.
9246906.1. – 19NOV26A