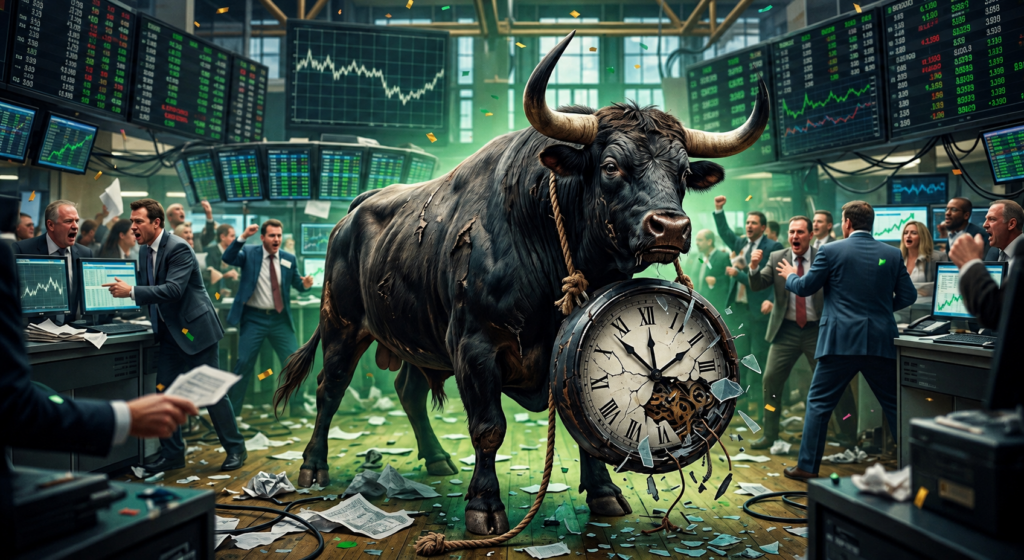
“Bull markets are like a cruise ship. Once they get moving, they are hard to slow down, hard to stop, and very hard to turn around.” Ryan Detrick, Carson Group’s Chief Market Strategist
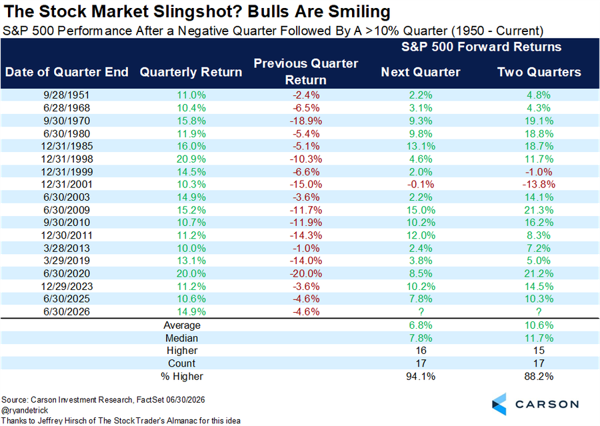
Stocks soared last week, with the S&P 500 gaining more than 3.5% while the tech-heavy Nasdaq soared more than 5%, both making new all-time highs along the way. Sparking the surge was continued strong overall earnings. According to FactSet, Q2 S&P 500 earnings are now up a staggering 50.4%, the best since Q2 2021. At the start of earnings season, earnings were expected to be up approximately 23%, and they were up 38% just two weeks ago. Additionally, 86% of companies have reported earnings that came in better than expectations, one of the highest beat rates ever. Earnings have historically driven long-term stock gains, and this remains a big reason why stocks have done so well this year.
Big Picture
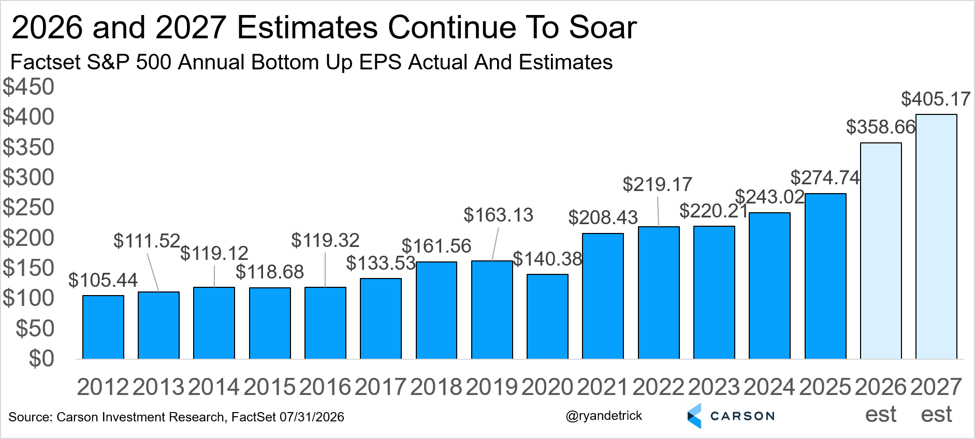
Let’s take a big-picture look at the past several months. Coming off the late March lows, the S&P 500 soared 16% in April and May, one of the greatest two-month rallies ever. As we noted then, historically, large surges like that have tended to resolve higher, but they very well could need a pause first. Stocks can correct two ways: through price and through time. As we show below, the S&P 500 corrected via time, moving virtually sideways for 11 weeks to catch its breath before the big breakout last week. All in all, we view this as perfectly healthy market action, and it likely says the bull market continues.
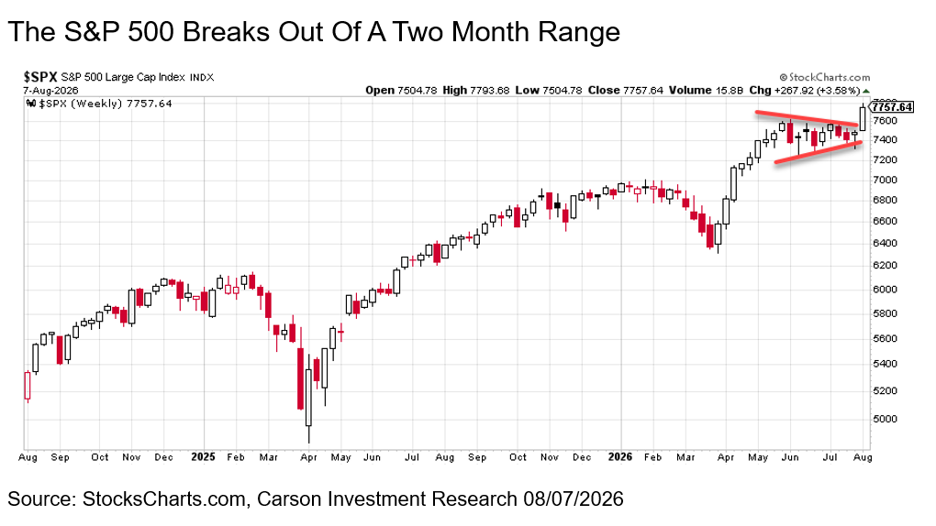
Another angle here is that after a negative Q1, the S&P 500 came back with a historic nearly 15% gain in Q2. We shared this table back in July, but it suggested the odds favored this upward momentum to continue in Q3, as only once (out of 17 times) had the quarter following a negative quarter, then a 10% plus quarter, been in the red. And check it out, the one time it was lower was down a whopping 0.1% back in 2002. After a flat July, things are getting back on track in this historically weak month of August.
More Good News
Yes, if you were all in on the high-flying momentum/AI names in July, it was a rough month. Of course, those names were up incredible amounts and more than due for a well-deserved break. Even a very large hedge fund invested in these names (and using too much leverage) nearly went under before it found a buyer for some of its securities.
But this is why we’ve stressed remaining diversified in this bull market, not only chasing the best groups.
Remember when the private equity names were all very weak, and they were going to bring the whole market down with them? We heard this nonstop late last year and into March of this year. Well, those same names are now quietly breaking out to new highs. This is good news.
More good news is the US Dollar rolled over two weeks ago and is now moving lower. We’ve found that when trouble is brewing, the ol’ Greenback tends to jump, not fall. This is another good sign under the surface that risk assets should continue to do well.
Lastly, we find it extremely encouraging to see how bank stocks, for instance, took the baton in July, even as semiconductors and other former leaders fell. Many bank stocks are just now breaking out above levels from 2007! Speaking of 2007, bank stocks peaked early in the year and, in many cases, were crashing well ahead of the ultimate S&P 500 peak in October of 2007. In other words, banks were a warning sign back then, and I think they are a warning this time as well, only this time the warning is that things are good and you want to benefit from this bull market.
I’ll sum it up like this: the lifeblood of a bull market is rotation, and we continue to see that currently.
Breadth Remains Strong
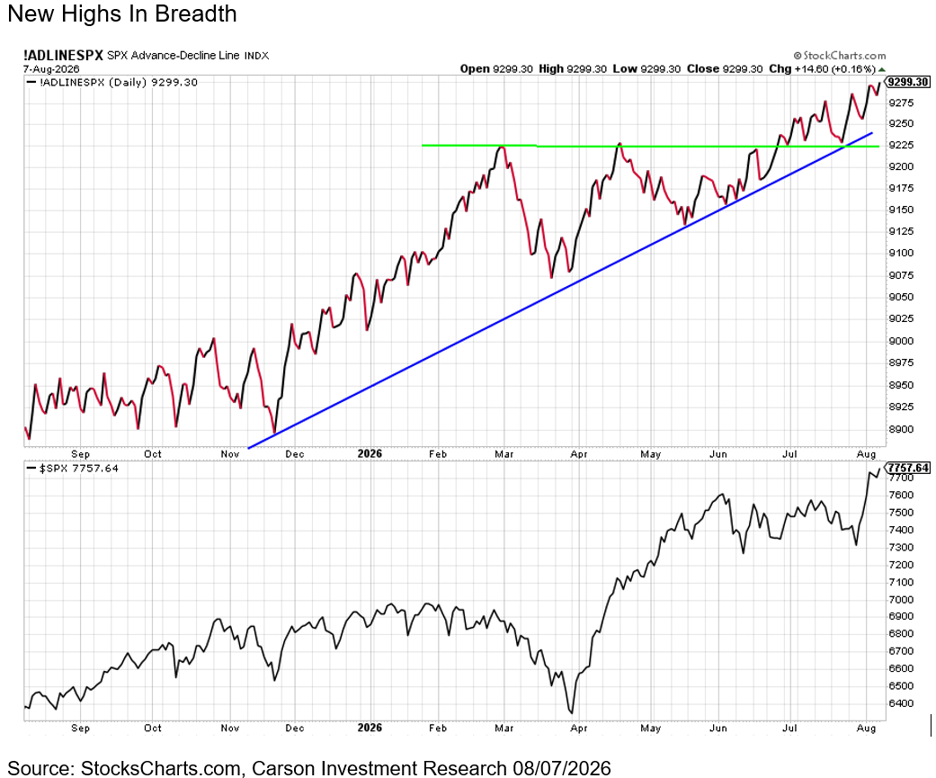
Building on the lifeblood of a bull market, one of our favorite ways to measure market breadth is by looking at advance/decline lines. These are simply a cumulative tally of how many stocks are going up versus down each day. To see A/D lines trending higher is a clue that things are healthy under the surface. Even though many high-flyers were cracking in July, A/D lines held up well, providing a clue that things weren’t about to crash like so many on TV were claiming. The S&P 500 A/D line just hit more new highs this week, supporting our view that this bull market is alive and well.
Fear Came Back In Spades
People know we’ve been bullish for years now, and they always ask me, what would change you to turn more cautious or even bearish? A jump in the US Dollar, a major hawkish shift from the Federal Reserve Bank (Fed), stress showing up in the credit markets, and weakening A/D lines all come to mind.

Stay on Top of Market Trends
The Carson Investment Research newsletter offers up-to-date market news, analysis and insights. Subscribe today!
"*" indicates required fields
Another thing that would worry me is if we had a few bad days and everyone remained calm. Fortunately, that isn’t the case at all, especially in July during the AI/momentum blowups. The American Association of Individual Investors (AAII) Sentiment Poll recently had the lowest number of bulls since September and, incredibly, has seen more bears than bulls for three straight weeks, even with stocks soaring.
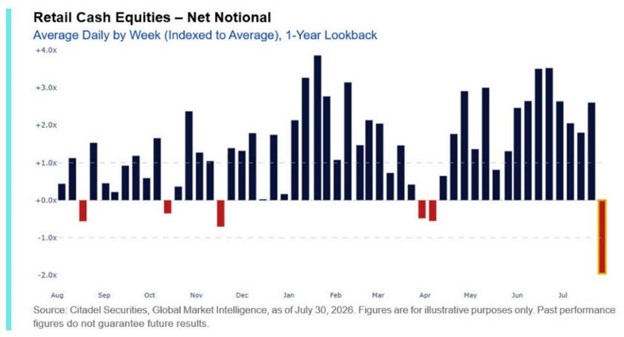
But sentiment polls are just that, opinions, and they can change quickly. We also like to follow the hard data on what investors are doing, and that is why I loved this data from Citadel Securities that showed how retail sold at one of the highest clips in history during the last week of July. Sure enough, that was needed to flush out the weak hands and kick-start this bull market.
Speaking of sentiment, here’s one of my favorite cartoons on the subject, which is quite accurate, I must say.

Cartoon by Dave Blazek
The Bull Continues and Isn’t as Old as You Think
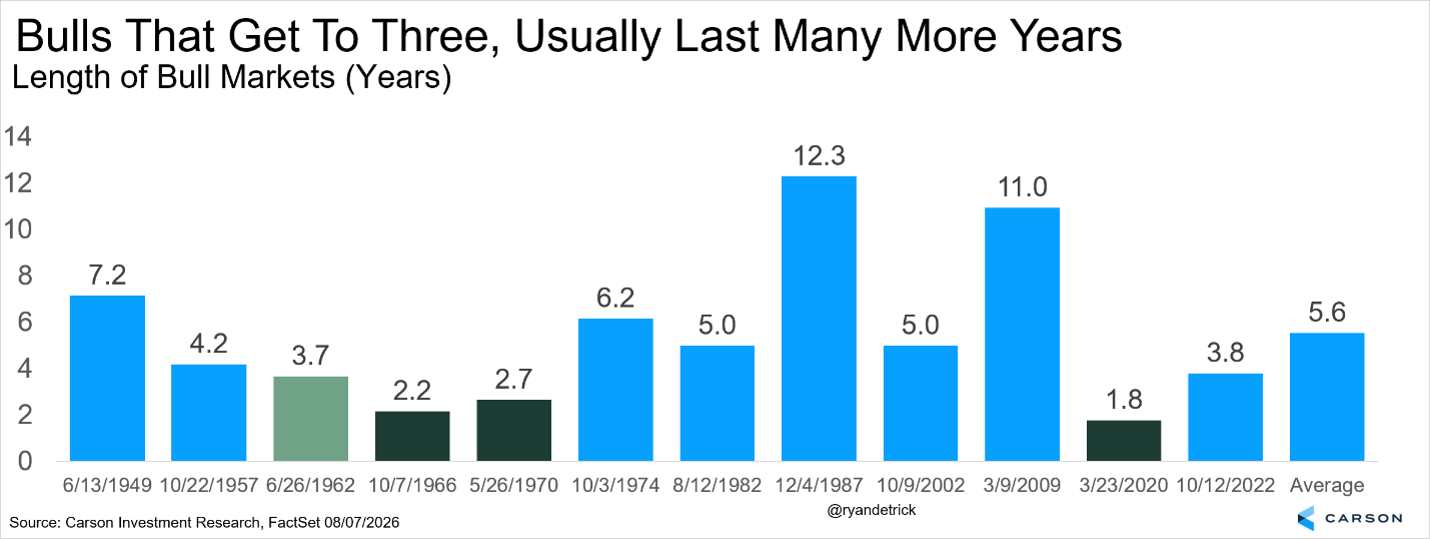
With the S&P 500 back at new highs, the bull market is officially 3.8 years old (it’ll turn four in October). As we’ve noted many times (most recently in our Midyear Outlook: Still Riding the Wave), bull markets have historically tended to last much longer than many investors think.
Go read that quote at the top again, as I’ve been saying it for years now. In fact, once a bull market has made it to its third birthday, there could be many more years of gains. You have to go back to the 1960s to find the last bull market that made it to three years old but didn’t make it to four. More recently? Over the past 50 years, five bull markets made it past year three, and every single one of them made it to at least year five. While that’s a small sample, this bull market very well could continue to frustrate the bears for much longer.
Thanks so much for reading what our team has to say, and here’s to the bull market continuing the rest of 2026. Be sure to watch our latest Glass Half Full, as we discuss why this bull market is alive and well.
For more content by Ryan Detrick, Chief Market Strategist, click here.
9069770.1. – 11AUG26A