Inflation has been a big story recently, especially after the U.S.-Iran war started. We’ve pointed out that inflation was a growing problem even prior to the war and isn’t limited to an energy shock. Yet, the energy shock and higher pump prices are how inflation has been most salient for households. There was a school of thought that this would crimp consumer spending, or what economists call consumption. We didn’t think so, and the most recent consumption data bears that out.
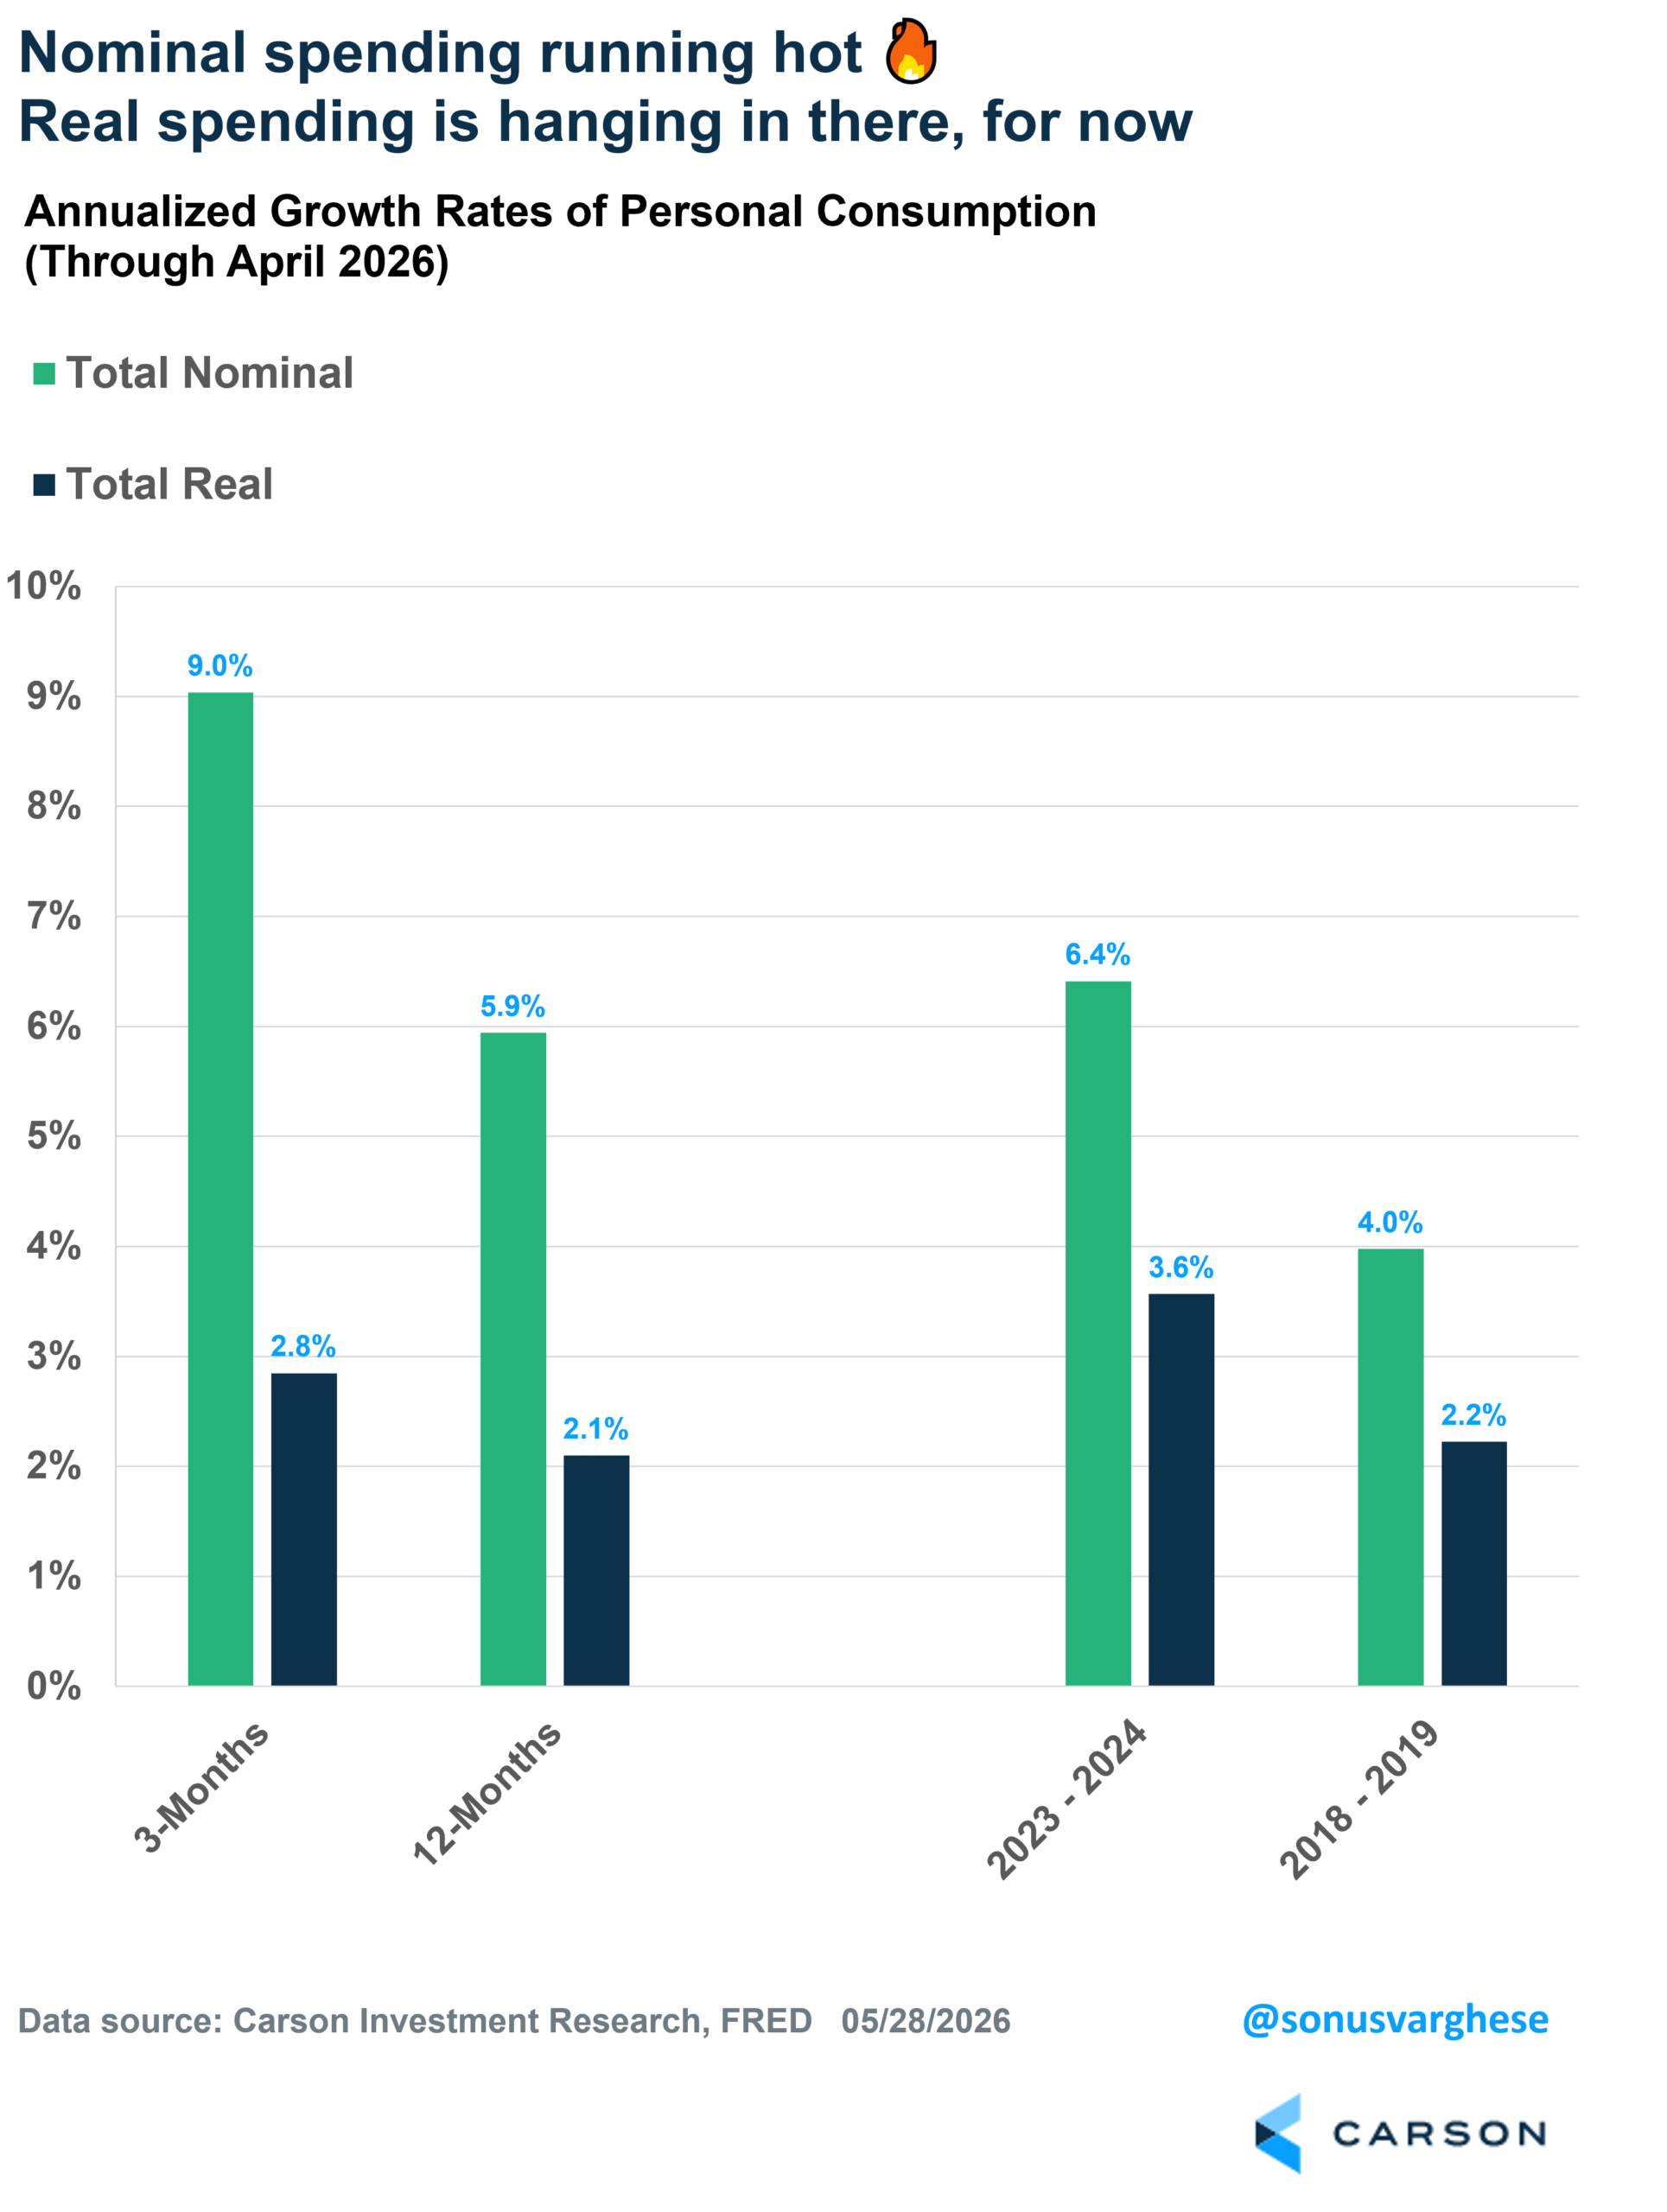
There’s no slowdown in consumption, not even close. Consumer spending rose at an annualized pace of 9% over the last three months. If you’re surprised by strong corporate revenue and profit numbers, look no further. How do you think companies will do if consumer spending is running at this pace! Consumer spending is now up 5.9% from a year ago, not far from the 2023-2024 pace of 6.4% and above the pre-pandemic (2018-2019) pace of 4.0%.
Here’s the catch: all this is nominal data, i.e., not adjusted for inflation. Spending looks more benign once you adjust for inflation. A couple of examples here:
- Gasoline and other fuel sales rose at a whopping 167% annualized pace over the last three months, but once you adjust for inflation, that number falls to -5%. In other words, consumers spent a lot more at the pump but bought fewer gallons of gasoline and diesel.
- Grocery store sales (excluding alcohol) rose at a 2.7% annualized pace over the last three months, but it’s flat once you adjust for inflation. People spent more on groceries but didn’t increase the amount of stuff they buy.
Coming back to the aggregate story, nominal consumption rose at an annualized pace of 6.3% in April, but once you adjust for inflation, “real” consumption rose just 1.3%. That’s weak but one-month readings can be noisy, and it helps to look at the broader picture.
As I noted at the top, nominal consumption grew at an annualized pace of 9% over the past three months, but prices were up 6% over this period using PCE inflation, the Fed’s preferred measure. After adjusting for inflation, real spending rose 2.8% and is up 2.1% over the past year. While that is a big drop-off from the strong 3.6% pace we saw in 2023-2024, it’s comparable to the pre-pandemic pace of 2.2%.
One big driver of strong sales over the last three months (actually February-March) was a rebound in auto sales, which had pulled back significantly at the end of 2025. We may not see such a strong pace going forward, but it’s still notable that sales rebounded. It tells you that consumers are still able to make big-ticket purchases. Consumers aren’t really pulling back their volume of purchases despite higher inflation. They’re increasing the quantity of goods and services consumed at a steady rate, but are also resigned to paying higher prices for these items. Of course, that’s a big benefit to the company’s top and bottom lines.
The real question is how consumers are funding their consumption.
Real Incomes Are Falling Amid Higher Inflation
As I’ve highlighted quite often over the last three years, the economy has been doing well because aggregate income growth (income growth of all households) has been strong, powering consumption. However, personal income growth has been easing since 2025, and elevated inflation means real income growth is weak.
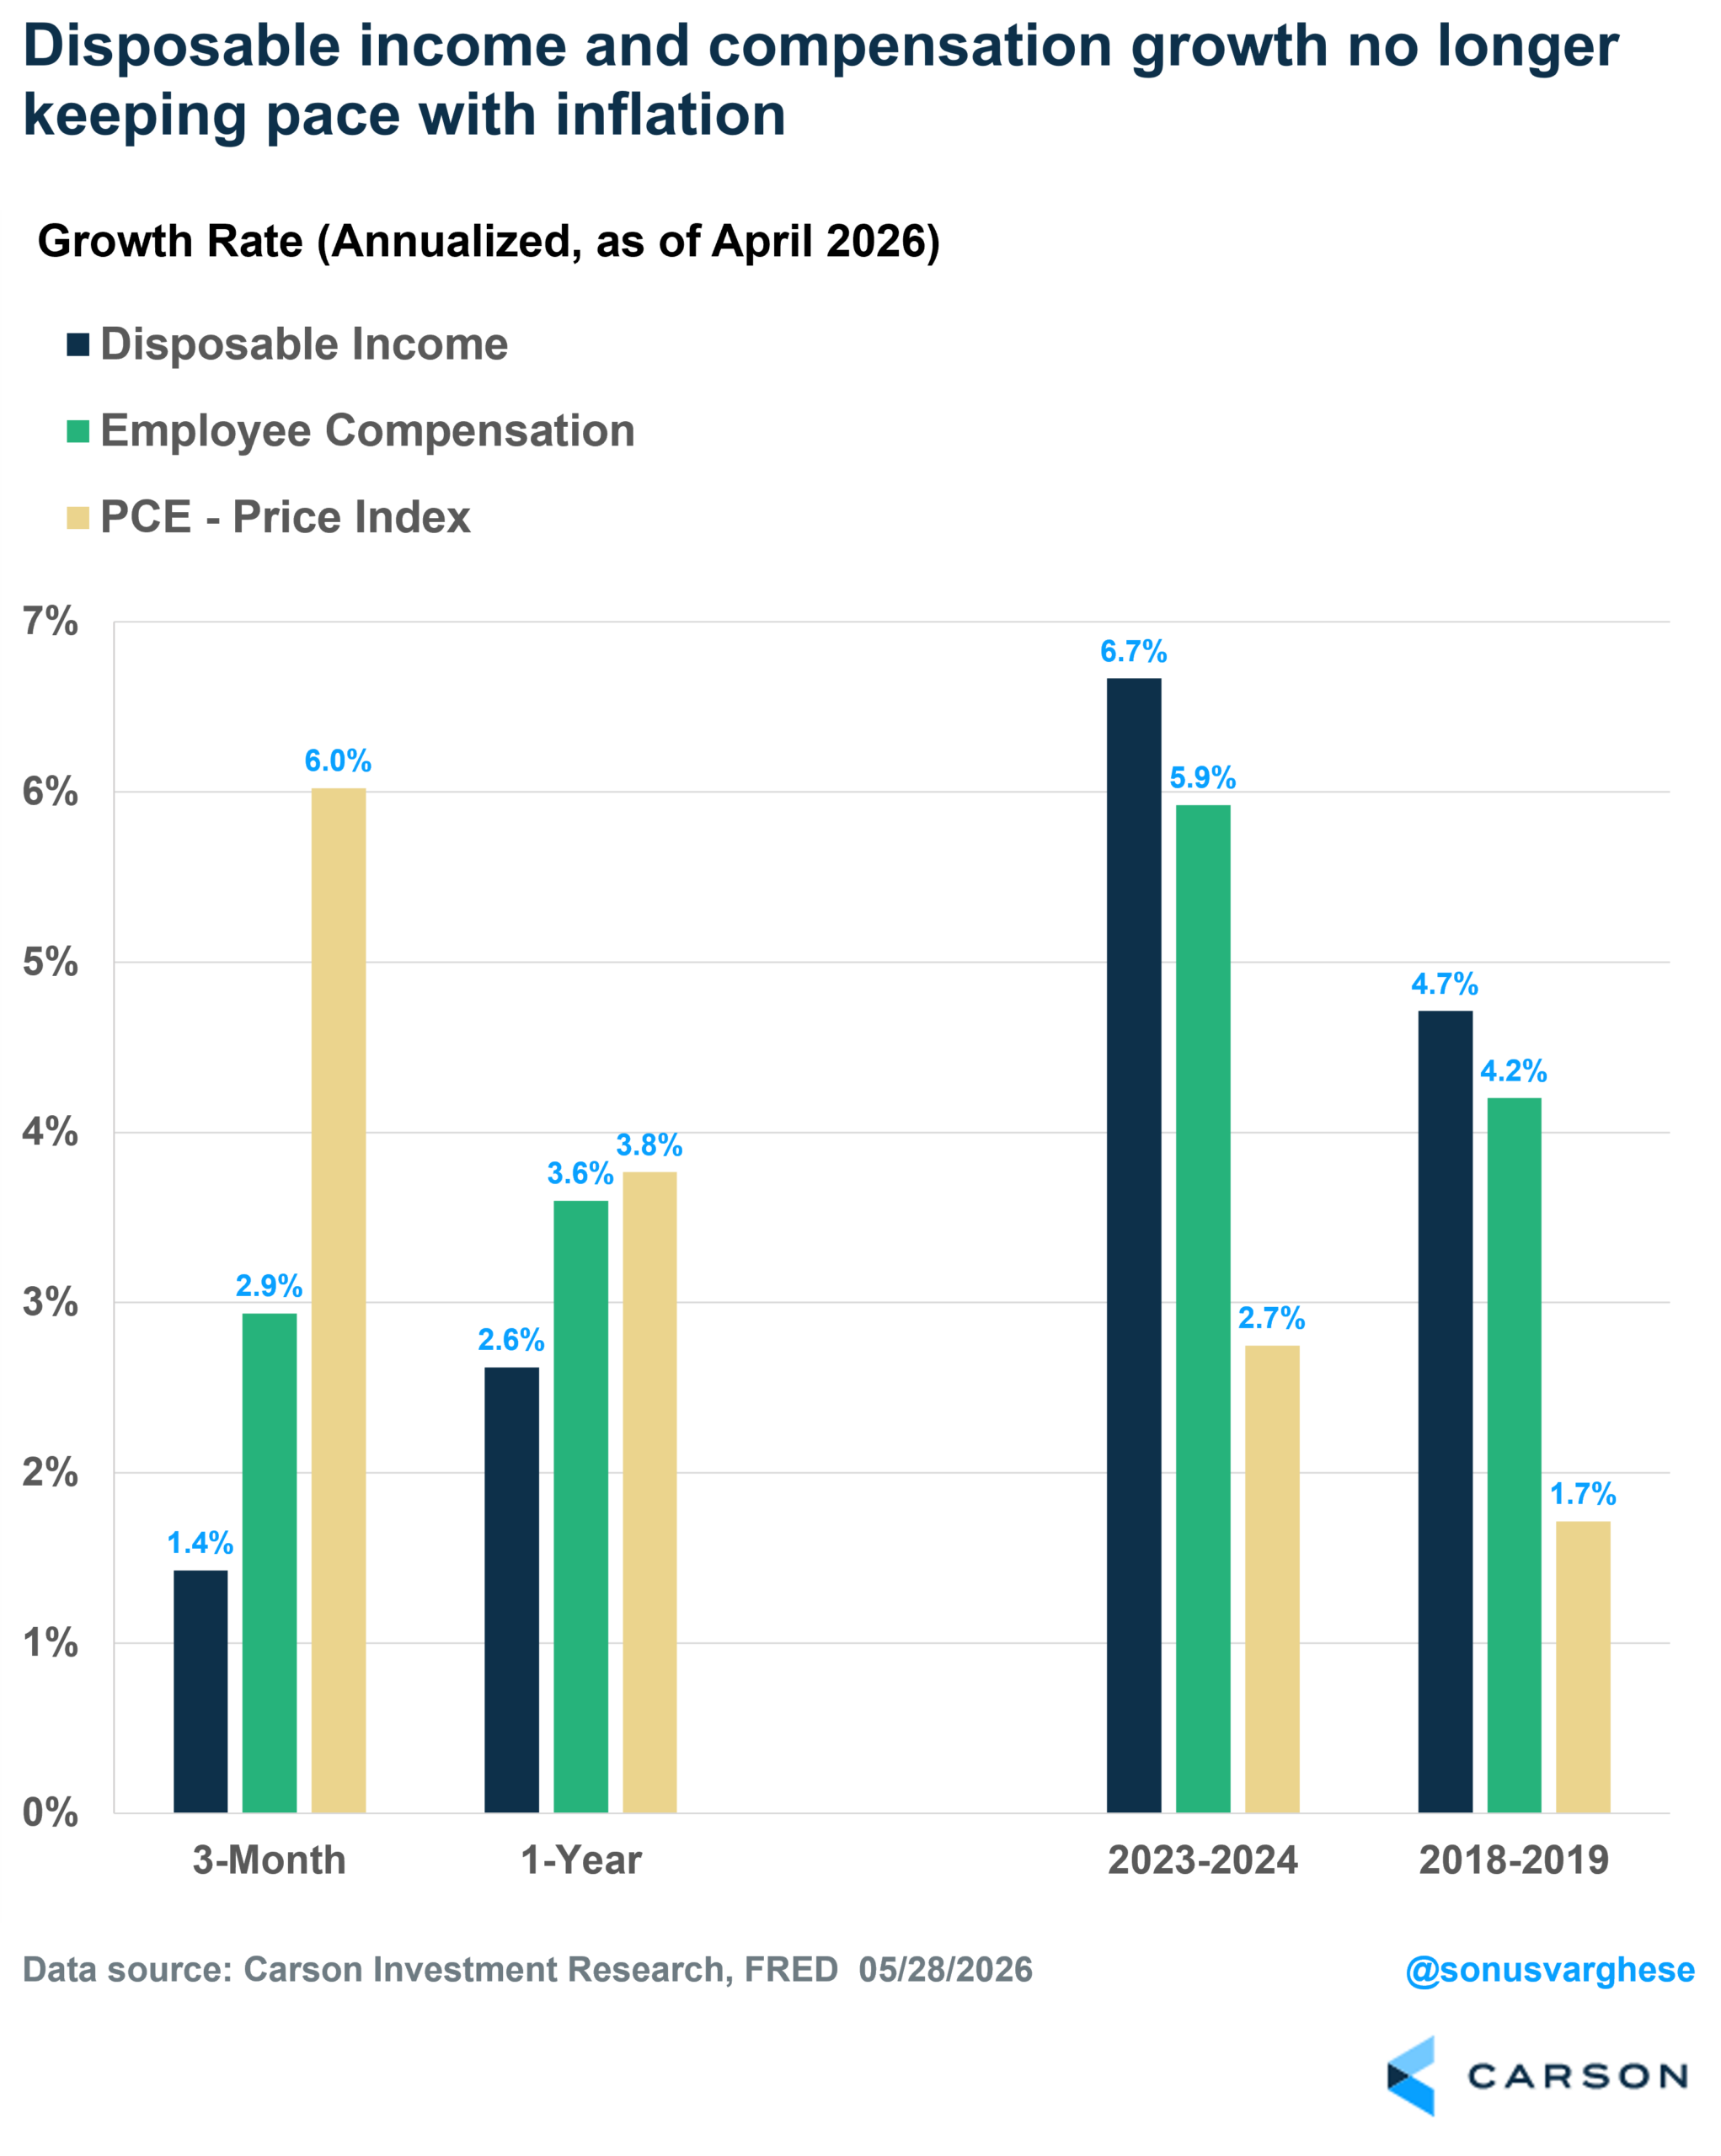
Disposable income, which is aggregate after-tax income, is up a paltry 1.4% annualized over the past three months, and it’s up only 2.6% over the past year. For perspective, the 2023-2024 pace was 6.7% while the 2018-2019 pace was 4.7%.
Disposable income can be impacted by idiosyncratic items like farm incomes (which can be volatile depending on the inflow of government assistance) and government transfer payments (like Social Security, Medicare, and Medicaid). It helps to isolate the largest component within disposable income: employee compensation, i.e. compensation across all workers in the economy. Compensation rose at an annualized pace of 2.9% over the last three months and is up 3.6% over the past year, well off the 5.9% pace we saw in 2023-2024 and 4.2% pace in 2018-2019.

Stay on Top of Market Trends
The Carson Investment Research newsletter offers up-to-date market news, analysis and insights. Subscribe today!
"*" indicates required fields
The problem is twofold: 1) Income growth is slowing, and 2) all the numbers above are in nominal terms, and things look worse once you account for inflation.
Inflation ran at a slightly slower pace in 2023-2024, and on top of that, disposable income and compensation growth ran well ahead of that, which means real income growth was strong in those two years. Income growth in 2018-2019 wasn’t as strong, but inflation was even lower, and so real income growth was relatively strong back then too. That dynamic has now completely reversed over the past year – income growth is slowing, and hotter inflation means there’s even more downward pressure on real income growth. As you see in the chart below, the yellow bars (inflation) are now taller than blue and green bars.
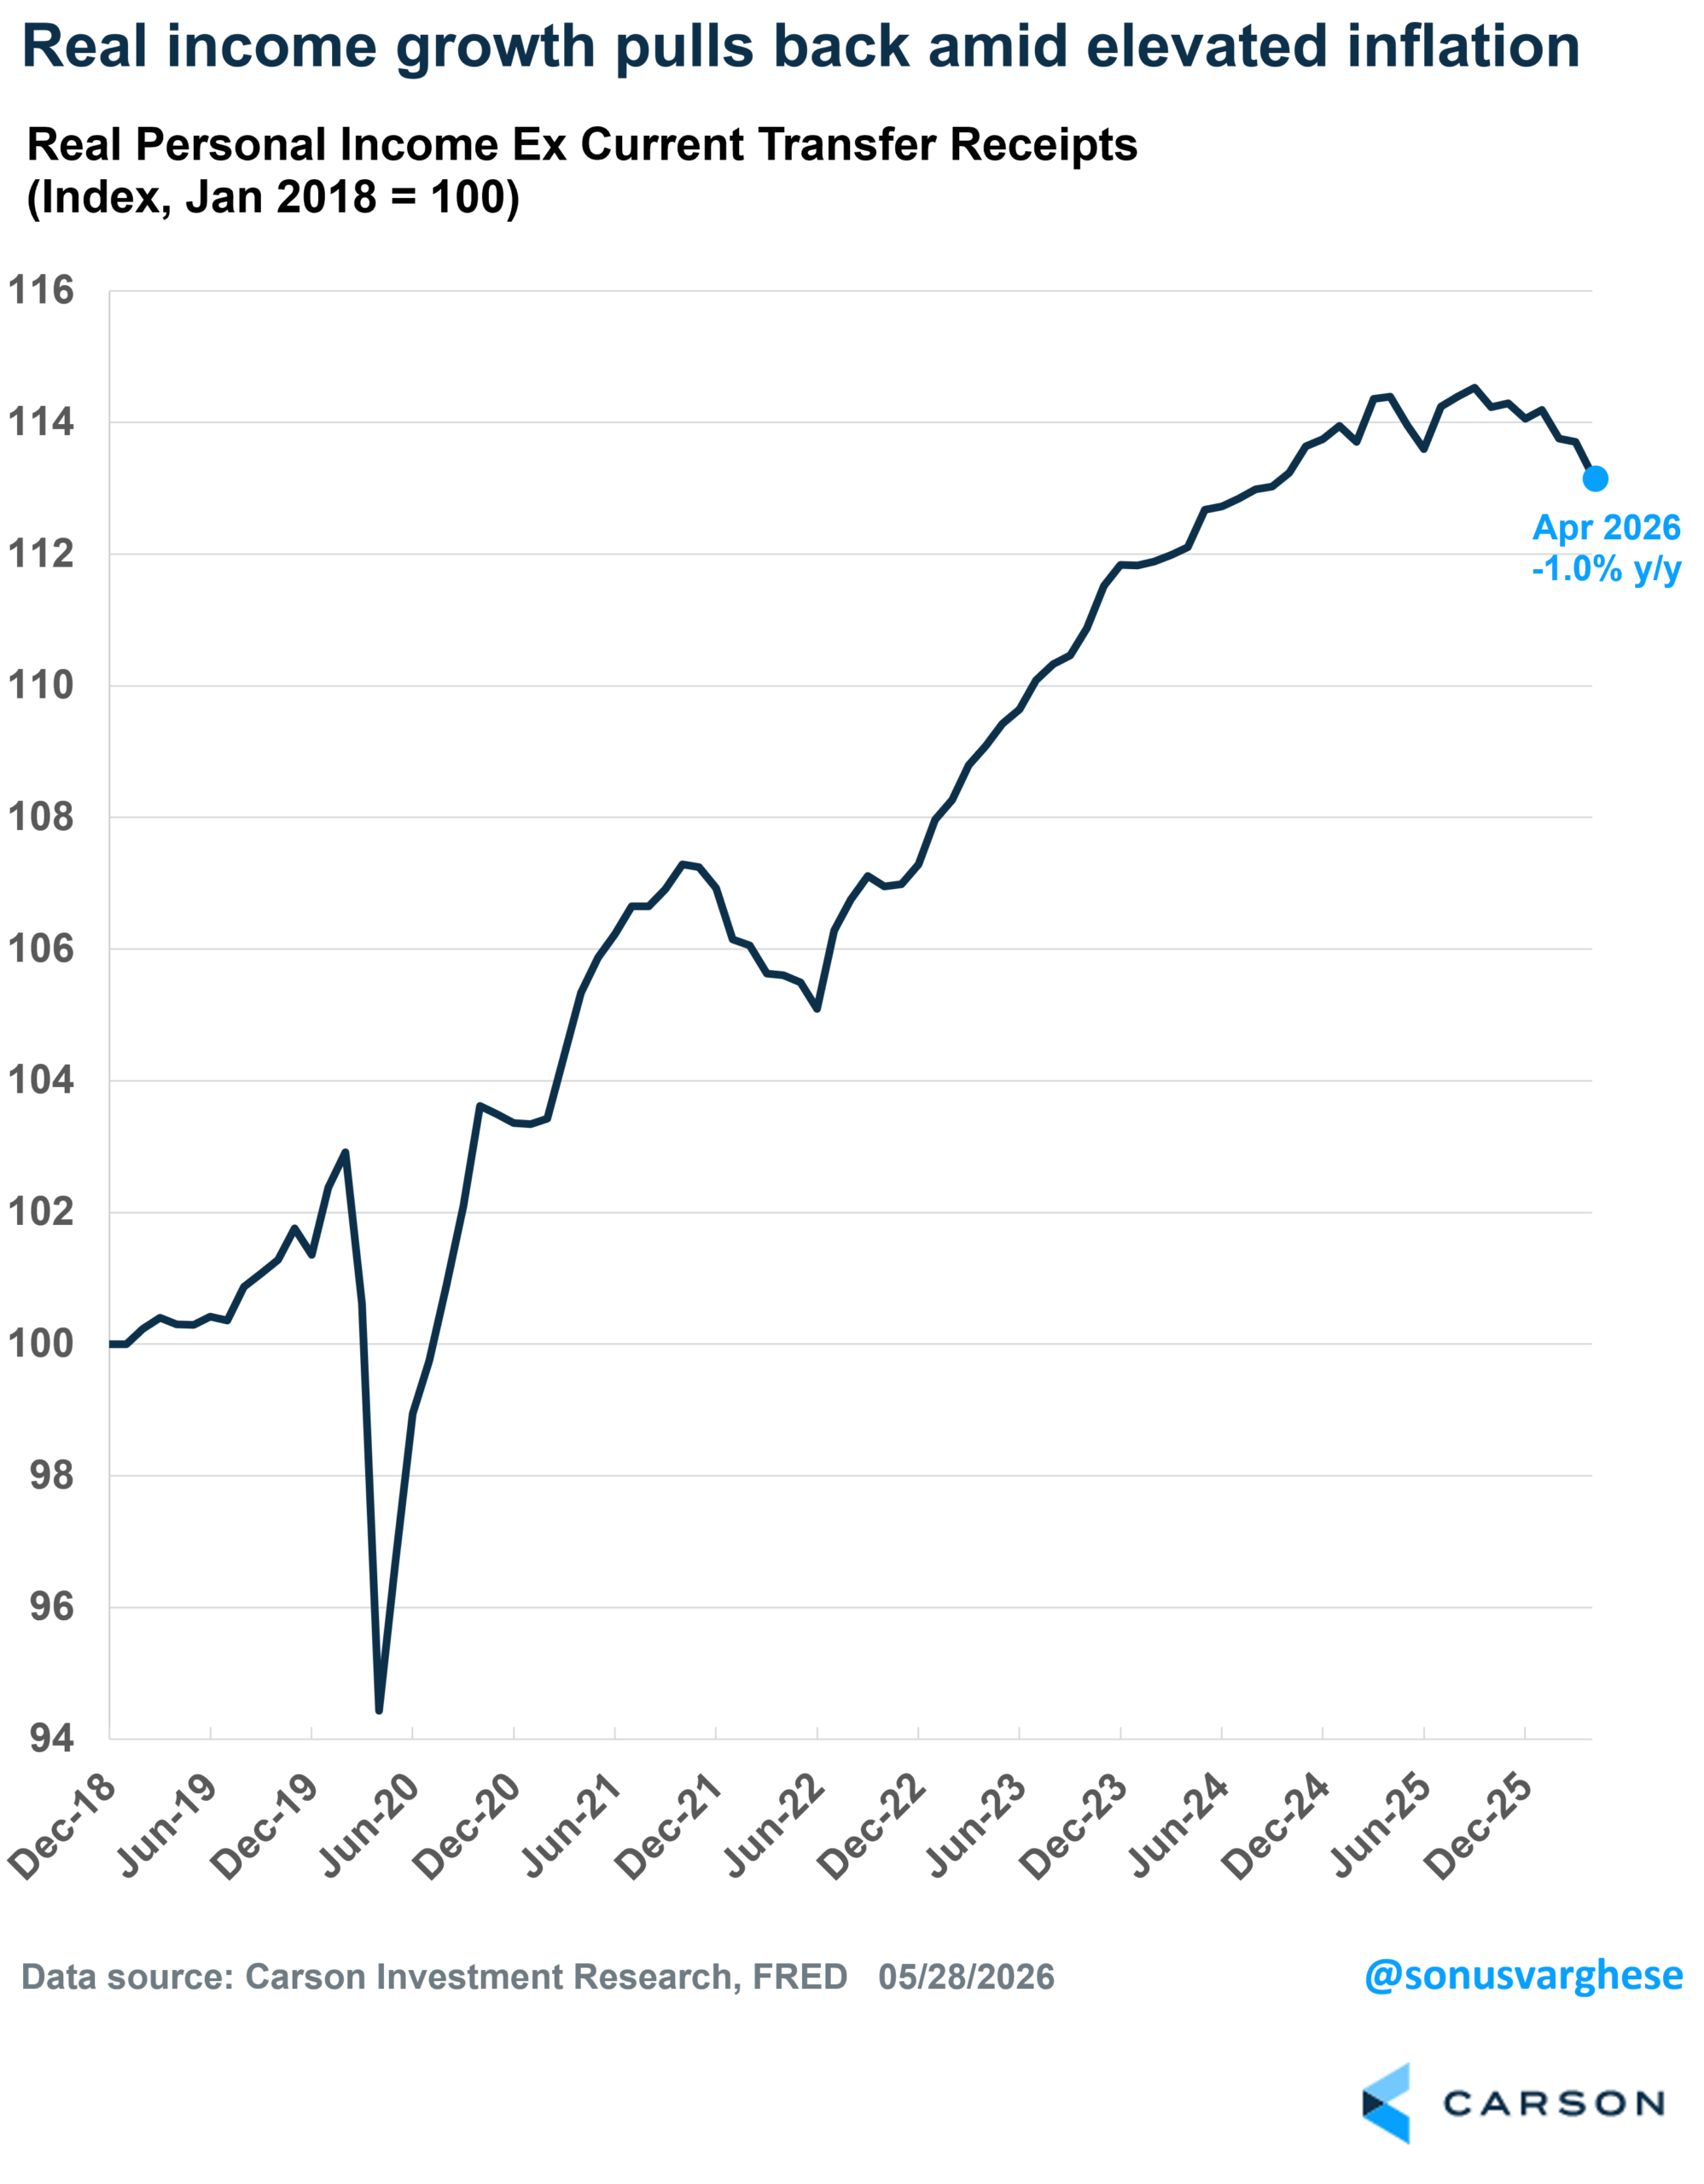
If you look at real personal income excluding government transfers, it slowed to a crawl in 2025 and is now in a clear downtrend. It fell 3.4% (annualized) over the last three months as inflation strengthened and is down 1.0% over the last 12 months.
- Compare that to a 3% annual pace in 2023-2024.
- Over the entire 2020-2024 period, real incomes ex transfers grew at a 2.3% annualized pace
The current pullback in real incomes is starting to look like the pullback in the first half of 2022, when it fell at an annualized pace of 3.4%. That was also because inflation was picking up.
So, What’s Funding Consumption?
Nominal consumption is running hot, and even after adjusting for inflation, spending is quite steady. However, real income growth is falling, and that begs the question of how households are funding consumption. There are a couple of answers:
- Tax refunds
- They’re saving a lot less.
The tax refund impact is obviously temporary, and so let’s focus on the second one: the declining savings rates.
The savings rate has collapsed over the past year, from 5.5% a year ago to 2.6% now. The savings rate is now close to the lowest levels we’ve seen over the last 30 years, including the 2005-2007 period and 2022. This “savings rate” is the difference between income and consumption outlays, expressed as a percent of disposable income. Think of it as the aggregate amount of income that was not spent on consumption (as a percent of disposable income).
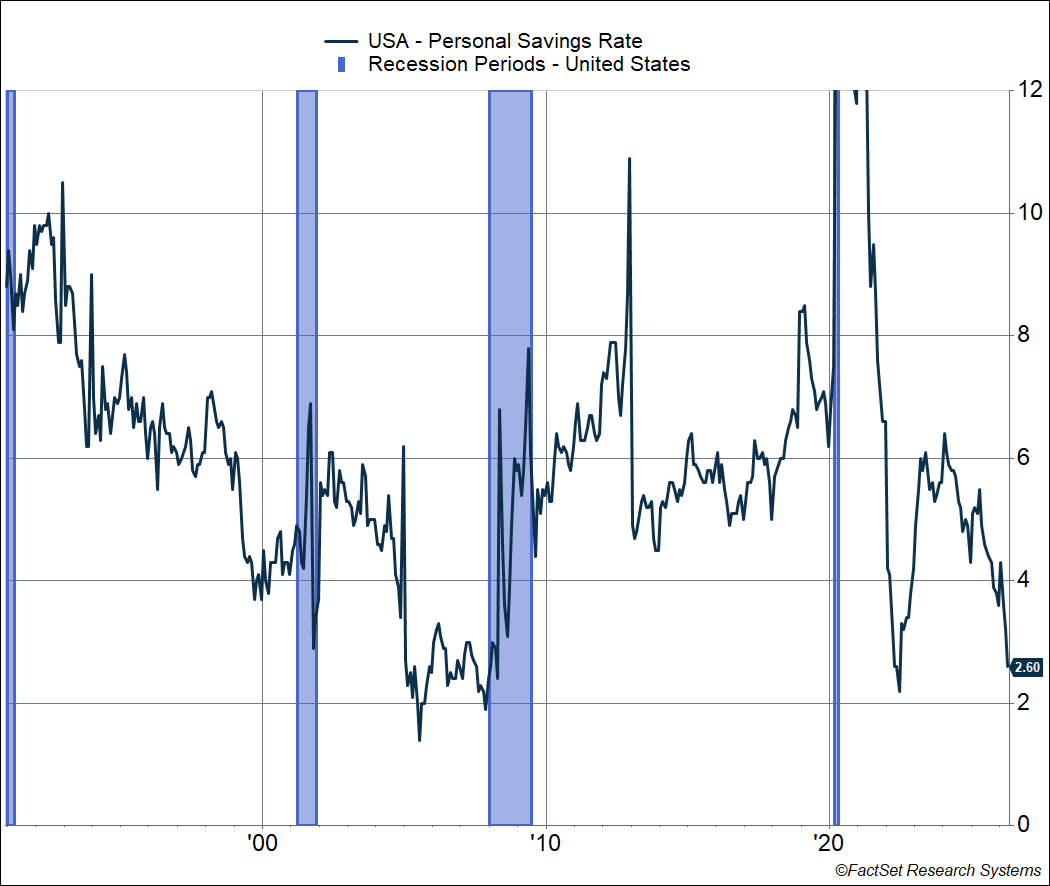
By itself, a falling savings rate is not too worrying. I’d say low real wage growth is the real worry (and elevated inflation more than anything else).
Savings rates tend to go down during economic expansions and when consumers “feel wealthy,” for example, when the stock market goes up and increases household wealth. We saw a similar dynamic in 1998-1999, when the savings rate collapsed from 7% to about 3.5%. Even in 2005-2007, home prices were rising and so that “wealth effect” likely led to very low savings rates.
It’s usually when the economy slows down, or there’s a recession, that the savings rate goes up, as households pull back on spending. The 2010s was bit of an anomaly here because the savings rate rose across the decade, from 5.3% at the end of 2009 to 6.9% in 2019. That’s because households were trying to rebuild their balance sheets after the housing bubble burst and stocks crashed in 2008-2009.
The current drop in savings rates is clearly a response to higher inflation, as in 2022. Back in 2022, consumers drew down their “stock” of excess savings (from lower spending during Covid and stimulus checks). Right now, consumers clearly feel they can “afford” to save less because of stronger household balance sheets (thanks to higher stock prices and home prices), which is why they’re not pulling back on volumes.
Of course, this does raise the risk that a decline in asset prices, whether home prices and/or stock prices, can reverse the wealth effect and lead to lower consumption. That may lead to lower business revenues and profits, resulting in a cycle of layoffs and higher unemployment. In turn, that would lead to lower aggregate income growth and consumption. That’s the negative feedback loop that ultimately results in a recession.
The economy and the stock market may now be more closely tied at the hip than we think, and that’s even without getting into the impact of AI on both the economy and markets.
For more content by Sonu Varghese, Chief Macro Strategist, click here.
8952457.1. – 29MAY26A