
I write about valuations quite a bit (born and raised in Buffett’s backyard after all), but outside of our industry it is rare that valuations are mentioned at a market or index level. Typically, when valuations do come up, it is for the wrong reasons – because they are high. We are seeing more and more valuation-focused comments today as the market continues to charge higher. As we have also written about many times, as long as that charge higher is met with growing earnings, then valuations stay in check, and the runway for future returns remains long. Historically, I’ve written about relative valuations – i.e., how cheap or expensive asset classes or sectors are relative to the overall market. This assumes investors are not using valuations to be in or out of the market (which they should not do), but today we want to look at one measure of absolute valuations that has garnered concern in some areas of the market.
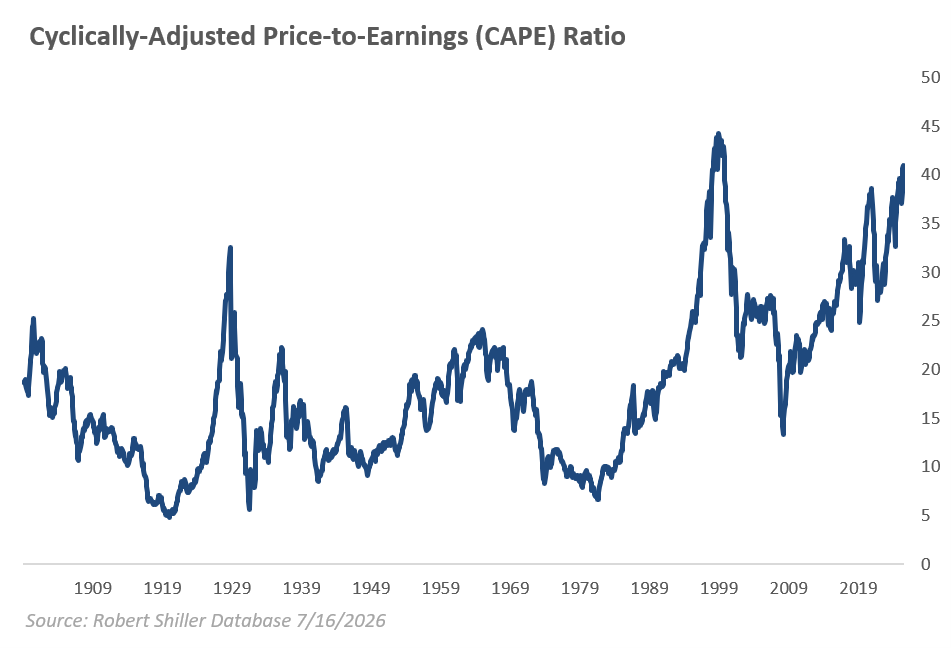
Robert Shiller created the CAPE, or PE10, ratio and was awarded a Nobel Prize for “empirical analysis of asset prices,” which included the predictability of this CAPE ratio. This metric is an adjustment of the standard price-to-earnings ratio that is widely looked at. CAPE divides the current inflation-adjusted price of the S&P 500 by the past 10-years of average inflation-adjusted earnings to arrive at what is intended to be a “smoother” average than a standard trailing 12- or forward 12-month earnings number. Shiller’s work was based on the predictability of this ratio for market returns 10-years forward. While that is good in theory, 10-years is a long time in the market, and not something that should impact anyone’s willingness to invest. No valuation methodology is perfect, and CAPE is far from it (doesn’t account for earnings growth or the discount rate, can be artificially inflated or depressed by write-downs, the mean-reverting average keeps going higher, etc.), but let’s dive into what high valuations can mean going forward and what investors should (or should not) do about it.
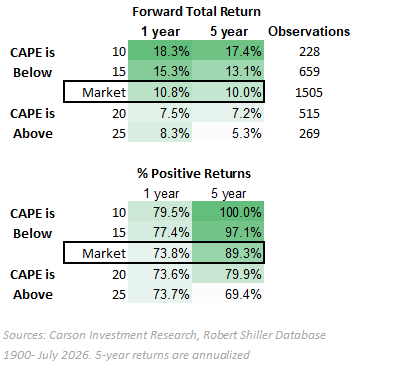
Looking at history (back to 1900), it is no surprise that a low CAPE ratio implies higher forward returns, and vice versa. If it didn’t, no one would be looking at this ratio! However, there are many things to glean from these numbers as displayed below. First is the middle line – the market returns over rolling 1- and 5-year periods – always a good reminder that a 10% return that is positive more than 90% of the time over 5-year periods is something we all benefit from. The concern comes in when valuations (as measured by CAPE) are elevated. Periods above a ratio of 20 and also above 25 see lower expected returns going forward – but not that much lower. A 7% annualized return over 5 years is still a cumulative return of over 40%, and returns are positive over the next year and 5 years nearly three-fourths of the time. Those numbers are simply too positive to ignore, and definitely not worth missing by being out of the market. And of course, this is just for the S&P 500 – typically when valuations get elevated in one asset class, market leadership rotates.
What about all-time highs? If you take the CAPE ratio back to 1900 and then look at the numbers at each new all-time CAPE high, forward 1-year returns are remarkably still positive nearly 72% of the time (with a 7% average)! As you stretch that over 5 years, returns do diminish, but in just 32 observations of the CAPE at all-time highs, forward returns are still positive over 3-5 years 40% of the time. Today’s CAPE ratio is still below all-time highs. Sonu recently wrote about the tech bubble in detail, and it is a must-read.

Stay on Top of Market Trends
The Carson Investment Research newsletter offers up-to-date market news, analysis and insights. Subscribe today!
"*" indicates required fields
Valuations are high, so what do you do? You remain invested, but maybe take a second look at what you are invested in. We are always doing that in portfolios – balancing momentum, growth, valuations, and expectations of economic or policy impact across the positions we are invested in. Each has different time frames and considerations. The old saying always rings true – time in the market beats timing the market every time – just ask Warren.
For more content by Grant Engelbart, VP, Investment Strategy & Research, click here.
9039868.1. – 23JULY26A