
The smell of fresh-cut grass. The crack of a bat. The entirely unjustifiable $14 hot dog you talked yourself into before the third inning even started.
Opening Day is here, and baseball is back.
For the baseball faithful, Opening Day is the single most optimistic day of the calendar year. Every team is tied for first place. Every fan base has a legitimate reason to believe. Every closer has yet to blow a save in the ninth. It is a season full of infinite possibility, which, if you think about it, sounds a lot like the way a well-constructed investment portfolio is supposed to feel at the start of a long time horizon.
We have made something of a tradition out of connecting the sports world to the financial one: from Super Bowl indicators to March Madness bracket correlations. So naturally, as 30 teams take the field today for the first game of the 2026 season, we could not resist asking the questions every serious investor is almost certainly wondering: Does it matter who wins the World Series? Does it matter how big the city is? And for the love of all things holy, does it even matter if your team wins on Opening Day?
Let’s play ball.
As always, the baseball correlations below are strictly for entertainment. Do not restructure your financial plan based on who hoisted the Commissioner’s Trophy last October. That said, if it gives you an extra reason to root for your team, we won’t stop you.
First Pitch: Does Opening Day Even Matter?
Let’s start right where we are: Today.
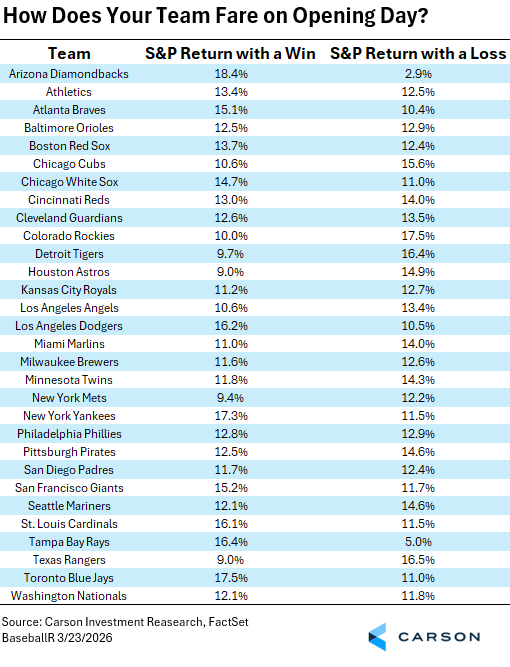
The results are all over the map, which is exactly what you would expect from a spurious correlation. But a few data points are worth calling out. The New York Yankees win Opening Day, and the market averages 17.3% that year. Lose it, and the average drops to 11.5%. The Tampa Bay Rays winning Opening Day correlates with a 16.4% market return, but a loss drops all the way to 5.0%, the most dramatic swing on the board. Meanwhile, the Colorado Rockies are the great contrarian: their Opening Day wins correlate with just 10.0% market returns, while their losses correlate with 17.5%. Rockies fans, consider rooting against your own team today purely as a financial strategy (which has been quite solid lately, considering they lost 119 games last year).
For our Kansas City Royals fans (myself), we have found that an Opening Day win has historically meant an 11.2% S&P return. A loss brings 12.7%. Essentially a coin flip, which honestly tracks with how Royals seasons tend to feel through about mid-May.
The real takeaway here is not which team to root for today. It is that one data point, one game, one day, one event, tells you almost nothing meaningful about what lies ahead. Sound familiar? It should. Investors make this mistake constantly, drawing sweeping conclusions from a single day’s market movement. One bad open does not make a bad year. One great earnings report does not make a great decade. Zoom out.
The League Divide
Now we move from today to last October, and the question of which league produces the World Series champion.
Since 1950, when a National League team has won the World Series, the S&P 500 has averaged 15.59% that year. When does an American League team win? The average is 10.13%.
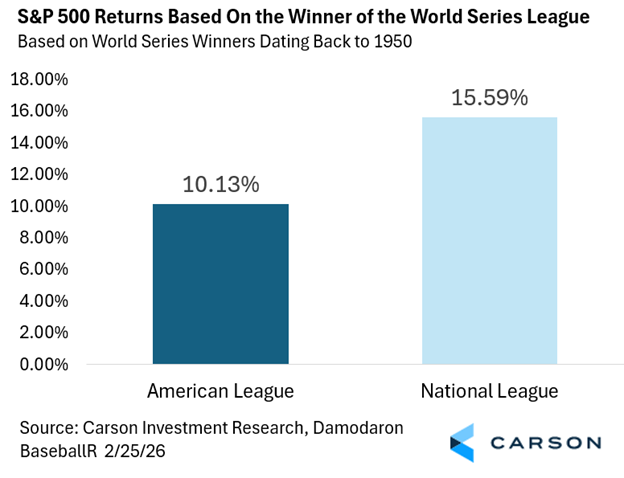
Both numbers are positive. Both are historically solid. The long-run average annual return of the S&P 500 hovers around 10%, so even the “underperforming” American League years have been, on balance, good years to be an investor. The National League result clears that bar by more than 5 percentage points, but again, this is a correlation with no causal mechanism whatsoever. The market does not know or care which league’s champion is taking a victory parade through their home city.
What the chart does reinforce is something worth remembering: even in “below average” environments, the market tends to reward patience. AL years still averaged 10%, which historically is nothing to complain about.
Your Team, Your Return
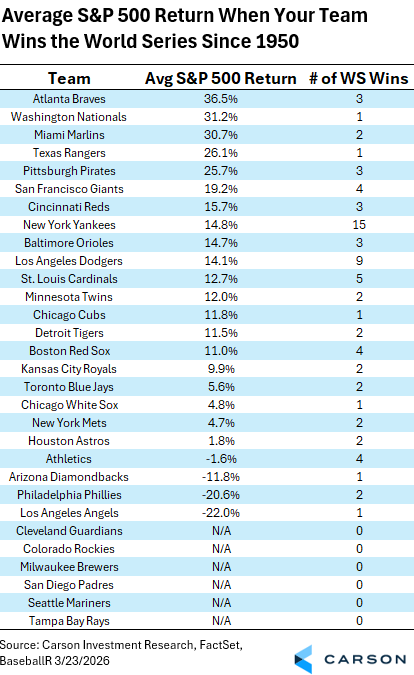
Shown in the chart above lists every franchise that has won at least one world series since 1950, listed in descending order by the average S&P 500 return in their corresponding championship seasons. Alongside this average is the amount of championship seasons each team has had in order to achieve this spuriously correlated return.
The Atlanta Braves lead the active franchises at 36.5% across three titles. The Washington Nationals (31.2%), Miami Marlins (30.7%), and Texas Rangers (26.1%) all follow, each with relatively few championships but the apparent good fortune of winning them in strong market years.
Then there is the New York Yankees with 15 World Series titles and a 14.8% average return. Not the top of the list, but remarkably consistent. That is what sustained excellence looks like: not the flashiest number on the board, but the most appearances and a reliably above-average outcome.
At the bottom sit the Los Angeles Angels (-22.0%), Philadelphia Phillies (-20.6%), and Arizona Diamondbacks (-11.8%). The Angels won in 2002, in the wreckage of the dot-com bust. The Phillies won in 2008, which just so happened to be during the Great Financial Crisis. Timing matters both in baseball and in markets, but you rarely get to choose it.
And for the teams with N/A in the return column (Cleveland Guardians, Colorado Rockies, Milwaukee Brewers, San Diego Padres, Seattle Mariners, and Tampa Bay Rays), zero World Series titles means zero data points. There is a reason patience is considered a virtue in both championship baseball and long-term investing. Maybe this is their year!
Does Market Size Matter?
We grouped World Series champions by the size of their home market: large, medium, and small, and looked at the average S&P 500 return in those championship years.
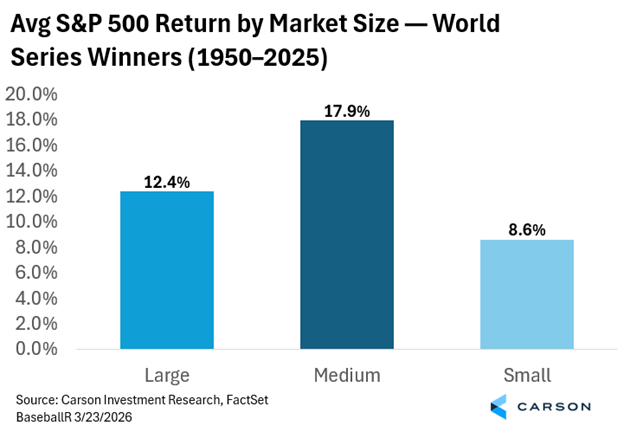
The results: Medium-market champions correlate with the strongest average return at 17.9%, large-market teams come in at 12.4%, and small-market teams at 8.6%.
The investing parallel here is deliberate. Large-cap, big-name, household-brand stocks get all the attention, just like the Yankees and Dodgers dominate the back pages. But historically, the market has rewarded investors willing to look beyond the obvious names. Mid-cap stocks have a long track record of outperforming their large-cap counterparts over full market cycles, often because they fly under the radar long enough to compound quietly before the crowd arrives.
The Royals, for what it is worth, are a small-market team. But in 2015, they were the best team in baseball. The market does not always reward the team with the biggest payroll or the brightest spotlight, and neither do long-term returns.
Stay on Top of Market Trends
The Carson Investment Research newsletter offers up-to-date market news, analysis and insights. Subscribe today!
"*" indicates required fields
The Most Important Chart: Balance Wins Championships
Ask any baseball traditionalist what separates good teams from great ones, and the answer is never one thing. You cannot win a World Series with only home run hitters. You need pitching. You need defense. You need speed on the bases, situational hitting, a reliable bullpen, and a manager who knows when to push and when to hold. The greatest teams in baseball history: the 1927 Yankees, the 1976 Reds, the 2015 Royals (lol), were not built around one superstar skill. They were built around balance.
The same principle applies, with almost uncomfortable precision, to a well-constructed investment portfolio.
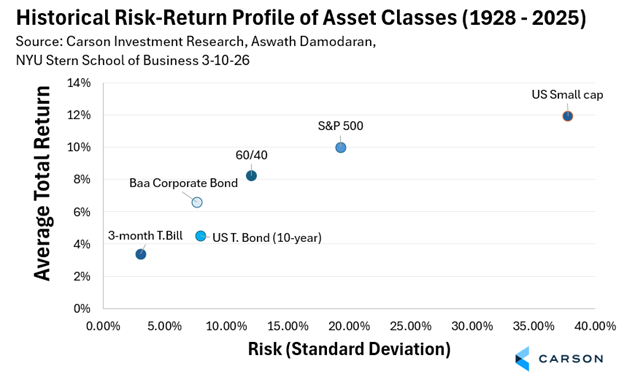
This chart plots the major asset classes by risk (standard deviation) on the x-axis and average total return on the y-axis, going back nearly a century to 1928. The story it tells is not complicated: more risk has historically delivered more return, but not infinitely so, and not linearly. A 3-month T-Bill carries almost no risk and delivers almost no return (3.4%). U.S. small-cap stocks are volatile but have historically returned around 11.9%. The S&P 500 is trading at roughly a 10% return with meaningful but manageable volatility. The 60/40 portfolio (which I talked more about here) delivers 8.3% with less volatility than a pure equity portfolio.
No single asset class dominates across all environments. In some years, bonds catch what equities miss. In others, small caps surge while large caps stall. The 60/40 may never be the flashiest line on the chart in any given year, but over a century of data, it has delivered strong risk-adjusted returns precisely because it is not betting everything on one skill set.
A team built entirely around the long ball is one cold streak away from elimination. A portfolio built entirely around one asset class is one rate cycle, one recession, or one geopolitical shock away from a very bad year. Balance is not boring. Balance is how you stay in the game long enough to win.
The Bottom Line
Baseball and investing share more than a few things in common. Both reward patience. Both punish panic. Both have a way of humbling the overconfident and vindicating the disciplined. And both look completely different at the end of a long season than they did on Opening Day.
The correlations in this piece are fun, they are real in the historical data, and they are entirely coincidental. The market does not know who won last night’s game. It does not care whether the AL or NL champion hoists the trophy in October. What it does, reliably, over long periods of time, is reward investors who stay invested, stay diversified, and resist the urge to make sweeping decisions based on a single day’s results.
So, enjoy today. Root loudly for your team. And remember, the season is 162 games long, and portfolios are built for time horizons far beyond that.
Play ball.
By Harry McDonald, Analyst, Investment Research
8843503.1. – 26MAR26A
