
March is synonymous with a “madness” in the air due to the NCAA tournament, which provides the country with a captivating energy that only comes once a year. The tournament is filled with underdog stories of schools and/or athletes, upsets that even the most calculated would not have predicted, and buzzer beaters that are heard across the country. While your bracket may be busted before Sir Charles Barkley lays his head on his pillow once the first round is completed, the market will continue to shake through its own forms of “madness.” Navigating the “under-seeded”, or more applicably stated as current driving forces for the market, is an important duality to maintain as you live or die with every basket for your school throughout the tournament.
Current Market “Madness”:
In the month that is the perfect embodiment for surviving and advancing, there are major themes in the market today that align with that same narrative. Amongst the noise, chaos, and overall “madness”, there are central themes that are important to understand regarding the current market behavior so far in 2026.
New Fed Chair (Selection Committee)
Every March, a group of 12 athletic directors who are led by a single chairman, act as the ultimate decision makers for which teams will compete in the tournament field. This committee doesn’t just pick the teams; they proceed to rank them from best to worst (seeding teams #1-16 to compete in four different sections of the bracket) based on the performance they have seen up to that point. When the bracket finally drops on Selection Sunday to the glorious tune by CBS playing in the background, the Chairman serves as the face of the operation, explaining the ‘why’ behind the board’s decisions on certain seeding of teams as well as the unfortunate exclusion of other universities that were deemed to not be one of the teams selected to compete in the tournament. If it does not jump out immediately, there is quite a parallel in the financial sector, that being the Chair of the Federal Reserve. Recently in late January, it was announced that Kevin Warsh, who previously served on the Fed Board from 2006-2011, would be replacing current chair Jerome Powell on May 16th.In the same sense of yesterday’s basketball holiday or otherwise deemed “Selection Sunday”, basketball fans and analysts alike can speculate at a high level how teams will directly be seeded in the tournament field. These same speculations can be made in the economy regarding interest rates, which can be relatively priced into the markets from general sentiment on whether the Federal Reserve will in fact raise or lower the interest rates. Although speculation and sentiment can be rather strong, for both basketball and economic examples by the masses alike, for interest rates the decision comes definitively to the board which will be led by a new guard this May.
AI CapEx- (NIL Spending for a Hopeful Return)
Similar to the current frenzy in college athletics surrounding NIL (Name, Image, and Likeness), where boosters and schools provide payments to athletes to try and capture championship success, there is large capex spending in the AI space by sector leaders. Many teams in the sport are trying to devote more capital each season to bring in higher level talent to supplement a changing landscape of the sport and college athletics. In the business world, and the market for our sense of viewpoint, the changing landscape that we all know is driven by the advancement of AI development sought after by companies, especially ones in the cloud-computing space. The chart below from our investment research team illustrates how sector leaders are ever increasing their AI-related capex spending from 2025’s total expenditures to their expected amount in 2026.
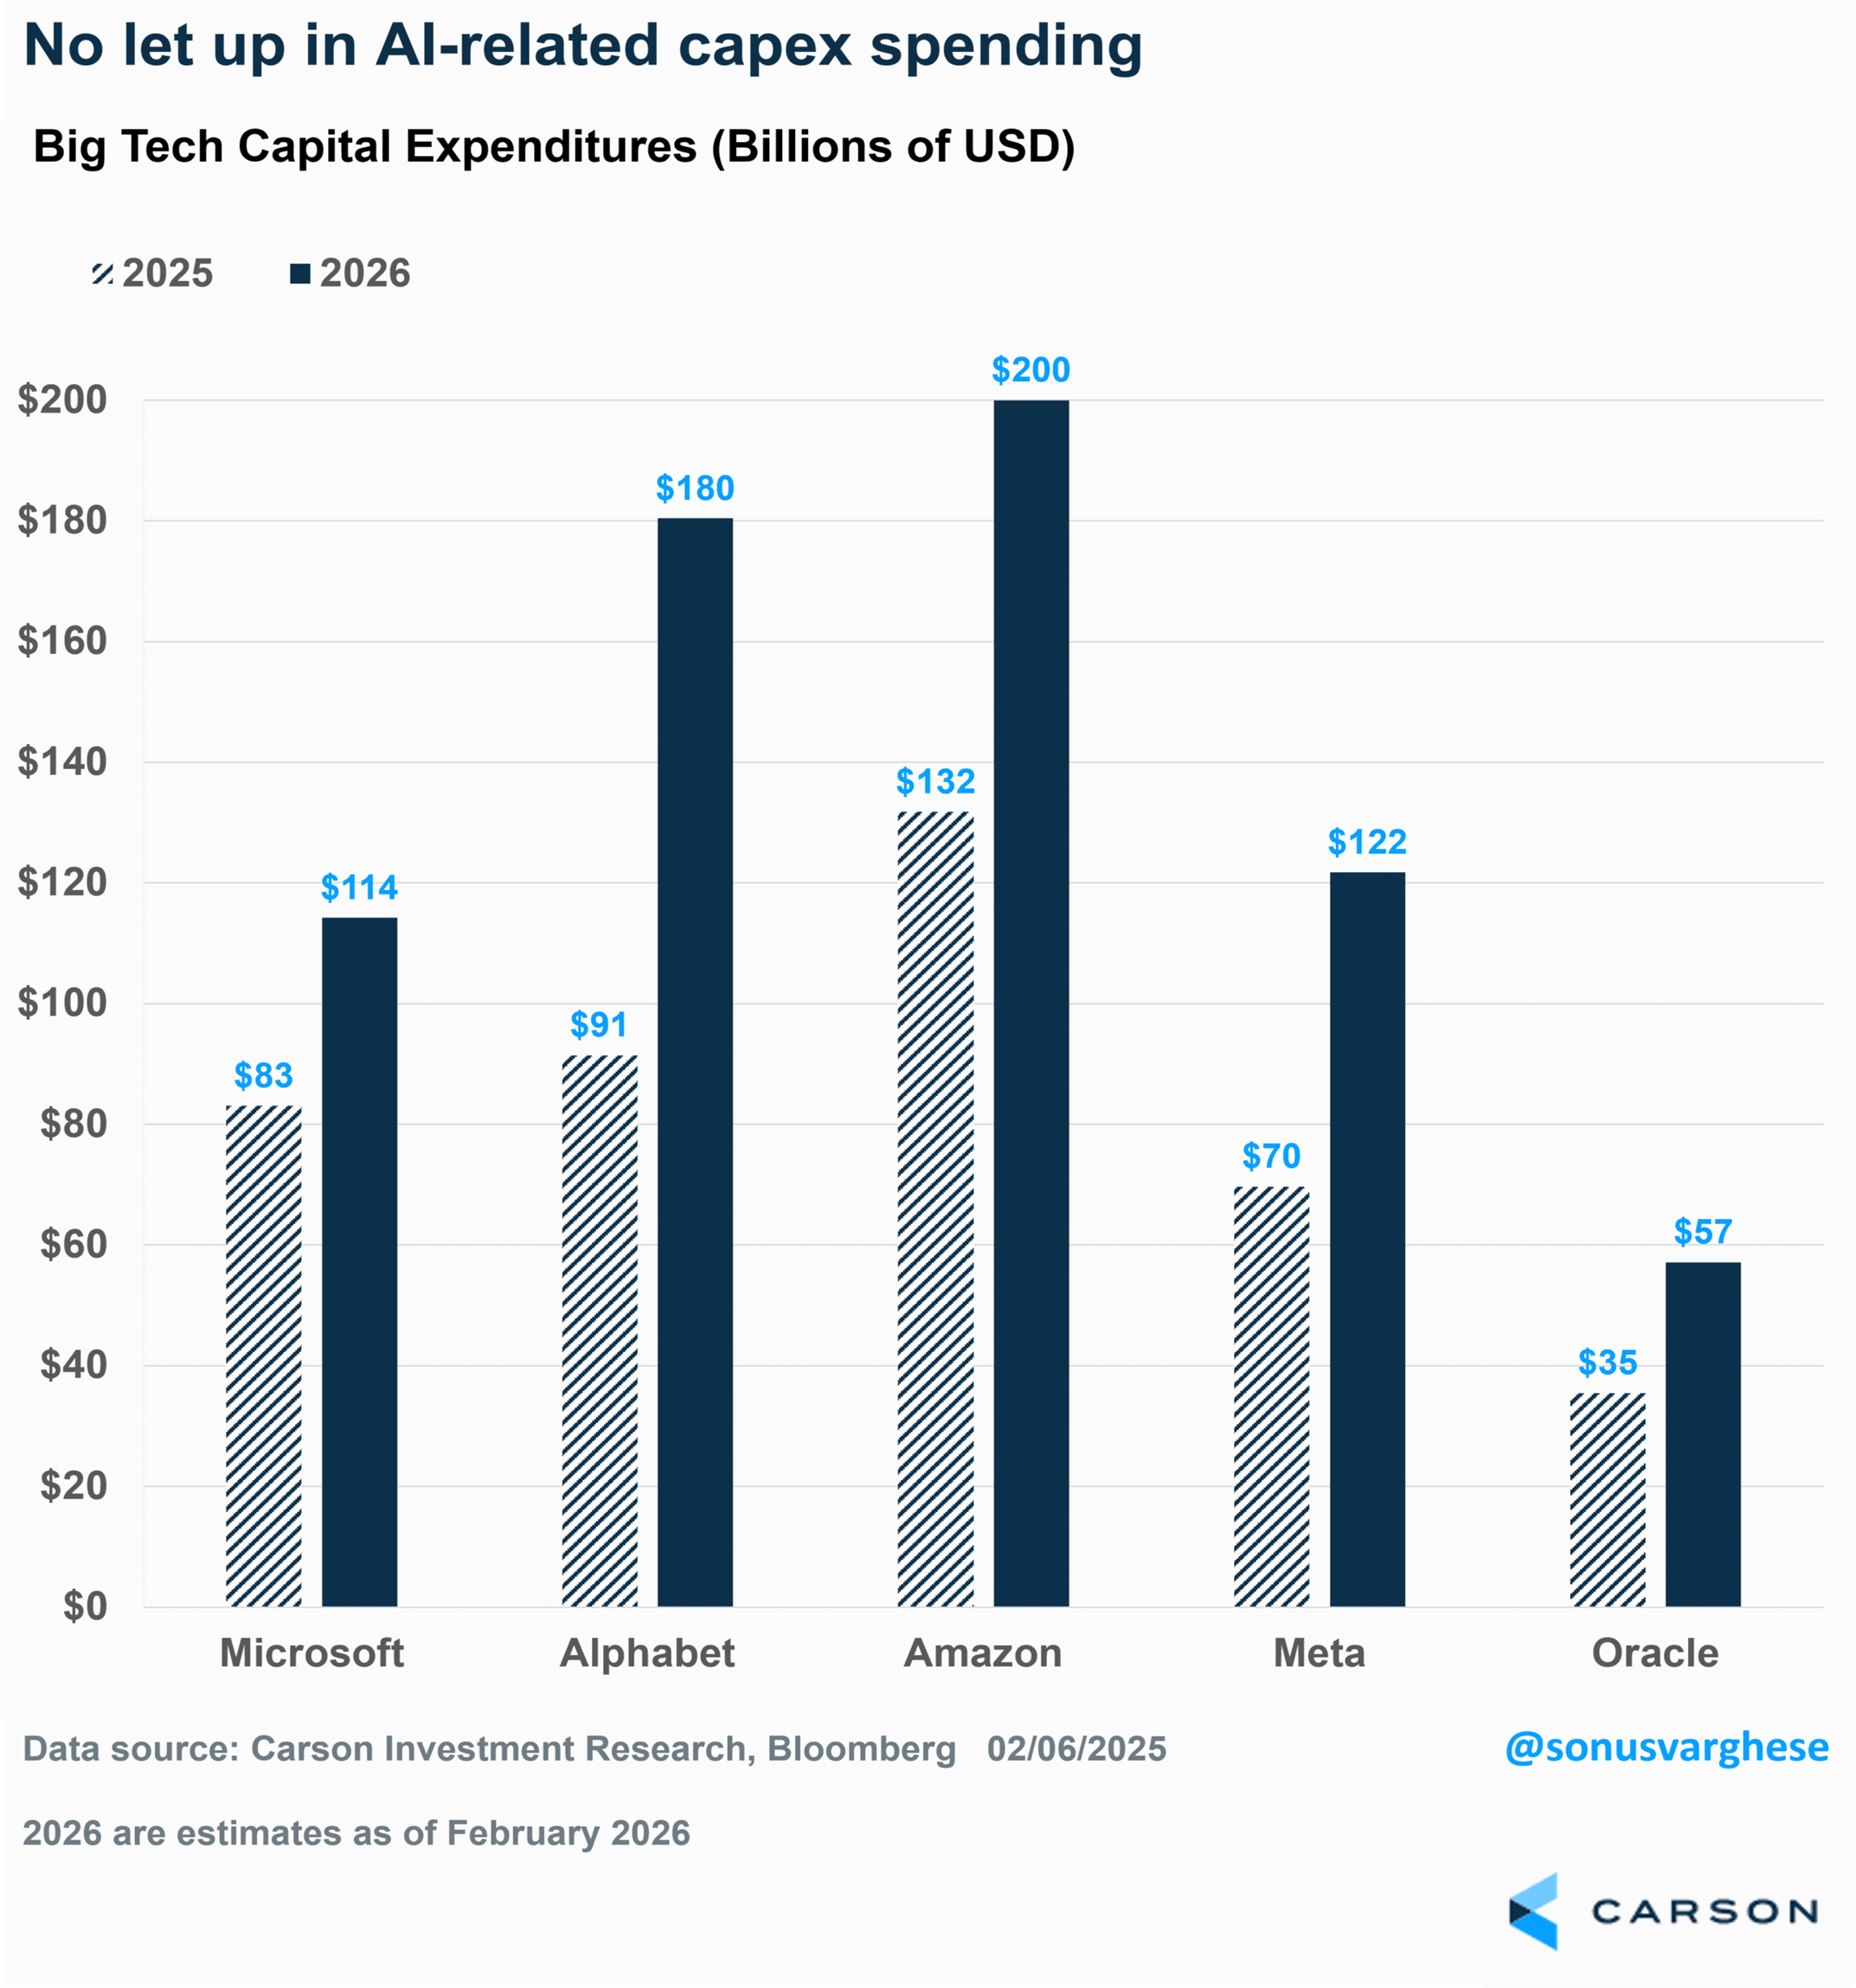
These companies have experienced a pullback in performance so far in 2026 amidst lowering sentiment. Further details surrounding Capex can be found in a recent writeup from our team’s own Sonu Varghese.
Stay on Top of Market Trends
The Carson Investment Research newsletter offers up-to-date market news, analysis and insights. Subscribe today!
"*" indicates required fields
Mag 7 – (Bracket Busters)
A theme that is demonstrated on seemingly an annual basis within the tournament is that even the proclaimed untouchable teams may falter in performance. As reliable and dominant as they may have historically been, no team is immune to a slip. In the current financial markets, the shocking slip of what would be a prior “dominant team” relates to the Mag 7 stocks, which have fallen in performance relative to the other 493 positions in the S&P 500. Acting as “bracket busters’ if I say so myself, the aggregate of the 493 (Ticker: XMAG) have returned a YTD performance of – 0.84%, which is obviously not a positive return but in comparison to its MAG7 counterparts (MAGS) which has a YTD performance of -9.10%.
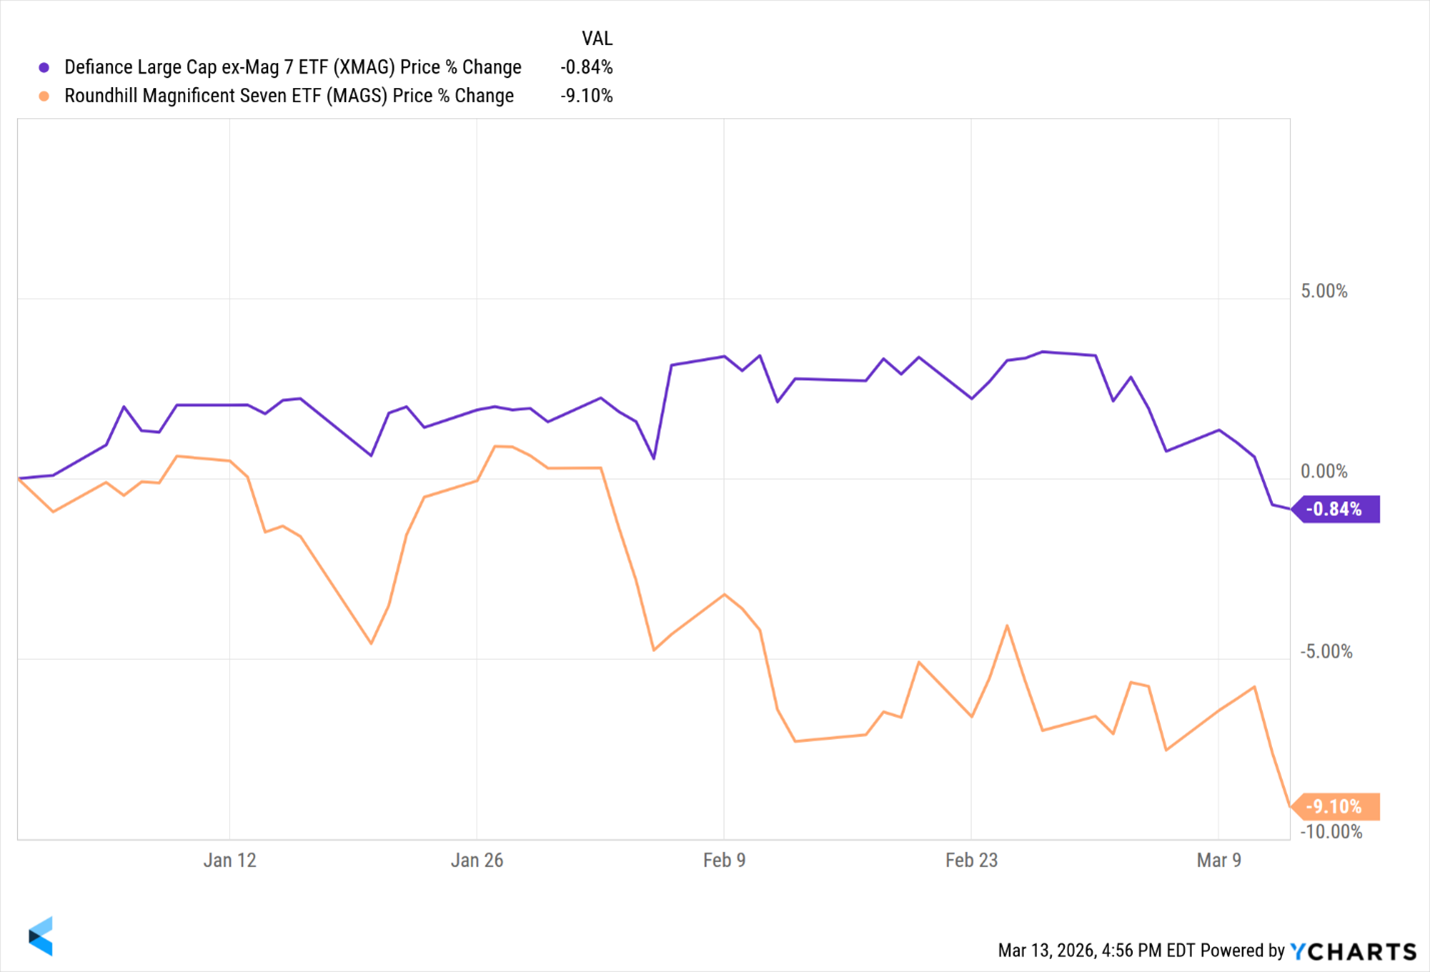
Given that it is March, upsets are too common an occurrence for us all to be too surprised by this notion. As we move through 2026, maintaining a keen eye on this breakdown will be highly beneficial in understanding the weighted performance of the S&P 500.
Who Do You Want to Cut Down the Nets?
- First and foremost: The following information is not intended as investment advice, do not invest or make investment decisions based on who wins this tournament or prior tournaments.
Recently, one of our team members Ryan Detrick gave his Super Bowl preview which highlighted how different outcomes spuriously correlated with the annual returns of the S&P 500. For those searching for a rooting interest in this year’s NCAA tournament without a current allegiance, I pulled similar prior S&P 500 annual return data and compared it with different champions and tournament stories to highlight more entertaining spurious correlations. The data is perfect for those of us who have already second-guessed every decision we have made so far while filling out our brackets. While the energy of the tournament may be intoxicating, these indicators are for enjoyment and are in no way intended as investment advice. With that addressed, the statistical coincidences of market performance with certain tournament outcomes may inspire prominent color commentators Dick Vitale and Bill Raftery to perhaps crack open a Wall Street Journal instead of the back pages of this year’s Missouri Valley Conference scouting report.
In the tournament, for die-hard basketball fans and casual enjoyers alike, a Cinderella run is an enthralling thrill that the country often unifies behind. For those who may be unfamiliar, a “Cinderella” run is when a team that would objectively be deemed as a “non-contender” on paper proves everyone wrong and keeps winning games against higher ranked opponents. These teams come in the form of having a double-digit seed making their journey more difficult, and when they make a deep run to the final four these underdogs often transform into coincidental bulls for the S&P 500. Shown below are the results of this uncommon, yet thrilling, statistical coincidence.
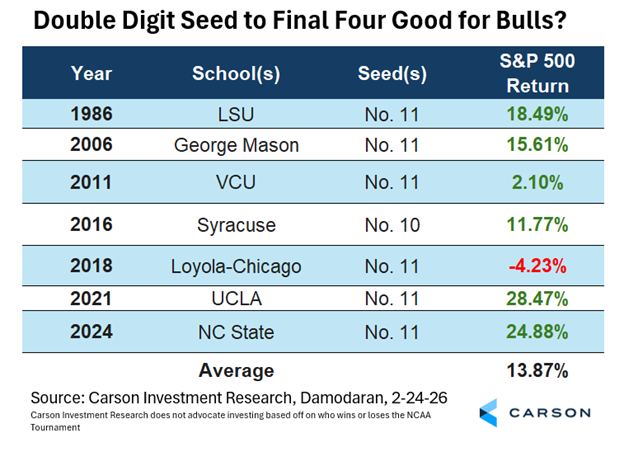
When these Cinderella teams make a run and reach the Final Four, the average S&P 500 return is 13.87%. Although this has only happened seven times in the history of the tournament, six have correlated with positive returns for the S&P 500. Shockingly enough, Sister Jean and her Ramblers were the sole outlier with a -4.23% return. Do these runs create such joy that consumer sentiment bleeds over from the athletic world to the national economy? If so, who could blame them!
Putting the final name on the bracket means something to all of those who fill out a bracket. This final ink blotting signifies their stamp of approval and rooting interest for a six-game stretch. As most people do, when thinking of the teams capable of cutting down the nets, your mind easily lapses to the prominent champions and “blue bloods” of the past. Looking at this chart, we gathered data on the winningest teams in tournament history and the average return yielded by their numerous championships.
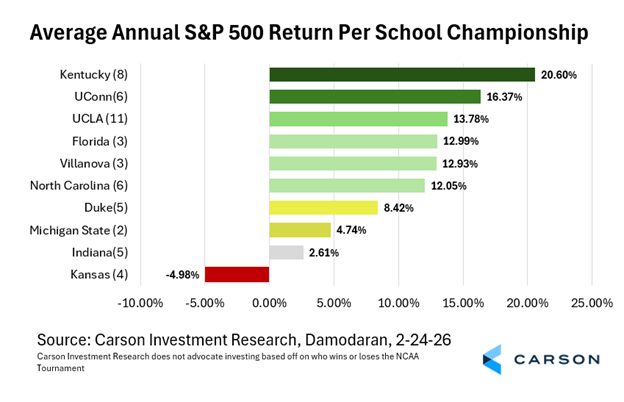
Looking at the data, naturally your eyes dart to the highest average return on the page, where you see that the blue-blooded Kentucky Wildcats have yielded an average return of 20.60% for the S&P 500 in their eight championship seasons. In what may be now an overly critiqued move of the past, Roy Williams might have been onto something by leaving the University of Kansas (who has an average -4.98% return) to the University of North Carolina (12.05% return) for the remainder of his coaching career. Lately, college basketball has been spearheaded by perhaps its most polarizing figure, Dan Hurley. Hurley — who may have the temper of an actual bull — has helped boost UConn’s correlated data to a 16.37% average return when the school cuts down the nets. Finally, rounding out with the Florida Gators, can coach Todd Golden capture his inner Billy Donovan and go back-to-back in the same way the school accomplished in ’06 & ’07? If so, a win would add another year of data to the school’s 12.99% average return.
While not all our teams have cut down those sacred nets, hopefuls who look at their school’s conference data may find some encouraging metrics. These metrics are looking historically at the conference level, or the grouping of universities for athletic purposes, at the time in which their schools have won the tournament.
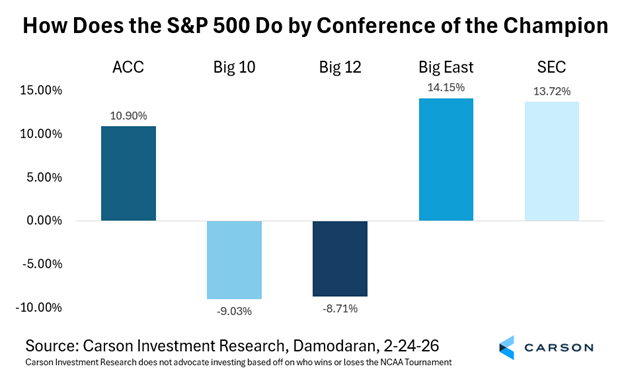
As a Creighton Bluejays fan, seeing the Big East conference carry the highest average return of the S&P 500 (14.15%) when one of their universities is a champion gives me hope (and some unneeded but extra motivation) to see my team contribute an eventual title. For most conferences there is some encouraging historical data, such as the SEC who falls just shy of the Big East’s average return, coming in with an average rate of 13.72% return. Not all are cumulatively positive, however, those conferences being the Big 10 and Big 12, which have an average negative return of -8.71% and -9.03% when one of their schools wins the tournament. Both conferences deserve to be on the sour end of a famous Bill Raftery piercing “Onions!”
To all of those who cannot wait to sit for hours upon hours and have their eyes glued to a tv screen, enjoy the greatest tournament in all of sports!
Stating again: the data on past champions and market correlation is strictly for entertainment purposes only and not intended to make market decisions or investment advice upon.
By: Joel Riha-Aldrich, Analyst, Investment Research
8824161.1 – 16MAR26A
