
The S&P 500 hit a new all-time high on Tuesday (October 6th), its first since August 13th. The index is up 14.2% year-to-date, or 15.2% including dividends.
Many folks seem confused about why stocks are doing so well even as bond yields keep rising. The 10-year Treasury yield is at 5.29%, and the 30-year is at 5.67%. For perspective, the 10-year yield was just 4.18% at the end of last year.
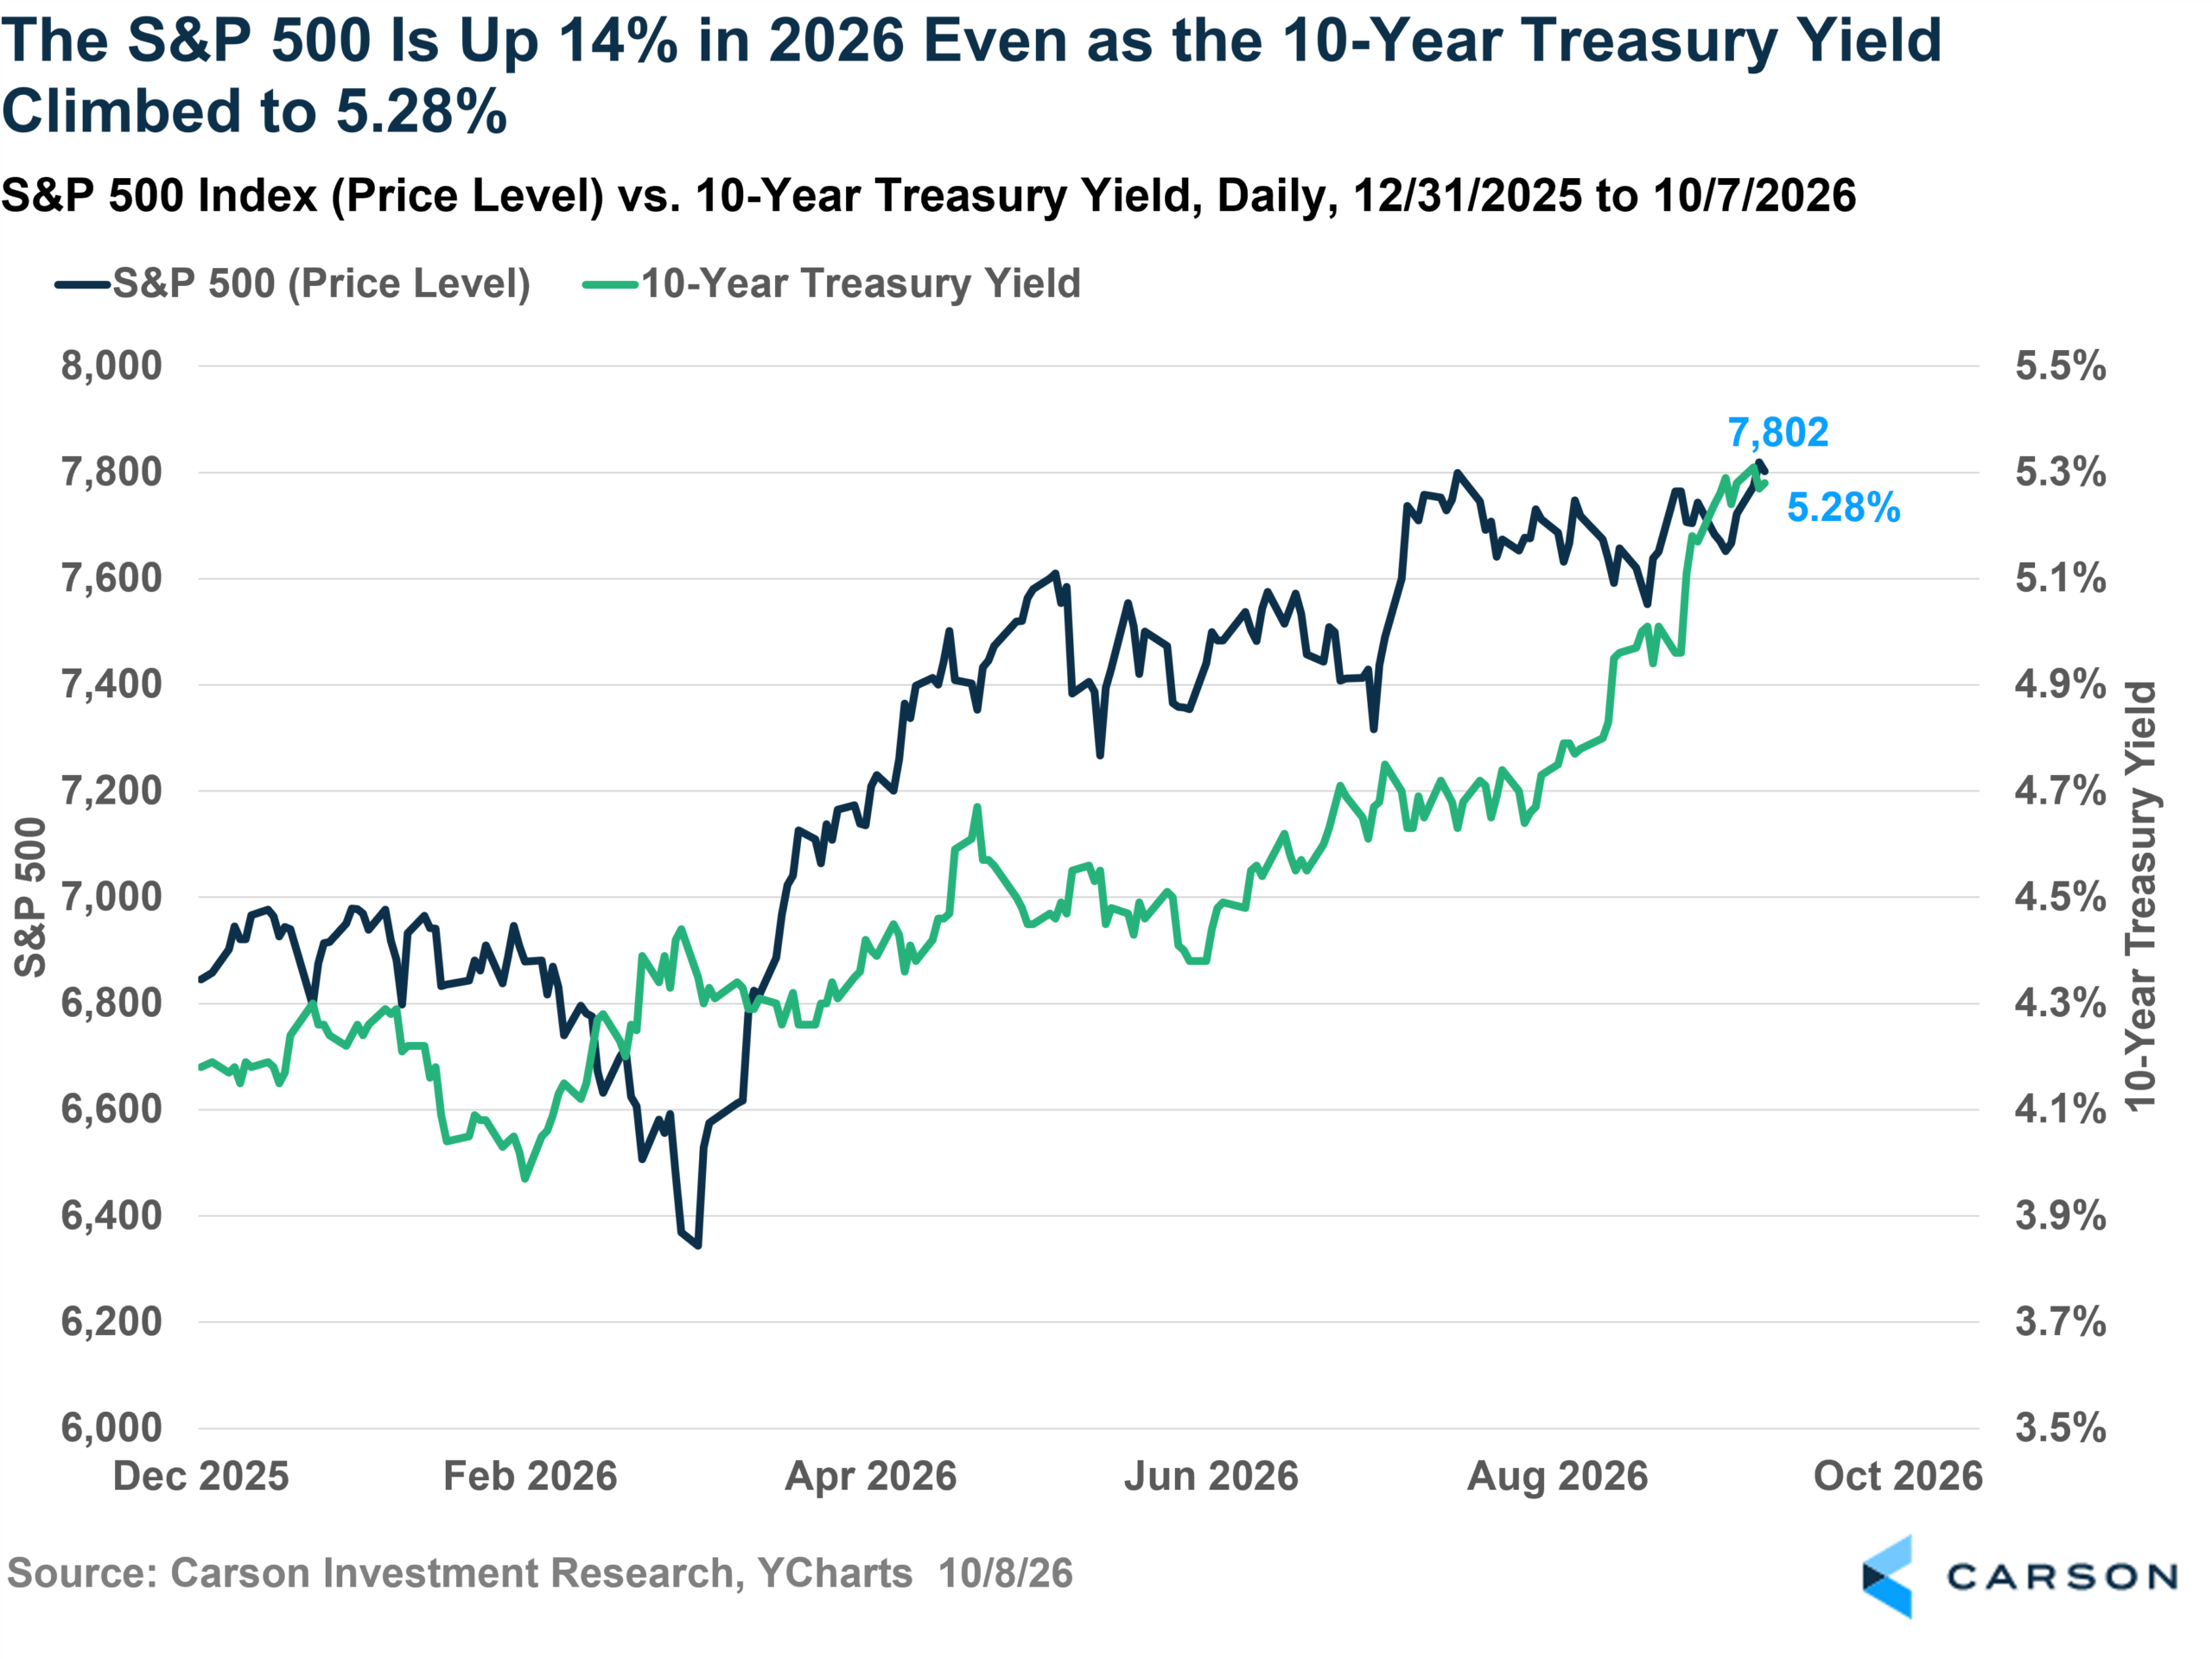
To be clear, higher rates have had an impact. Valuations have taken a pretty big hit, as you’d expect. But profit growth has overwhelmed that, powered by margin expansion (along with sales growth).
Forward Earnings Expectations Continue to Surge
Start with earnings. Next-12-month (NTM) earnings per share (EPS) for the S&P 500 is now $404/share, up 31.1% from $308 at the end of 2025.
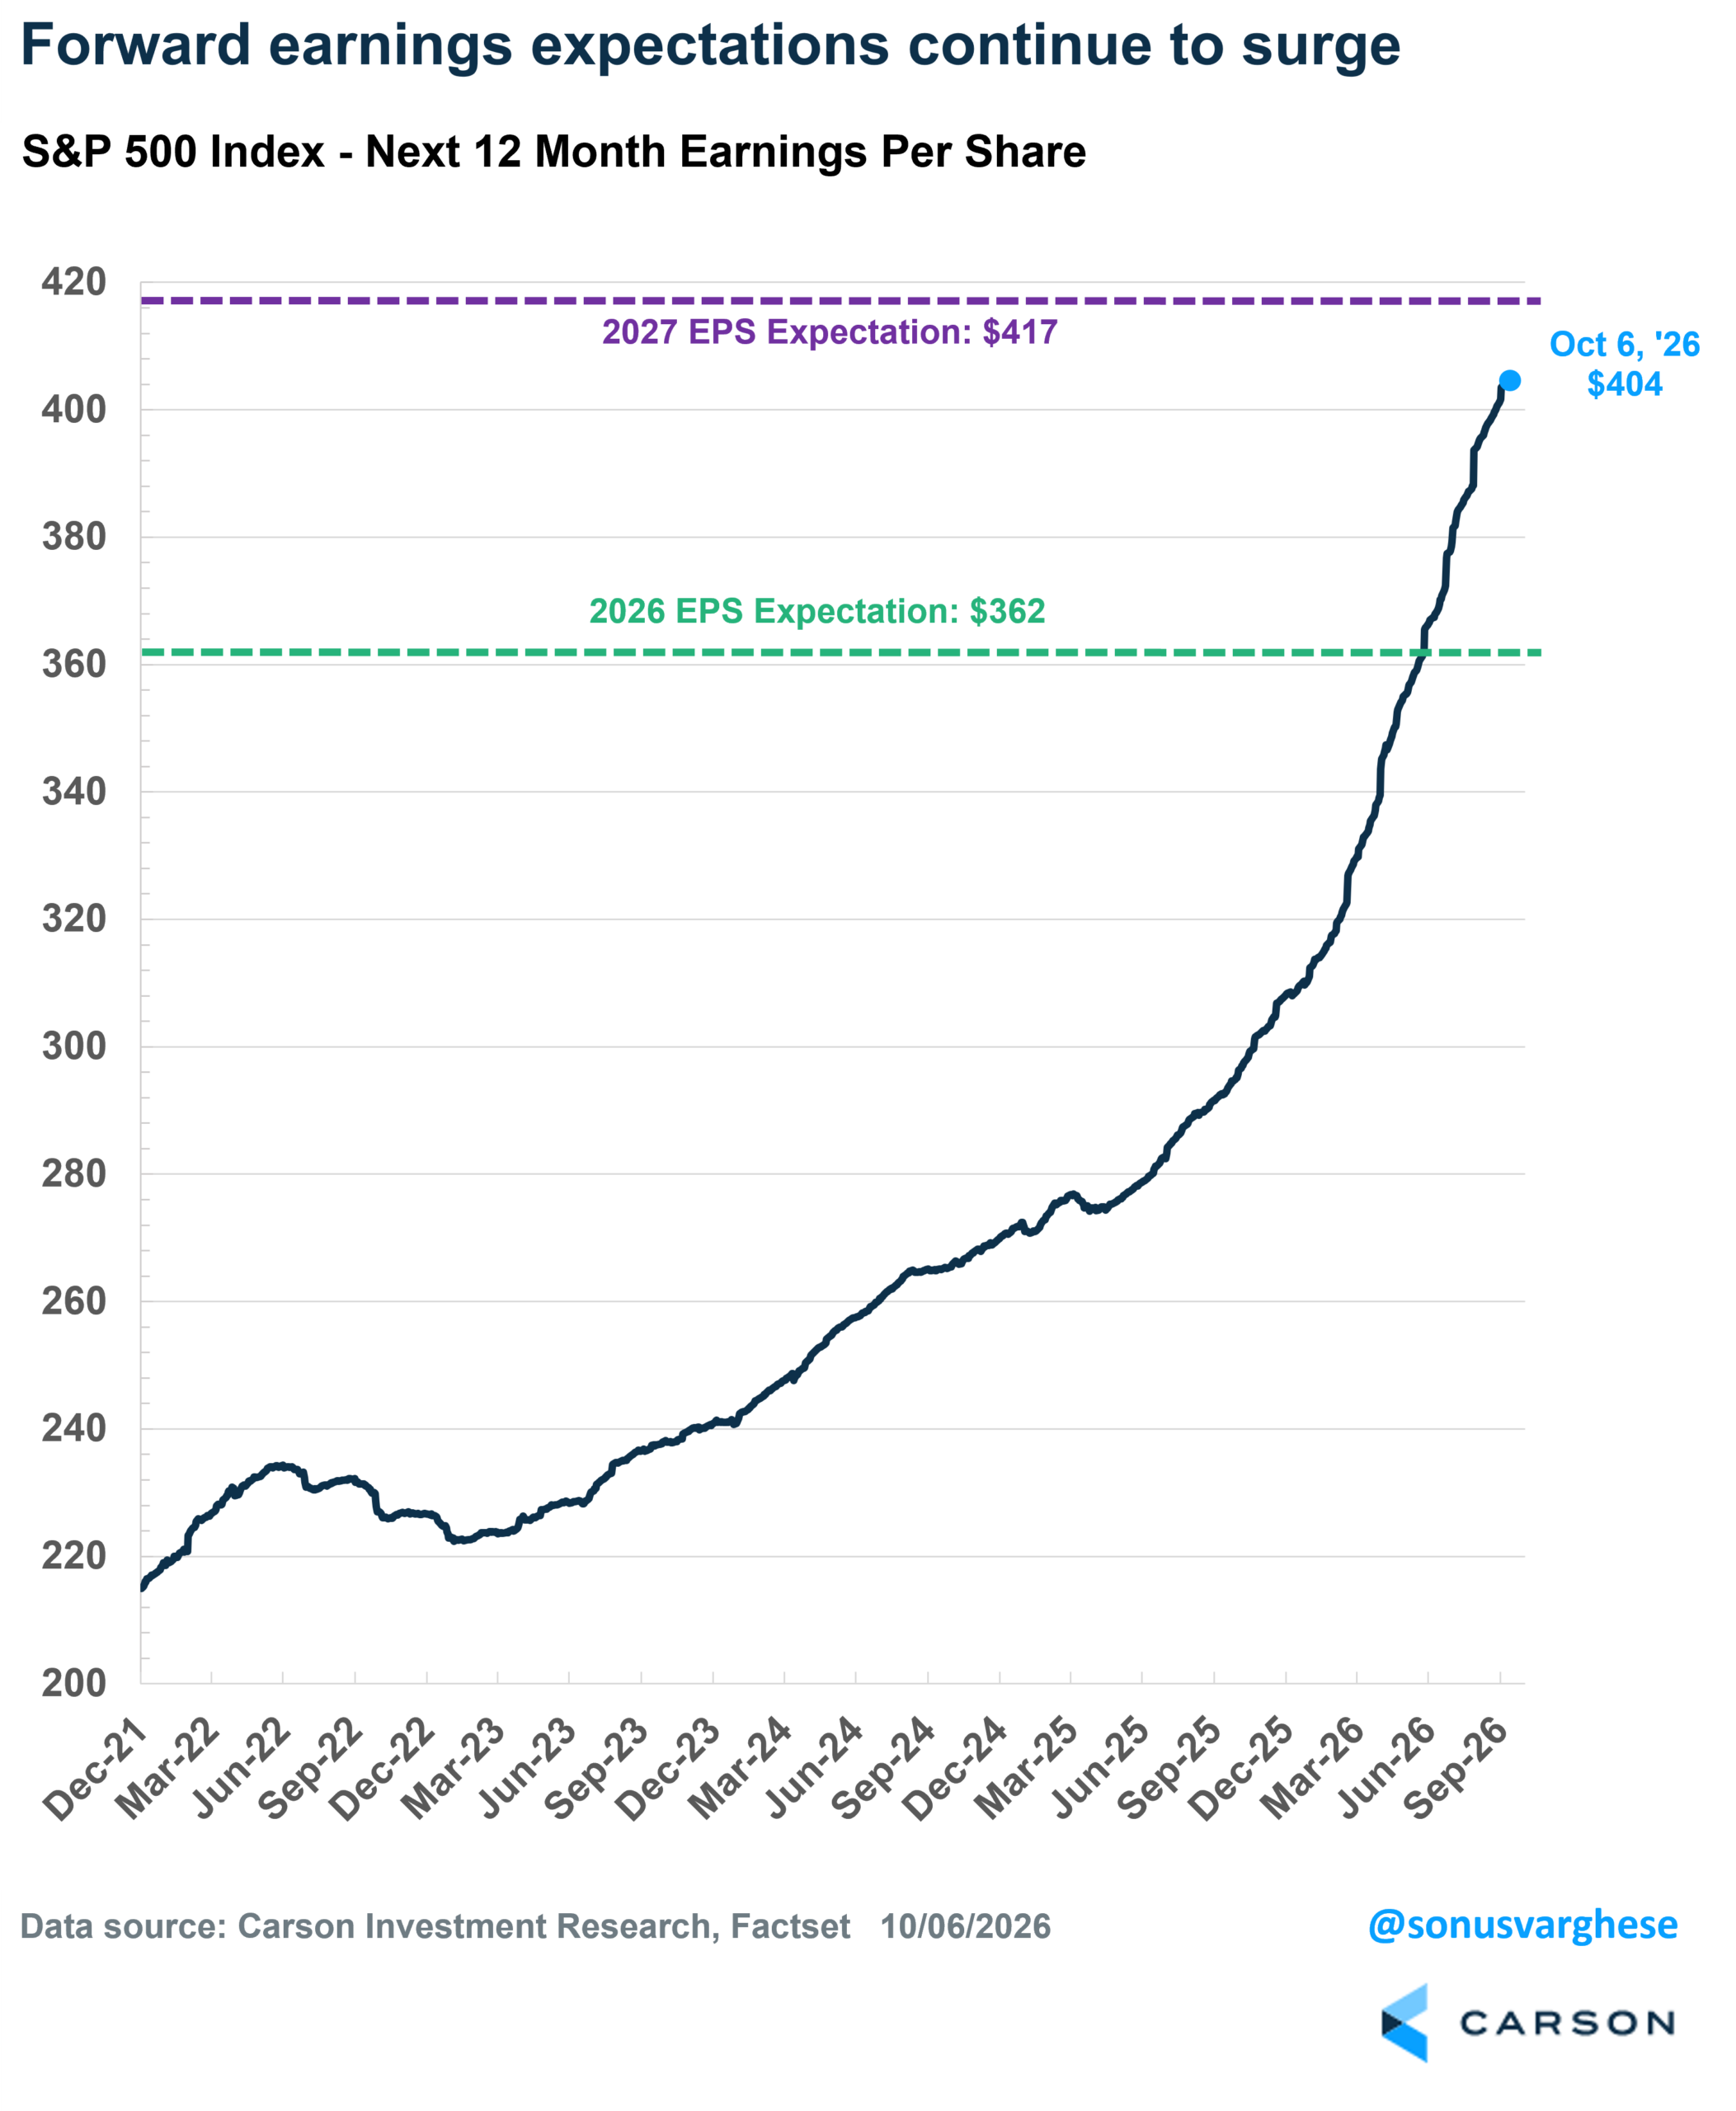
Keep in mind what NTM EPS includes: three-quarters of the way through 2026, it’s about one-quarter of the 2026 estimate and three-quarters of the 2027 estimate. Both have been marked up hard this year:
- 2026 EPS estimate: $362, up 17.5% from $308 at the end of 2025
- 2027 EPS estimate: $417, up 17.5% from $355 at the end of 2025
Analysts expect 2027 EPS to be 15.2% above 2026, right where that gap sat coming into the year (15.1%). In other words, both years are up about the same amount, so the whole earnings curve has shifted higher.
Margins Keep Expanding
Forward margins for the S&P 500 are now at 16.9%, yet another all-time high. Here’s how things have changed over the last six and three-quarter years:
- End of 2019: 12.0%
- End of 2022: 12.7%
- End of 2024: 13.7%
- End of 2025: 14.5%
- October 6, 2026: 16.9%
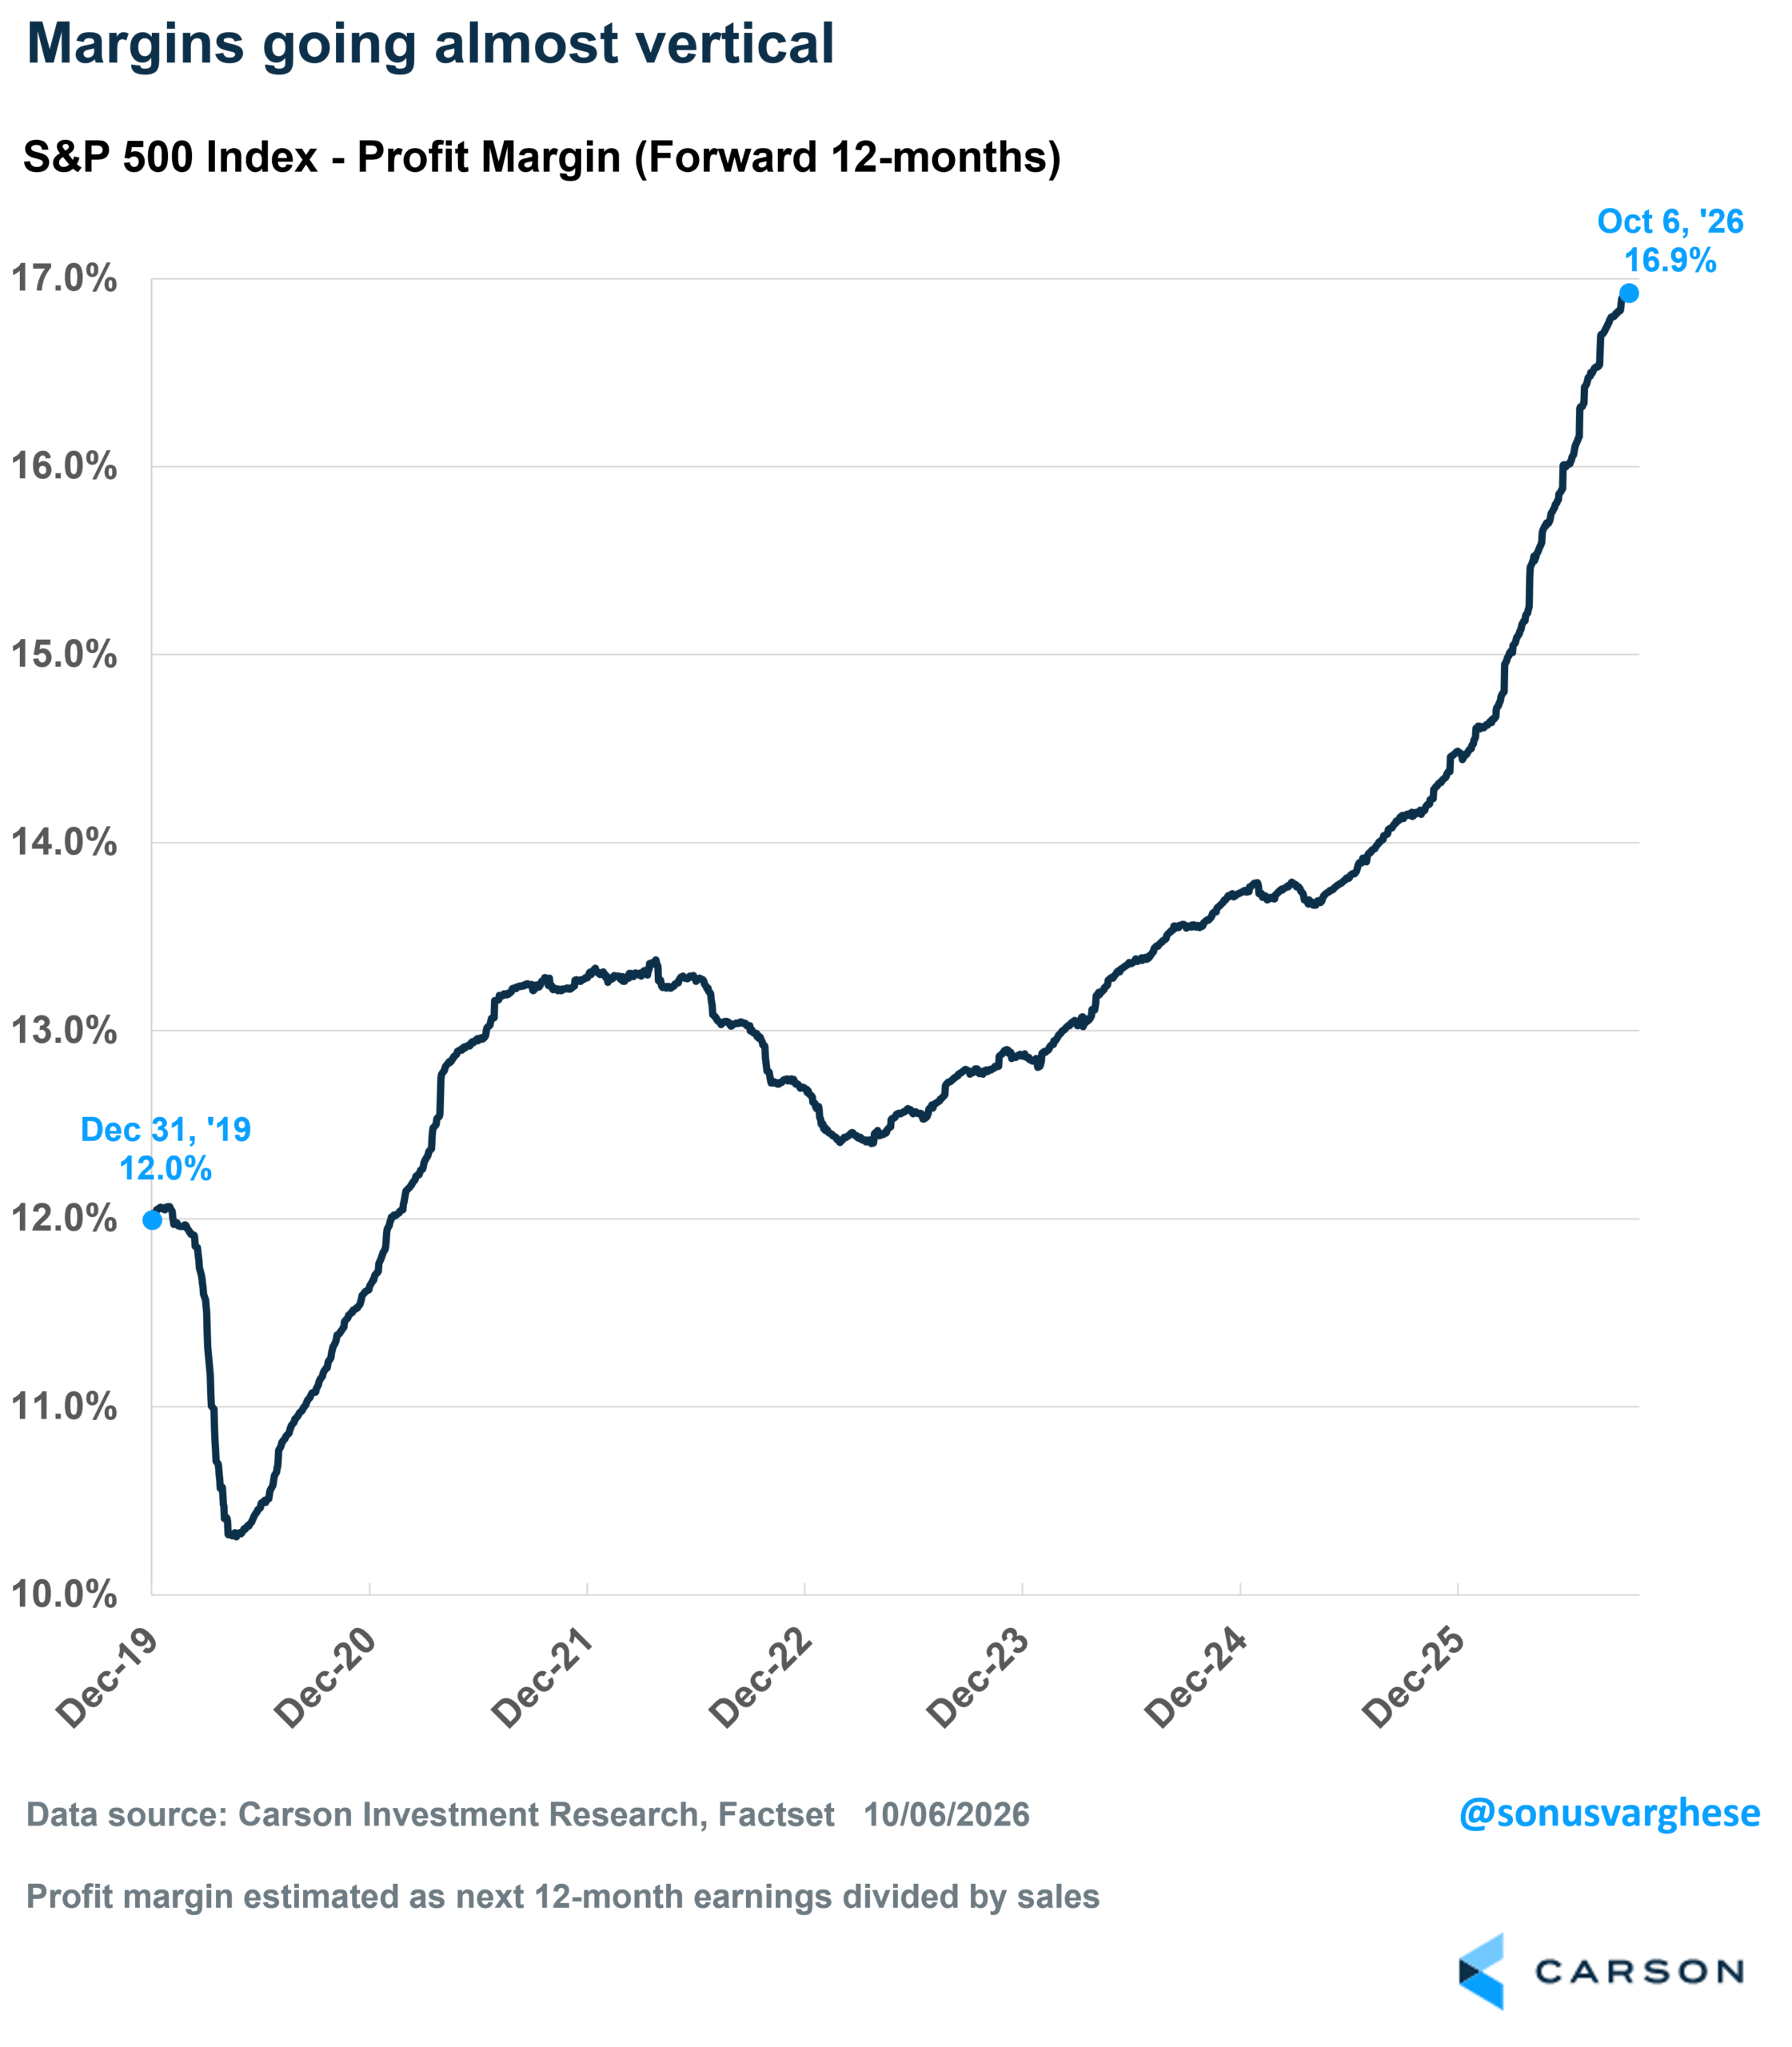
Margins have expanded more in the first nine months of 2026 (2.4%-points) than they did over the prior three years combined (1.8%-points).
Return Drivers: Profits Are Doing All the Work
As I’ve noted before, we can separate the S&P 500’s return into contributions from earnings growth, multiple change, and dividends. The index’s 15.2% total return through October 6th came from:
- Earnings growth contribution: +29.0%-points
- Multiple growth contribution: -14.8%-points
- Dividends: +1.0%-points
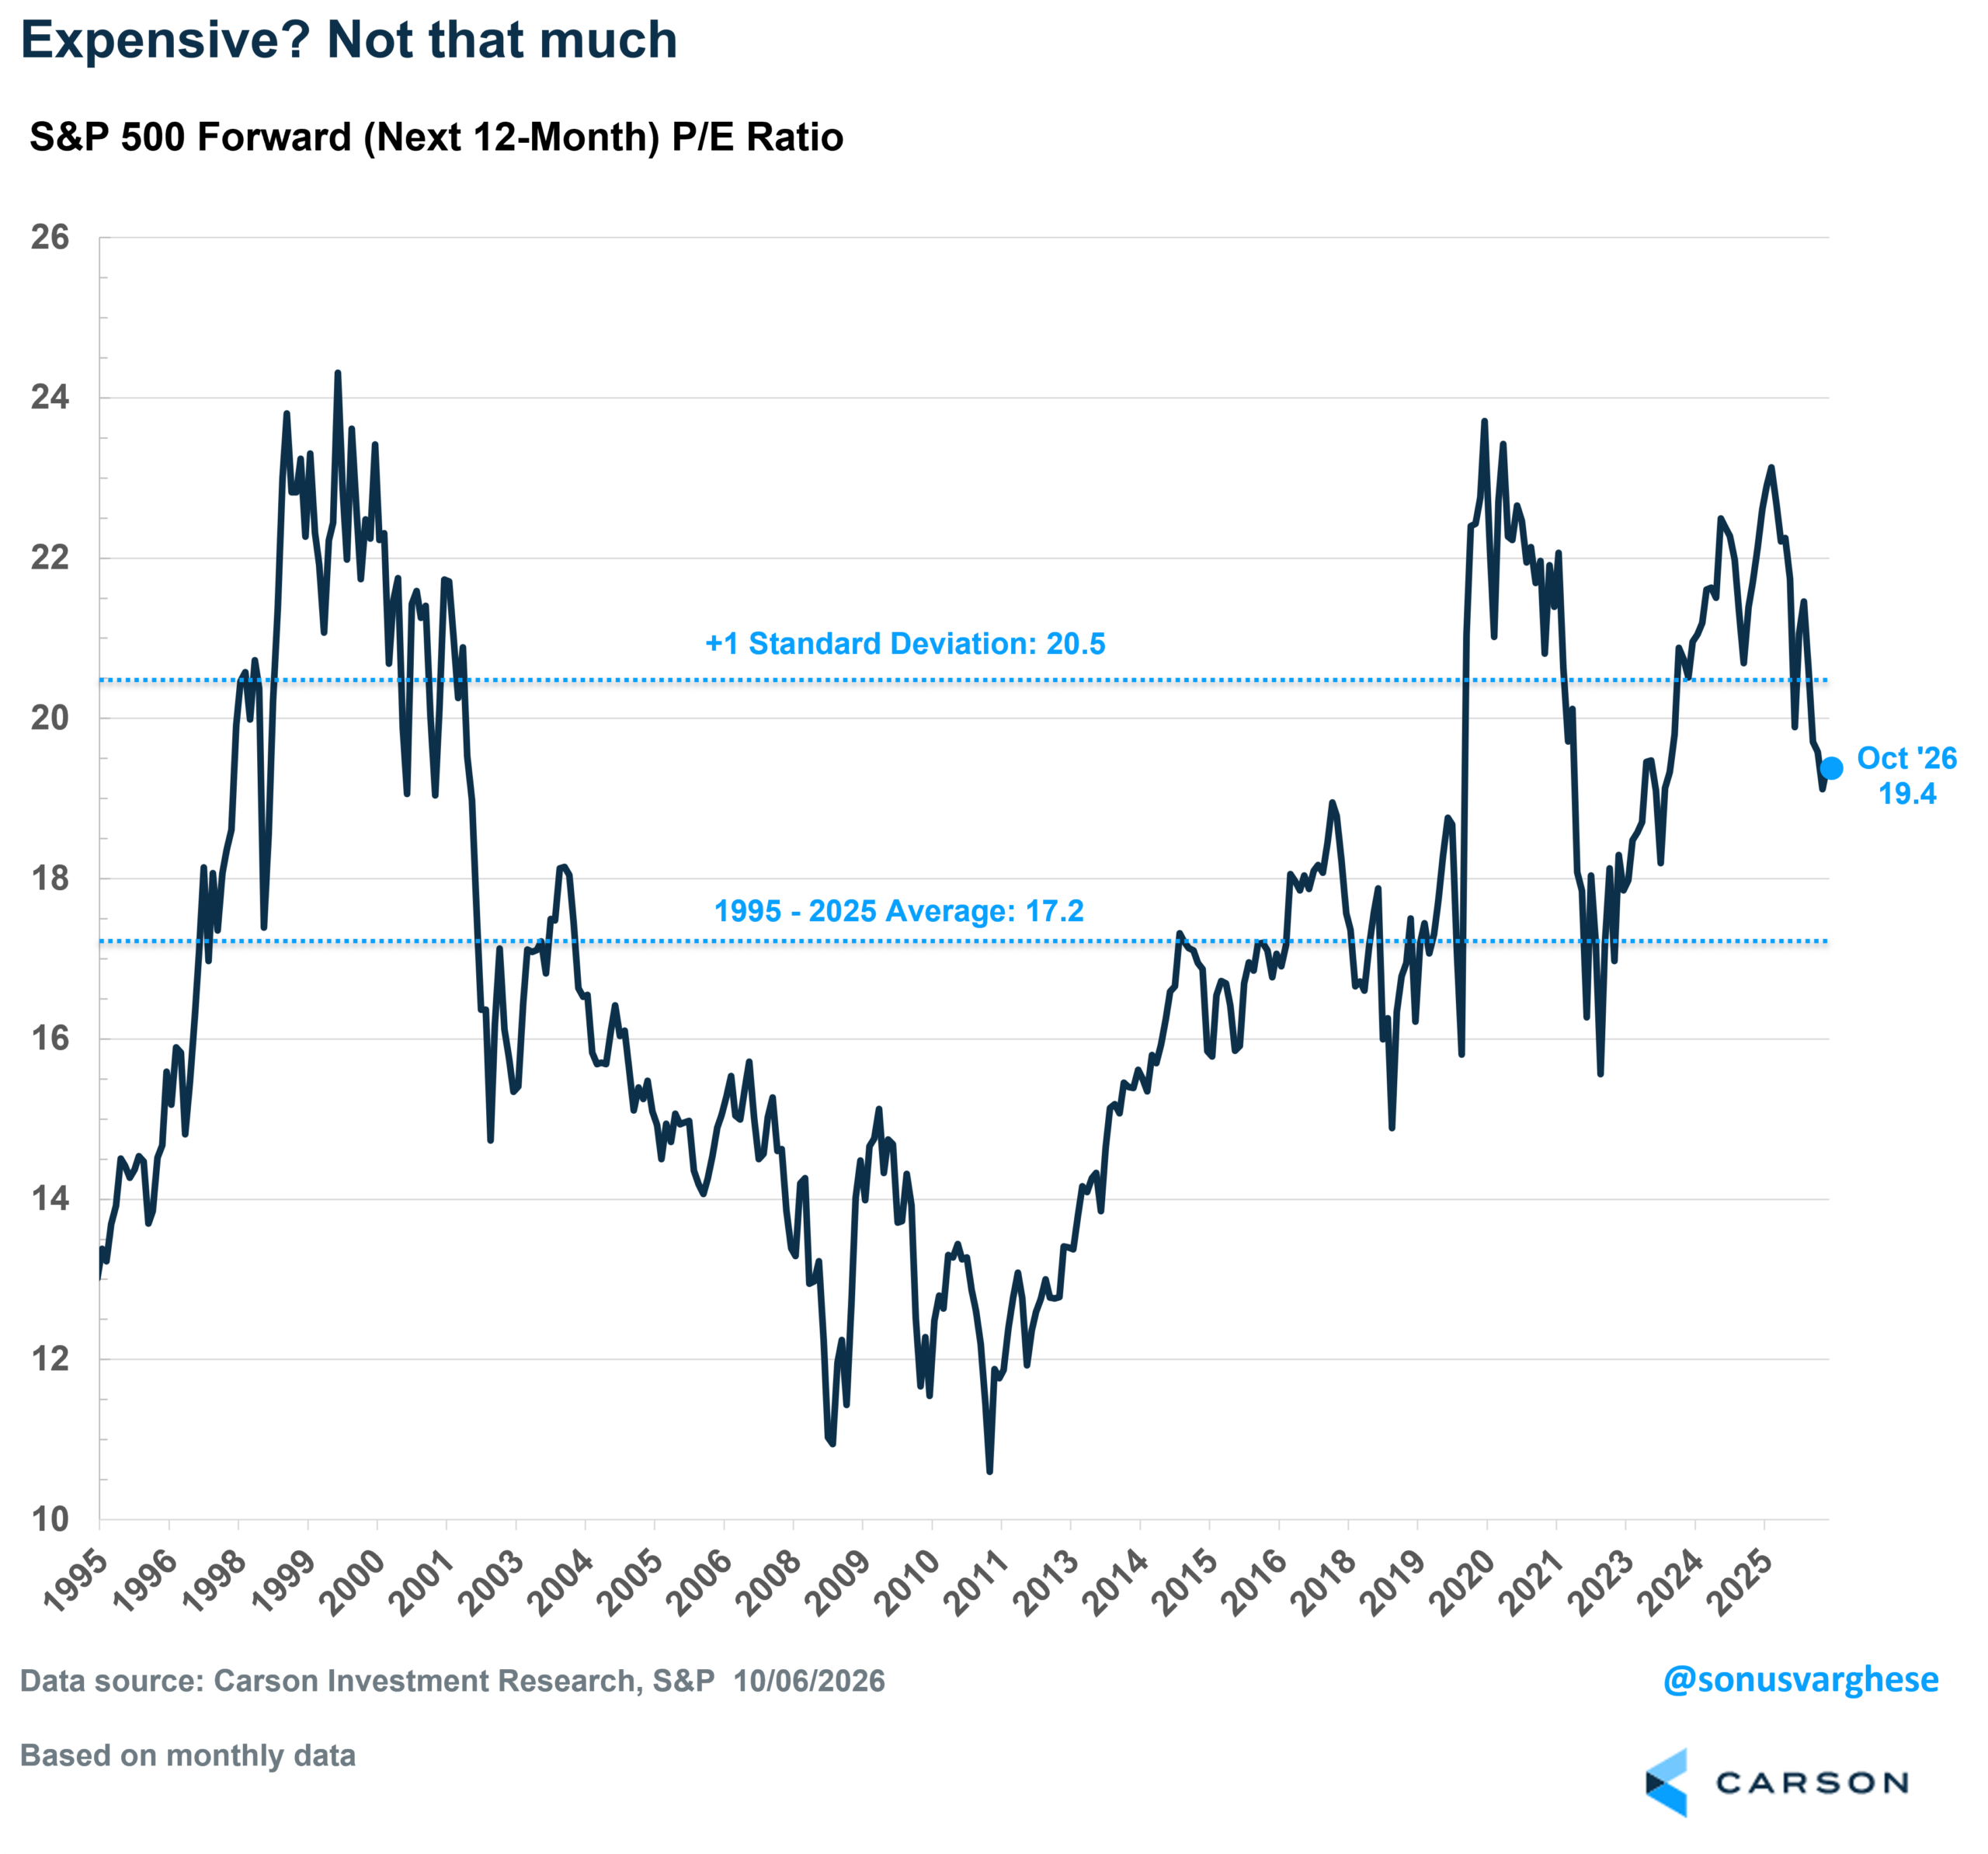
Rising profit expectations delivered almost twice the index’s actual return, and contracting multiples handed back about half of that. The forward P/E is now 19.4x, down from 22.2x at the end of 2025.

Stay on Top of Market Trends
The Carson Investment Research newsletter offers up-to-date market news, analysis and insights. Subscribe today!
"*" indicates required fields
This is where higher yields show up. When yields rise, investors pay less for a future dollar of earnings, and that’s exactly what’s happened this year.
That contraction has taken valuations back toward normal. At 19.4x, the forward P/E sits above the 1995-2025 average of 17.2x but below the +1 standard deviation level of 20.5x. It peaked at 23.4x on October 29th of last year and hit a low of 19.0x on September 16th.
A Closer Look at Profit Growth
Profit growth can be split into two pieces: sales growth plus margin expansion. Sales growth is closely tied to nominal GDP growth, so as long as we don’t have a recession, it should run fairly strong. And right now, nominal GDP growth is clocking a really strong 6%+ pace.
Breaking the return down one level further:
- Earnings growth: +29.0%-points
-
- Sales growth: +12.4%-points
- Margin expansion: +16.6%-points
- Multiple growth: -14.8%-points
- Dividends: +1.0%-points
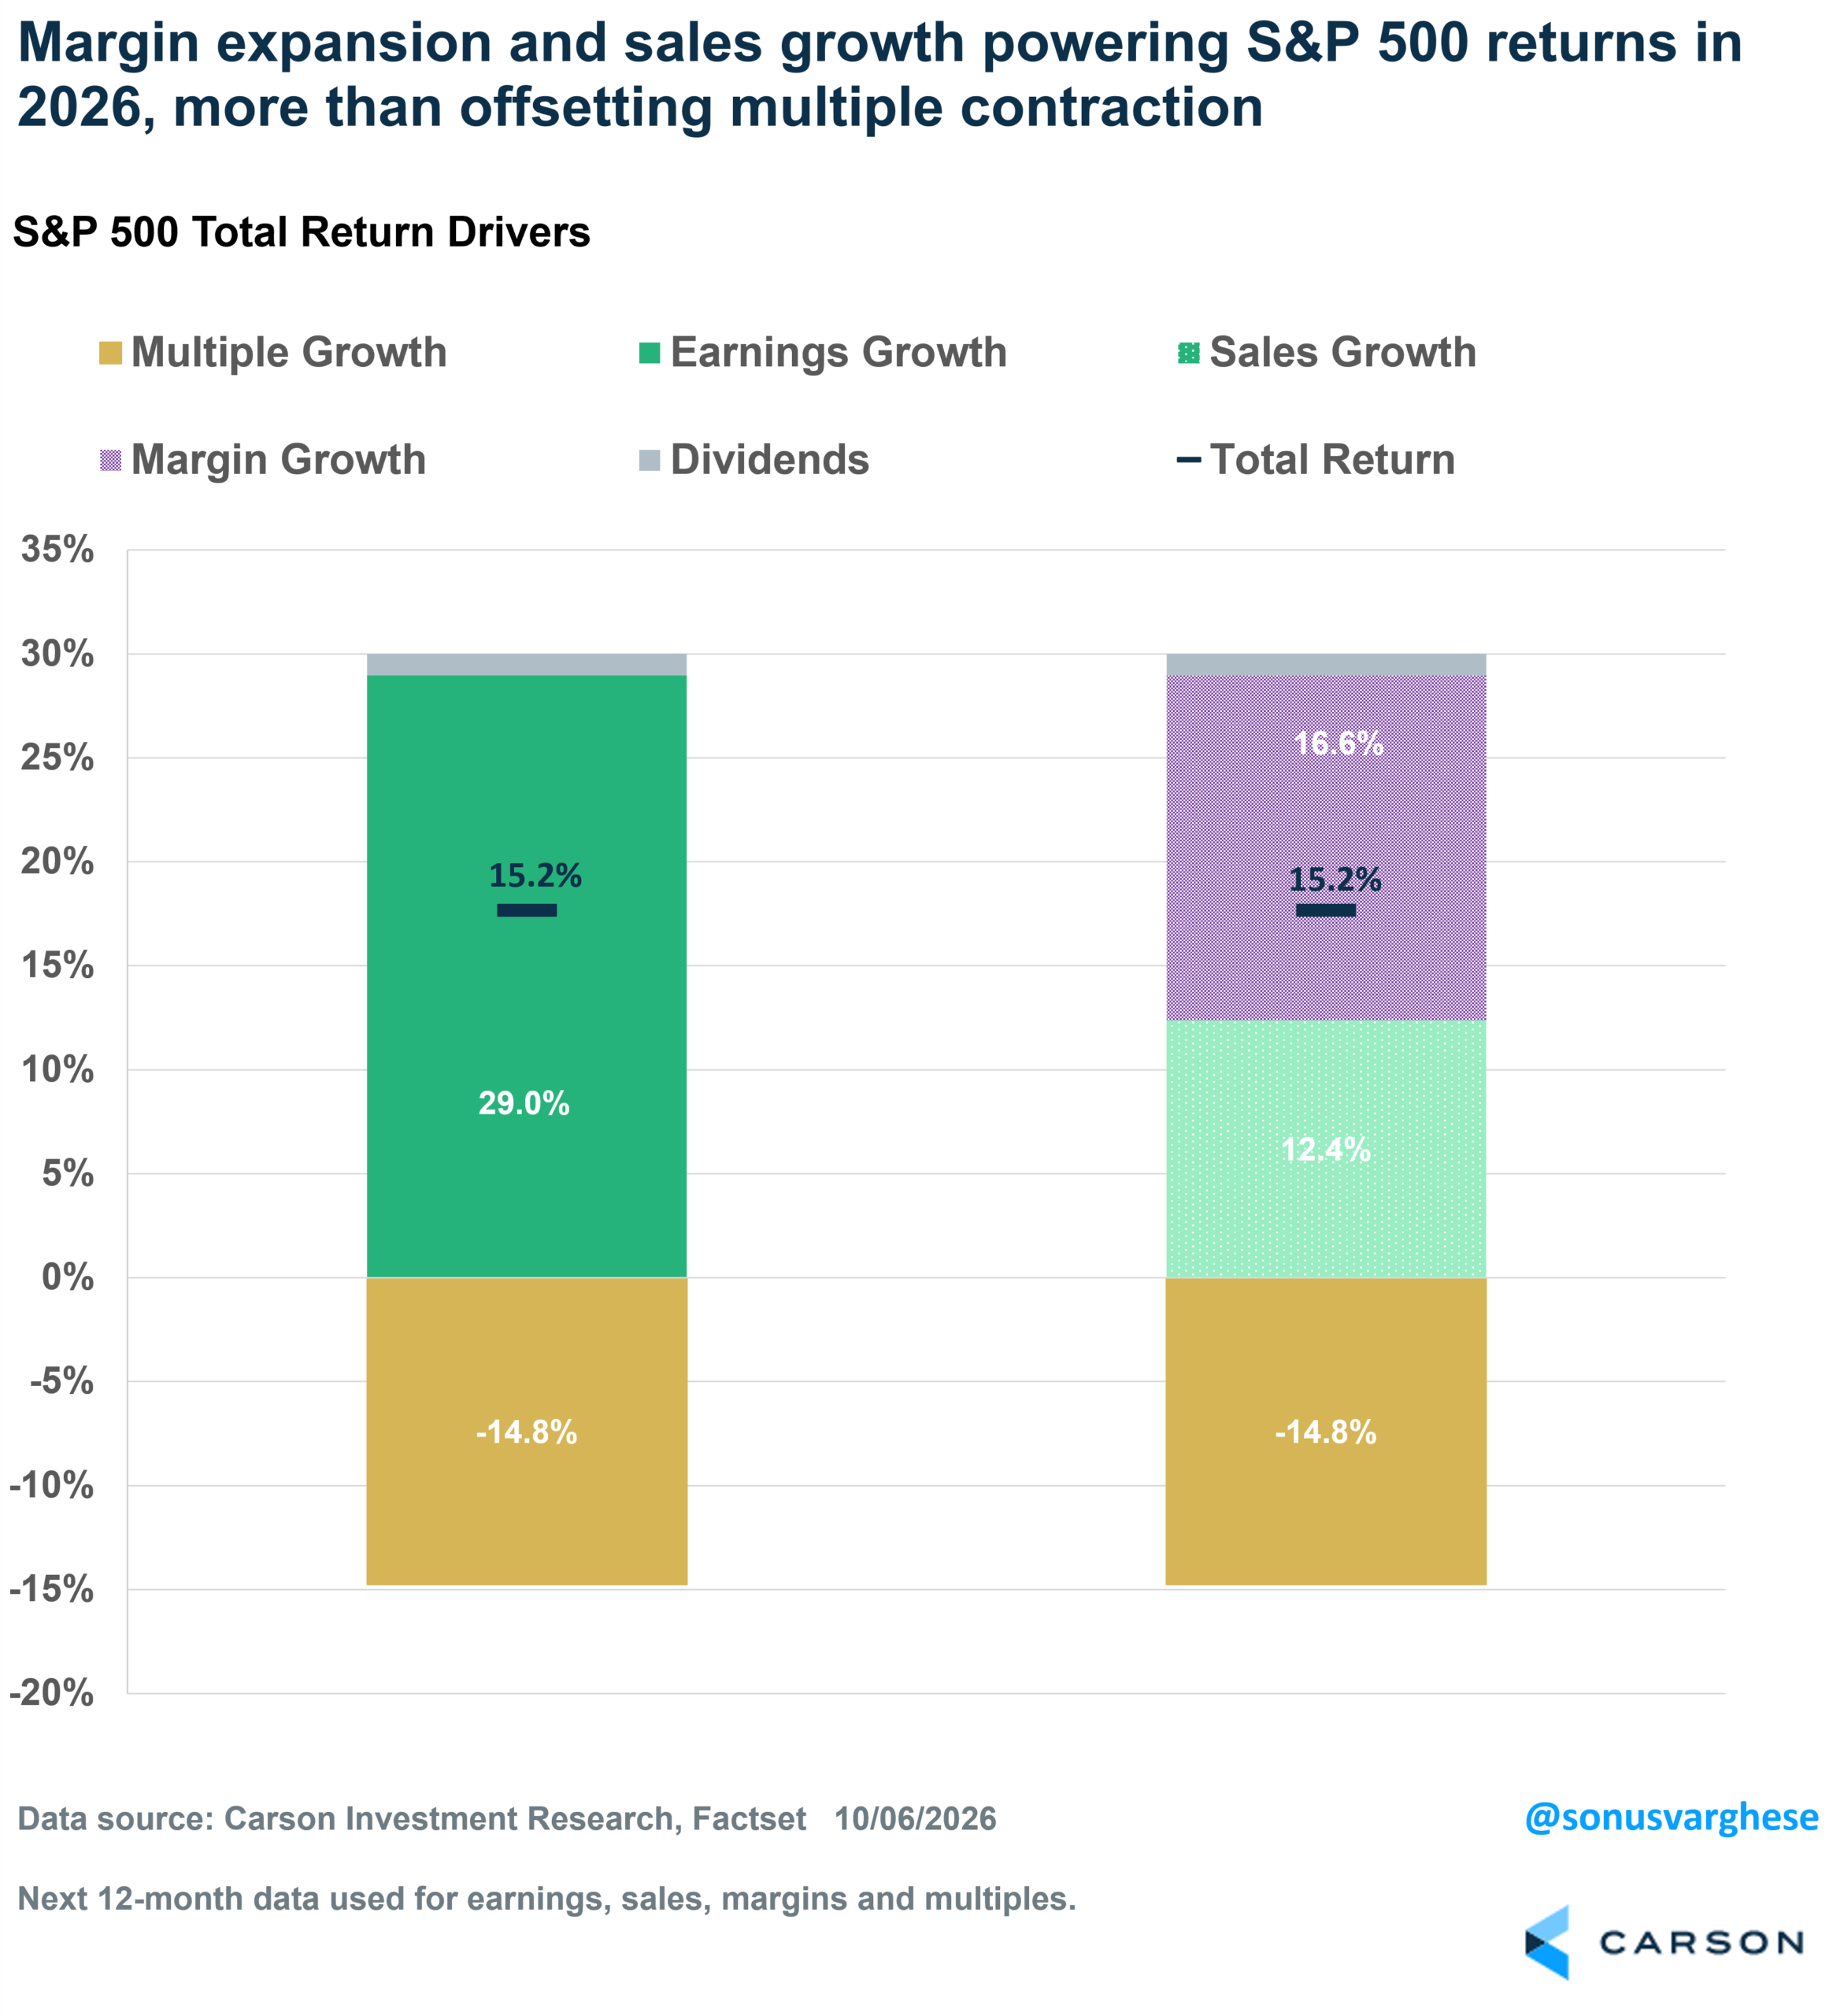
Margin expansion is the single biggest driver of returns this year, bigger than sales growth. And that’s despite NTM sales rising 12.3%.
That last piece is important. Margin expansion is, in part, the corporate side of higher prices. If companies can raise prices faster than costs rise, nominal revenues increase, and more of each sales dollar hits the bottom line. That’s great for profits, but not necessarily great for inflation.
The Longer View Says the Same Thing
Looking back to 2020, the S&P 500 has returned 168% from January 1, 2020 through October 6, 2026 (142% on price alone). Of which:
- Earnings growth: +137%-points
-
- Sales growth: +82%-points
- Margin expansion: +55%-points
- Multiple growth: +5%-points
- Dividends: +26%-points
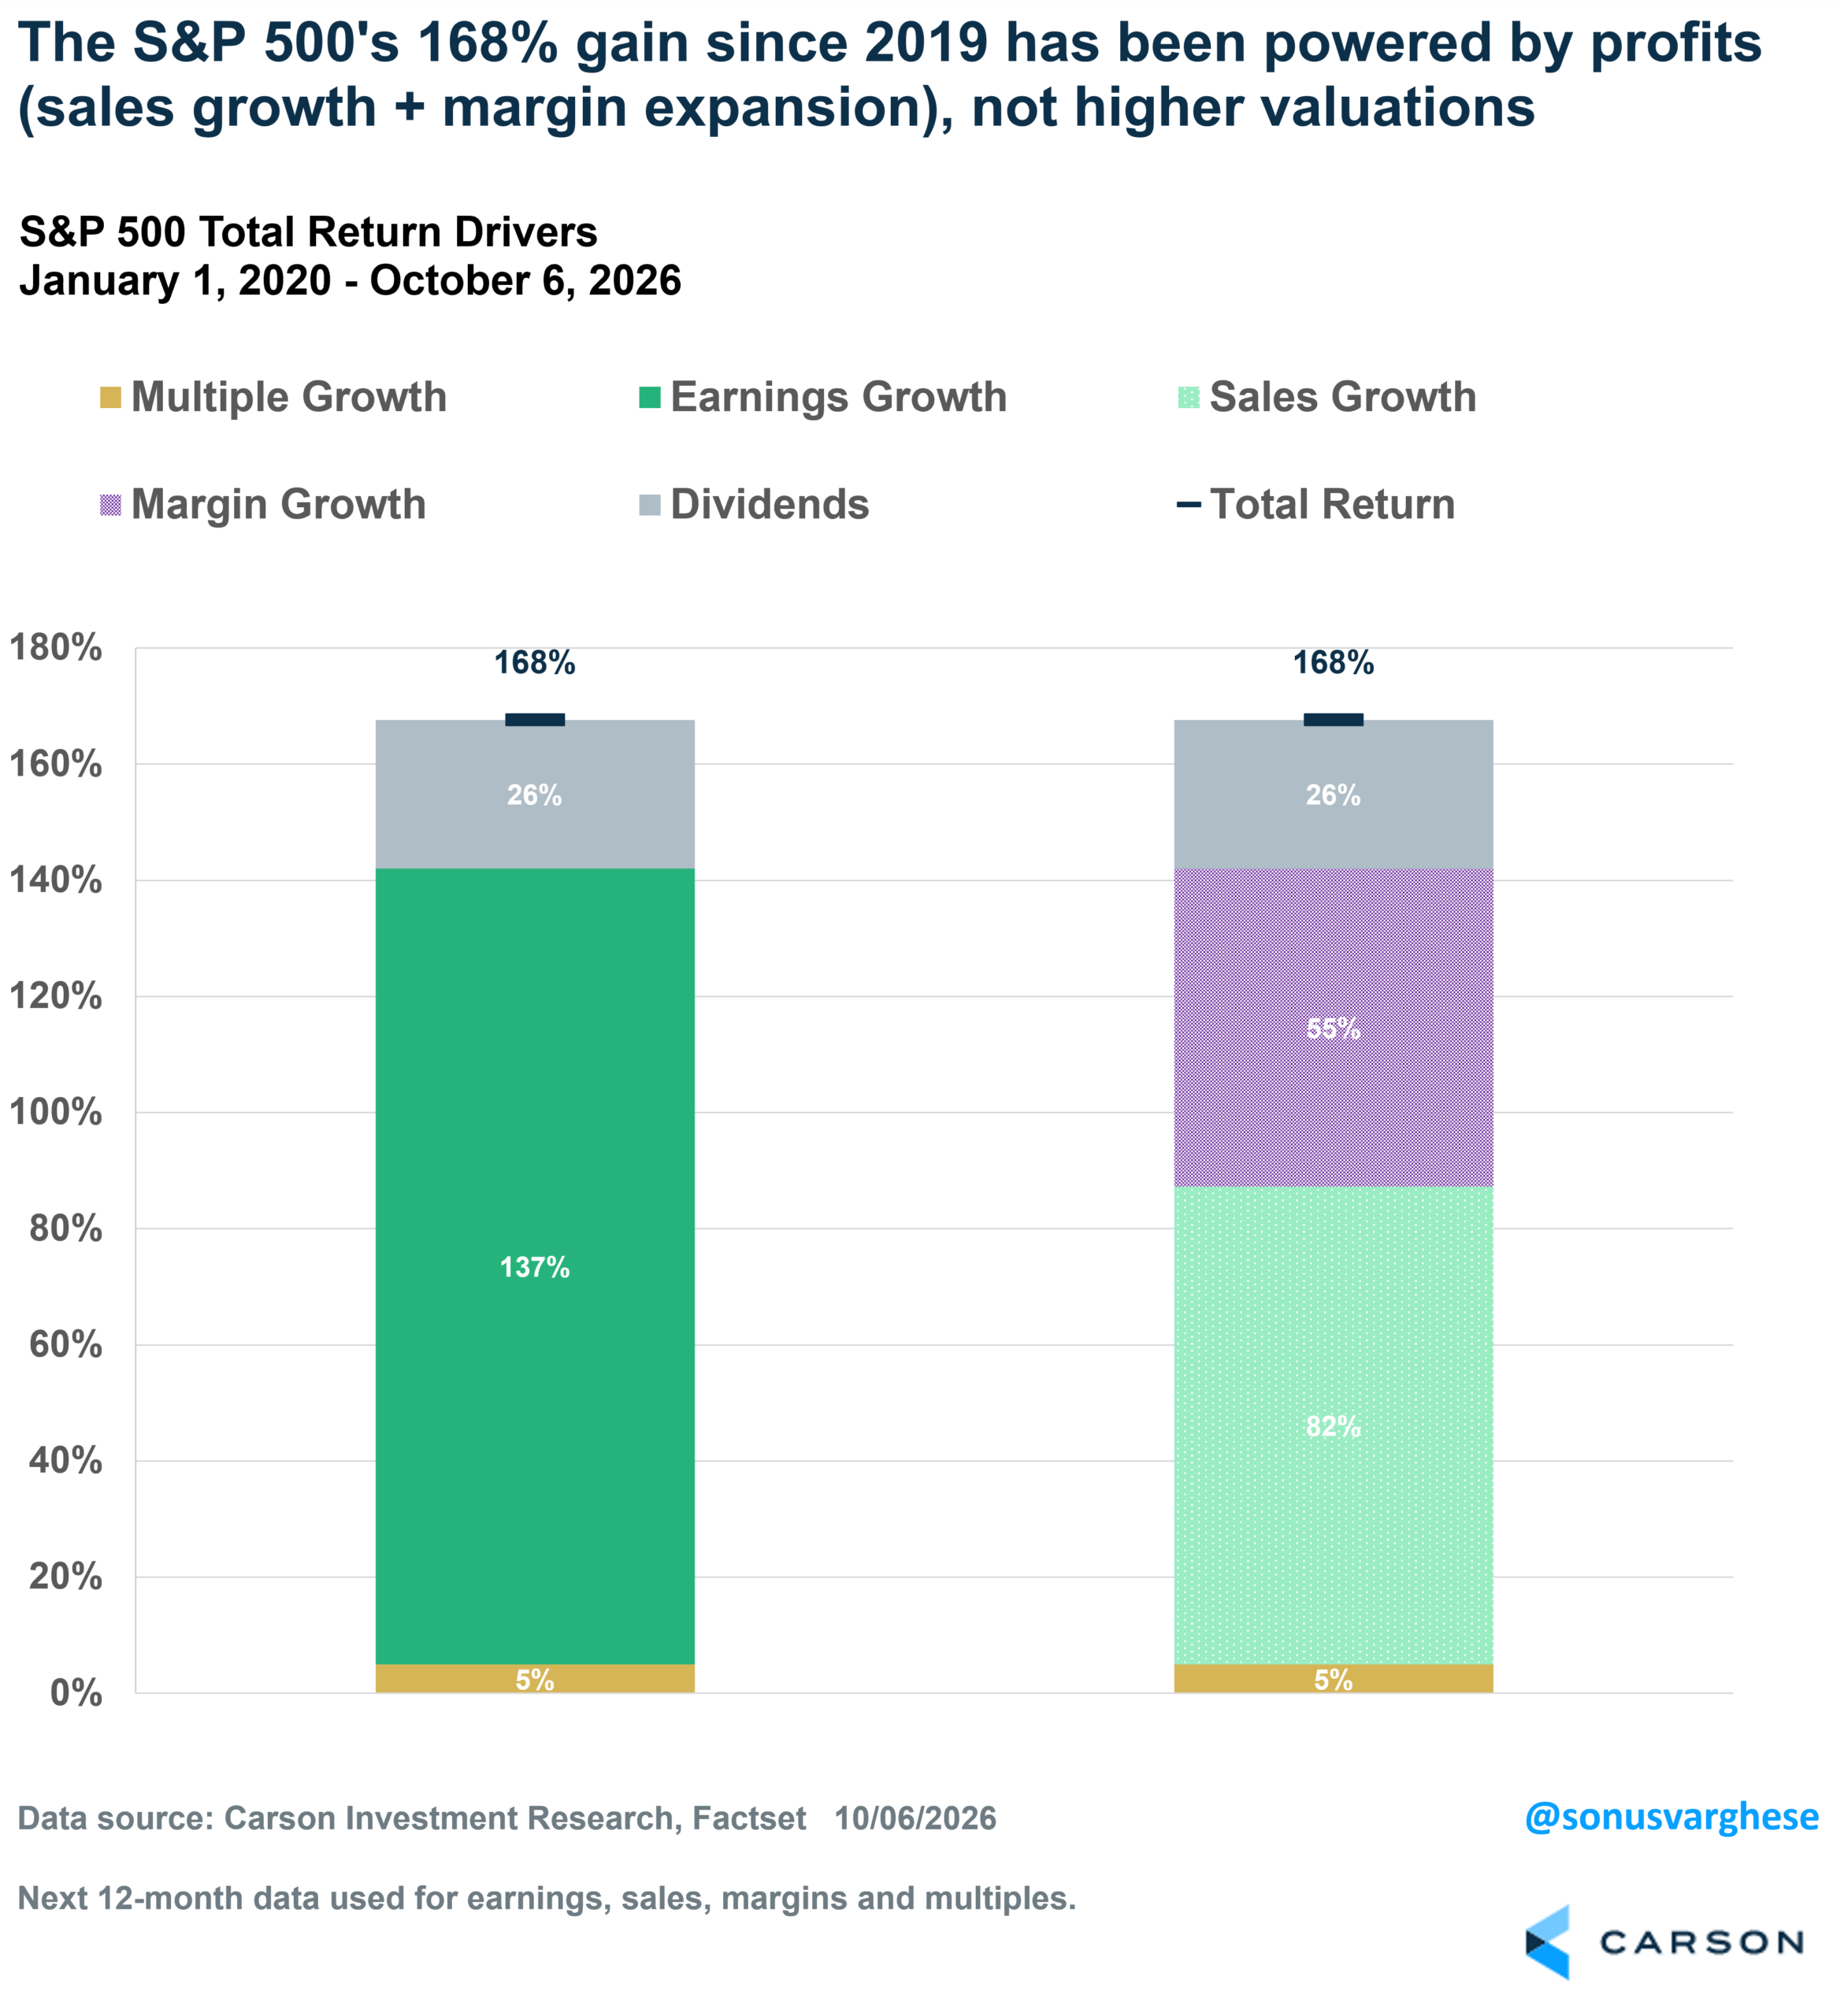
Multiple expansion has contributed very little over almost seven years. The forward P/E was 18.7x at the end of 2019 and is 19.4x now.
And don’t ignore dividends, which added 26%-points, five times what multiple expansion did. That never looks like much in any single year, but it’s what compounding does.
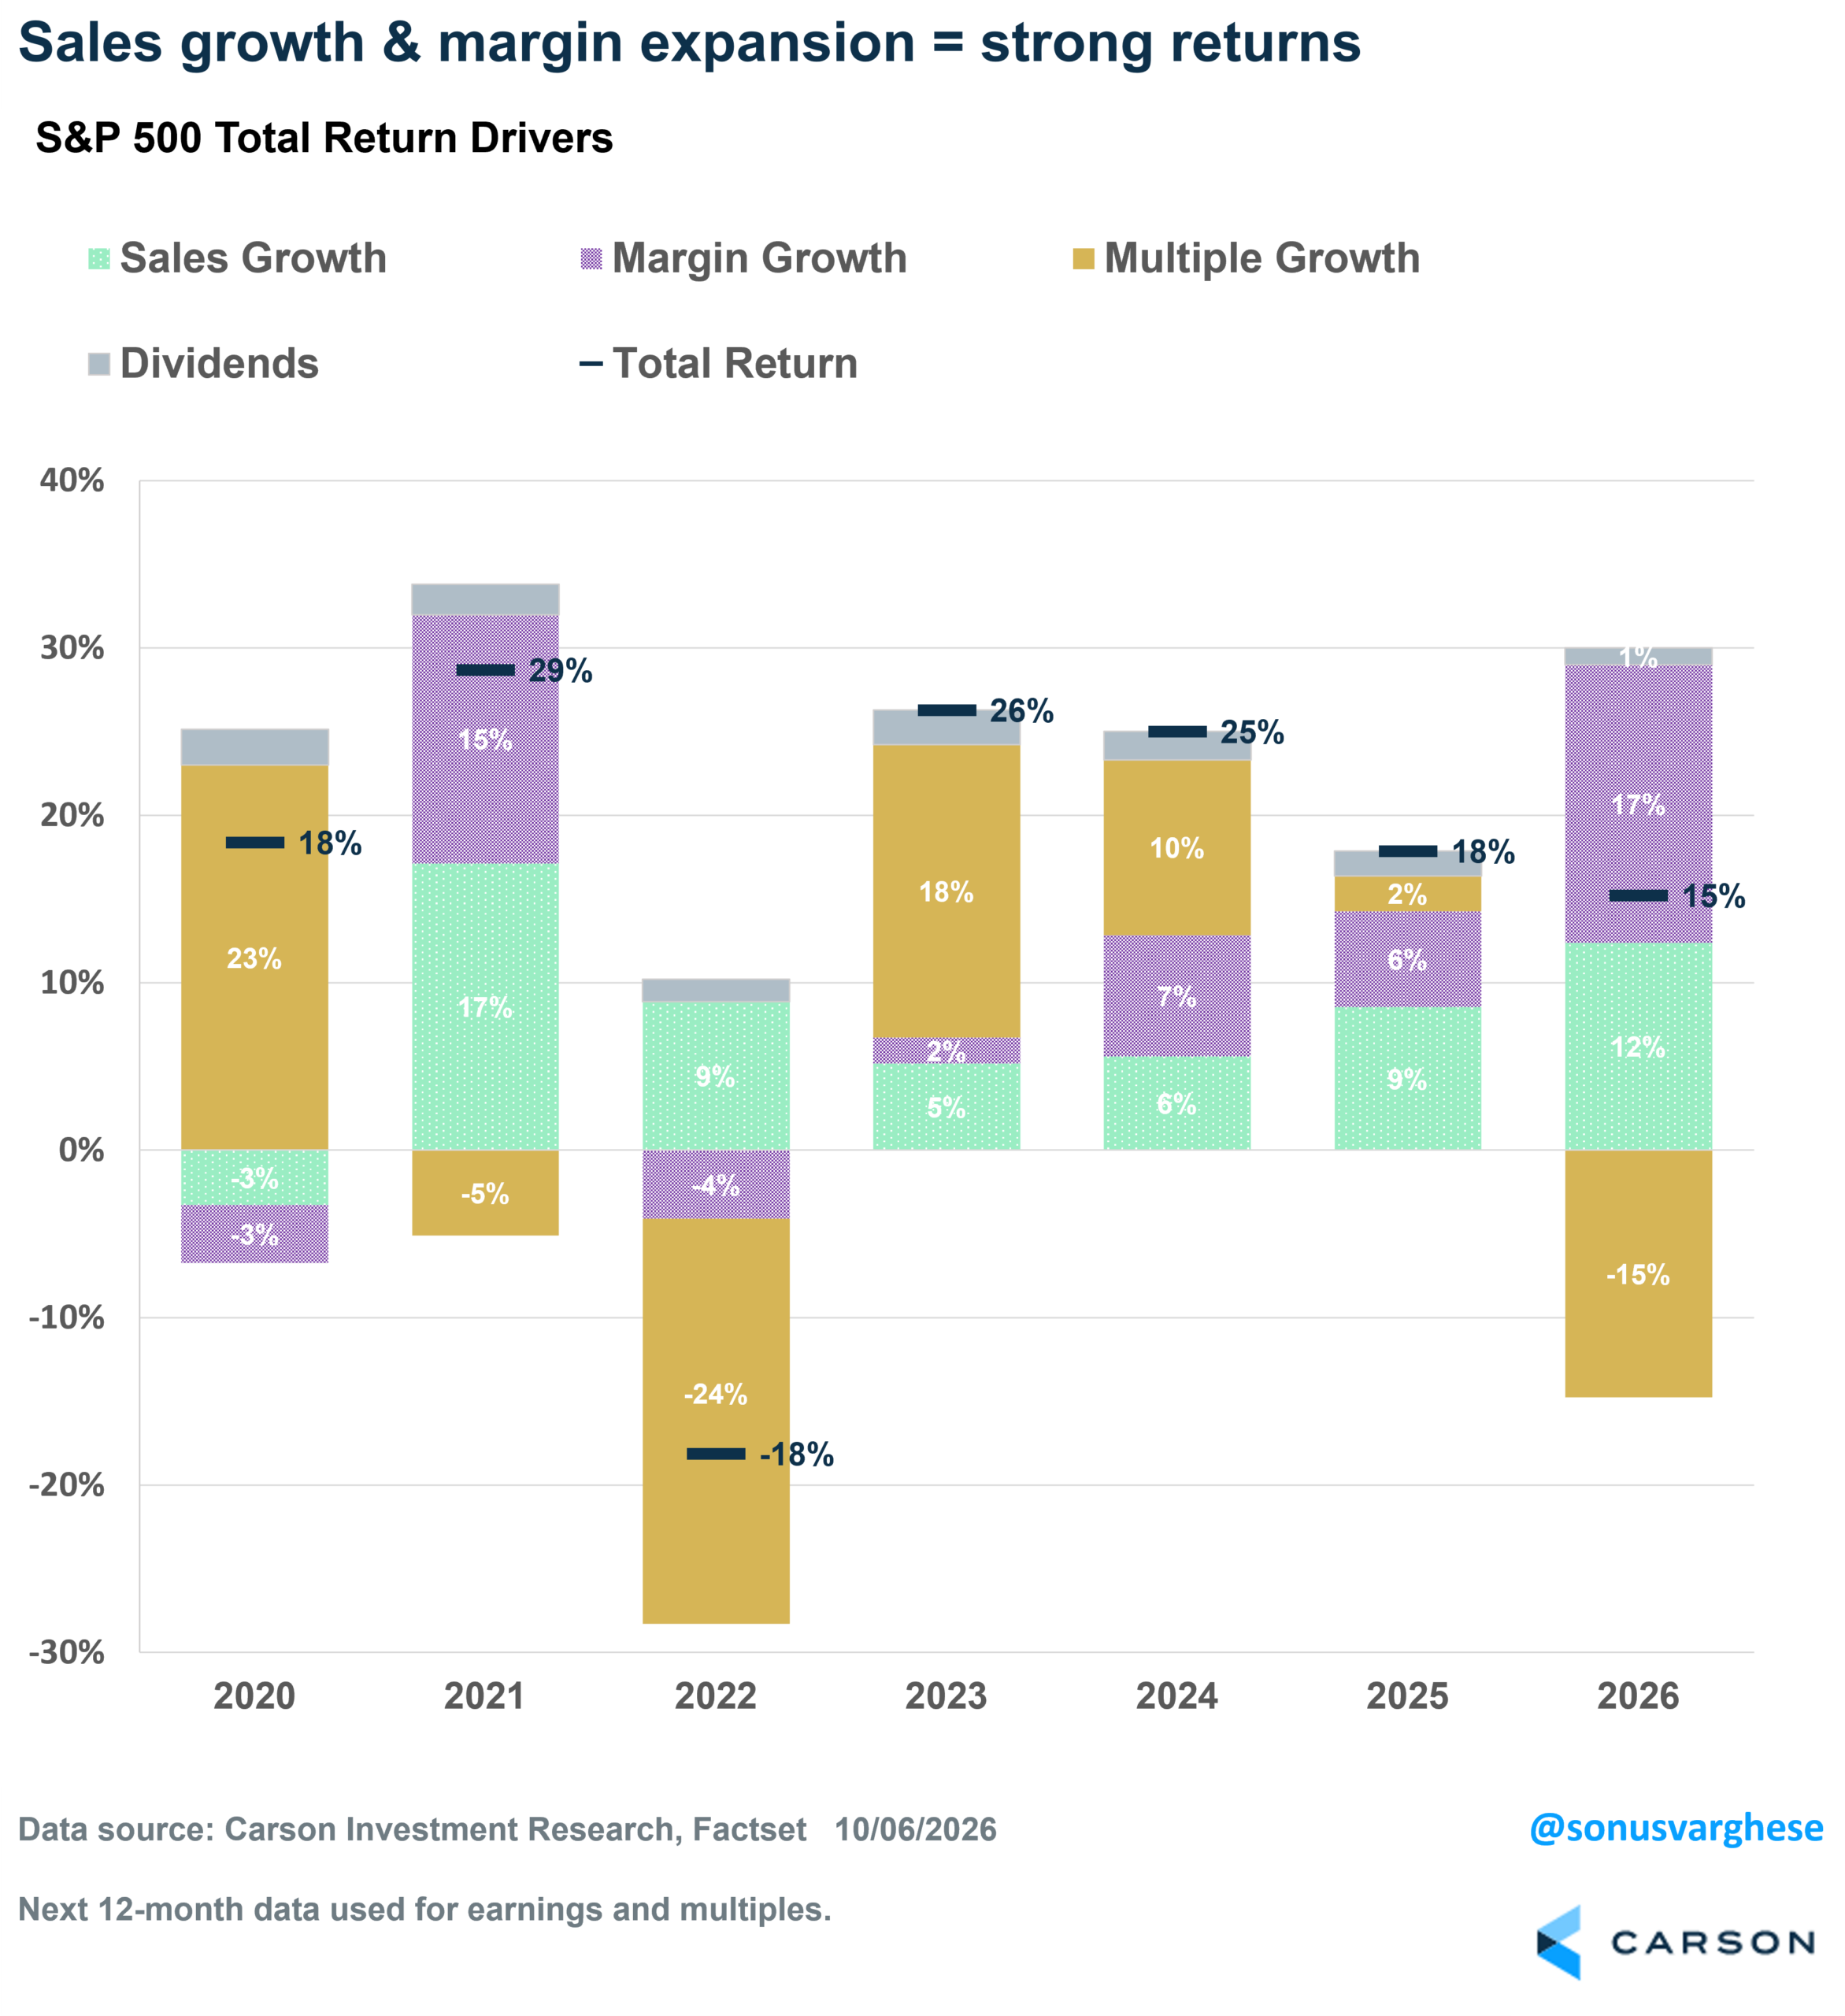
The year-by-year view shows how much the mix moves around:
- 2020’s 18% return was almost entirely multiple expansion, with earnings shrinking
- 2022’s -18% was almost entirely multiple contraction, with earnings still growing
- 2026’s 15% is all profits, with the multiple working against it
Big Picture
This year’s returns are being driven by nominal growth and pricing power. Investors are actually paying less for a future dollar of earnings than they were at the start of the year. Higher yields have taken a big bite out of valuations, and profits have simply overwhelmed that. It’s the healthier composition, but it also means those earnings expectations have to keep being met.
There’s another side to this. The same nominal strength and pricing power behind those margins help keep inflation elevated, and the Fed is hiking. Some economists argue the Fed may ultimately need stocks to cool off for those hikes to bite. That’s a debate I’ll dig into in a future post.
For more content by Sonu Varghese, Chief Macro Strategist, click here.
9170626.1. – 8OCT26A