
U.S. household balance sheets present an increasingly contradictory picture. Americans collectively own more valuable homes, larger retirement accounts, and more financial assets, yet a growing share of families are struggling to meet their monthly obligations. Recent reporting on rising credit balances and persistent delinquencies has highlighted this tension. The Federal Reserve’s October 2026 Survey of Consumer Finances (SCF) provides a longer-term explanation: rising asset values have not translated into stronger cash flow for every household.
But debt levels only tell half the story. Aggregate household debt stood near $18.77 trillion in the second quarter of 2026, according to the New York Fed, with credit card and auto loan balances continuing to grow. A temporary mortgage-reporting disruption distorted the quarter’s reported total. The longer-term SCF offers a useful counterpoint: between 2022 and 2025, the share of families carrying any debt stayed near 77%, while median debt among borrowers was essentially unchanged in inflation-adjusted terms, at approximately $88,100.
The composition of borrowing matters. Among families carrying credit card balances, mean debt rose from $6,700 to $8,000 in real terms, even though the share carrying balances edged down. Mortgage debt among borrowers also increased. Consequently, the concern is not simply that more Americans owe money. It is that some borrowers face larger balances, substantially higher financing costs, and less room in their monthly budgets.
The real warning signs are actually rooted in stress about debt servicing. The SCF finds that the median debt payment-to-income ratio among borrowers increased from 13.4% in 2022 to 15.4% in 2025. The share of families devoting more than 40% of income to debt payments rose from 6.5% to 8.6%, the highest reading since 2010. Most strikingly, families reporting late payments jumped from 12.2% to 19.6%, while those reporting payments at least two months late rose from 4.9% to 8.2%.
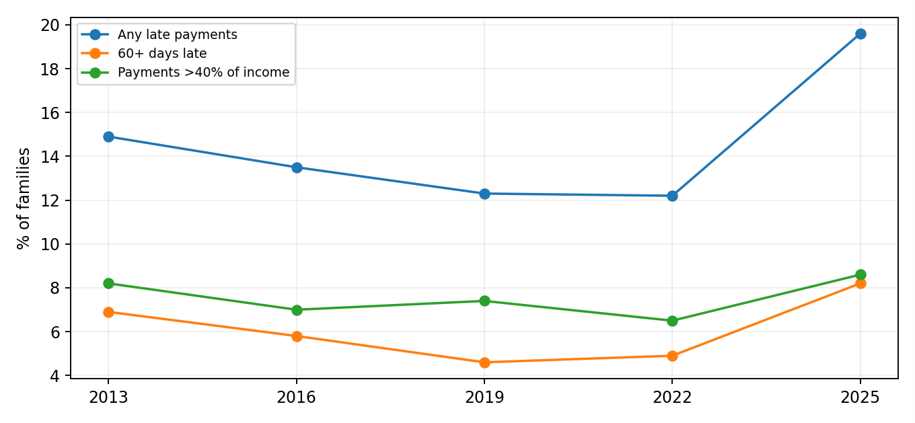
Source: Federal Reserve SCF, Table 5 (p. 30).
These are meaningful increases in financial stress, even though the latest quarterly credit data suggest that some delinquency measures have recently stabilized. The SCF measures families’ reported payment experiences over a multi-year period; quarterly credit bureau data measure a different population and definition of delinquency. Both can be true: financial stress rose sharply through 2025, while the pace of deterioration eased in parts of 2026.

Stay on Top of Market Trends
The Carson Investment Research newsletter offers up-to-date market news, analysis and insights. Subscribe today!
"*" indicates required fields
Everyone first talks about a booming stock market and rising real estate values, but asset growth is not translating to income growth. Real median family net worth rose 2% from 2022 to 2025, reaching $215,900, while mean net worth climbed 7%. Retirement account balances and housing equity benefited from higher asset values. Yet the median balance held in checking, savings, and other transaction accounts fell 6%, to $8,200. That contrast matters: households cannot routinely pay credit card bills or mortgage installments with unrealized appreciation in their homes or retirement portfolios.
The Fed’s data also show a declining median leverage ratio, reflecting the growth in asset values relative to debt. At the same time, aggregate debt-to-income increased from 89.4% to 94.9%. In other words, families may appear safer on a balance-sheet basis while becoming more constrained on a cash-flow basis. Higher interest rates compound that problem by raising the cost of revolving credit and new borrowing.
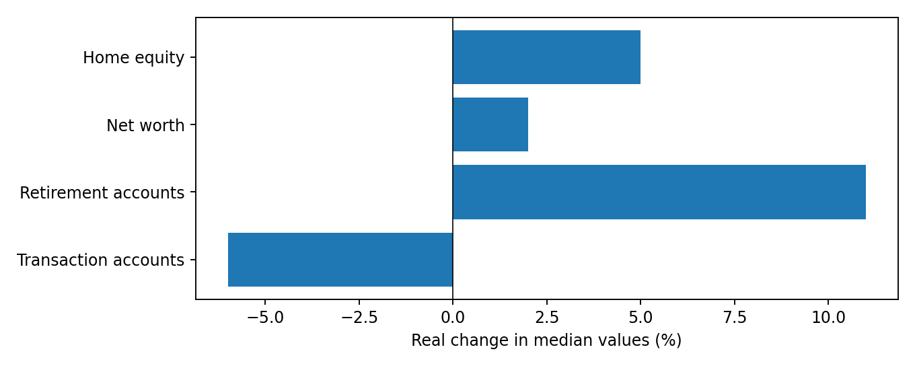
Source: SCF, Tables 2–3.
The gains in household wealth have not been evenly distributed. Median net worth fell 6% among families in the lowest income quintile, but increased 31% among families in the highest income decile. Families under age 35 experienced a 23% decline in median net worth, while those age 75 and older saw a 37% increase. These differences help explain why strong aggregate spending can coexist with widespread household financial strain.
The SCF’s new spending data underscore the point: the highest income decile accounted for 28.5% of measured nonhousing spending, versus 7.2% for the bottom income quintile. A relatively small group of financially secure consumers can therefore sustain headline consumption even as lower-income households pull back on discretionary purchases, borrow more expensively, or fall behind on payments.

Source: SCF, Table 2 (p. 12).
Housing adds another pressure point. An illustrative payment on an 80%-financed median-priced home, including property taxes, increased from 26% of median family income in 2022 to 33% in 2025. Higher home values support existing owners’ wealth, but make entry into homeownership more difficult for younger families and those without substantial savings.
For investors and their advisors, the key question is whether rising debt-service pressure remains concentrated among financially vulnerable borrowers or spreads into the broader consumer economy. New delinquency transitions, revolving credit utilization, liquid savings, and employment trends deserve more attention than the headline dollar amount of household debt alone. Credit performance among lower-income and subprime borrowers may provide an early signal of weakening consumption.
The central takeaway is that household wealth and household financial health are not interchangeable. Rising asset prices have improved aggregate net worth, but they have not insulated every family from higher financing costs and shrinking liquidity. As long as employment and higher-income spending remain resilient, consumer activity may hold up. A weakening labor market, however, could expose the growing gap between wealth on paper and the ability to pay bills on time. A good advisor looks at both sides of the asset-income coin when building a comprehensive financial plan.
By Michael Barczak, VP, Investment Due Diligence
9174775.1. – 12OCT26A