
We just got the latest read on the Fed’s preferred inflation metric, the personal consumption expenditures (PCE) index. This was an important release because the Bureau of Economic Analysis revised its PCE methodology, most notably replacing market-price-sensitive measures for portfolio management services with an employment-based approach that better captures the underlying quantity of services provided (instead of tracking stock prices). The PCE also revised price measures for legal services and computer software/accessories. The changes were retroactive to 2021 and revised inflation meaningfully lower, with July headline and core inflation each cut about 0.3 percentage points year over year, from 3.7% to 3.4% and 3.3% to 3.0%, respectively. There’s no real conspiracy here, and as we’ll see, inflation’s hot no matter how you slice and dice the data.
The latest PCE data is as of August, so it doesn’t reflect the recent surge in gasoline and diesel prices – we’ve got to wait another month for that. Still, headline PCE rose 0.3% in August (3.8% annualized) and is up 3.4% from a year ago. Core PCE, the Fed’s preferred gauge of underlying inflation, was hot too, rising 0.25% in August (3.0% annualized) and 3.0% over the past year. The six-month annualized pace is 2.7%.
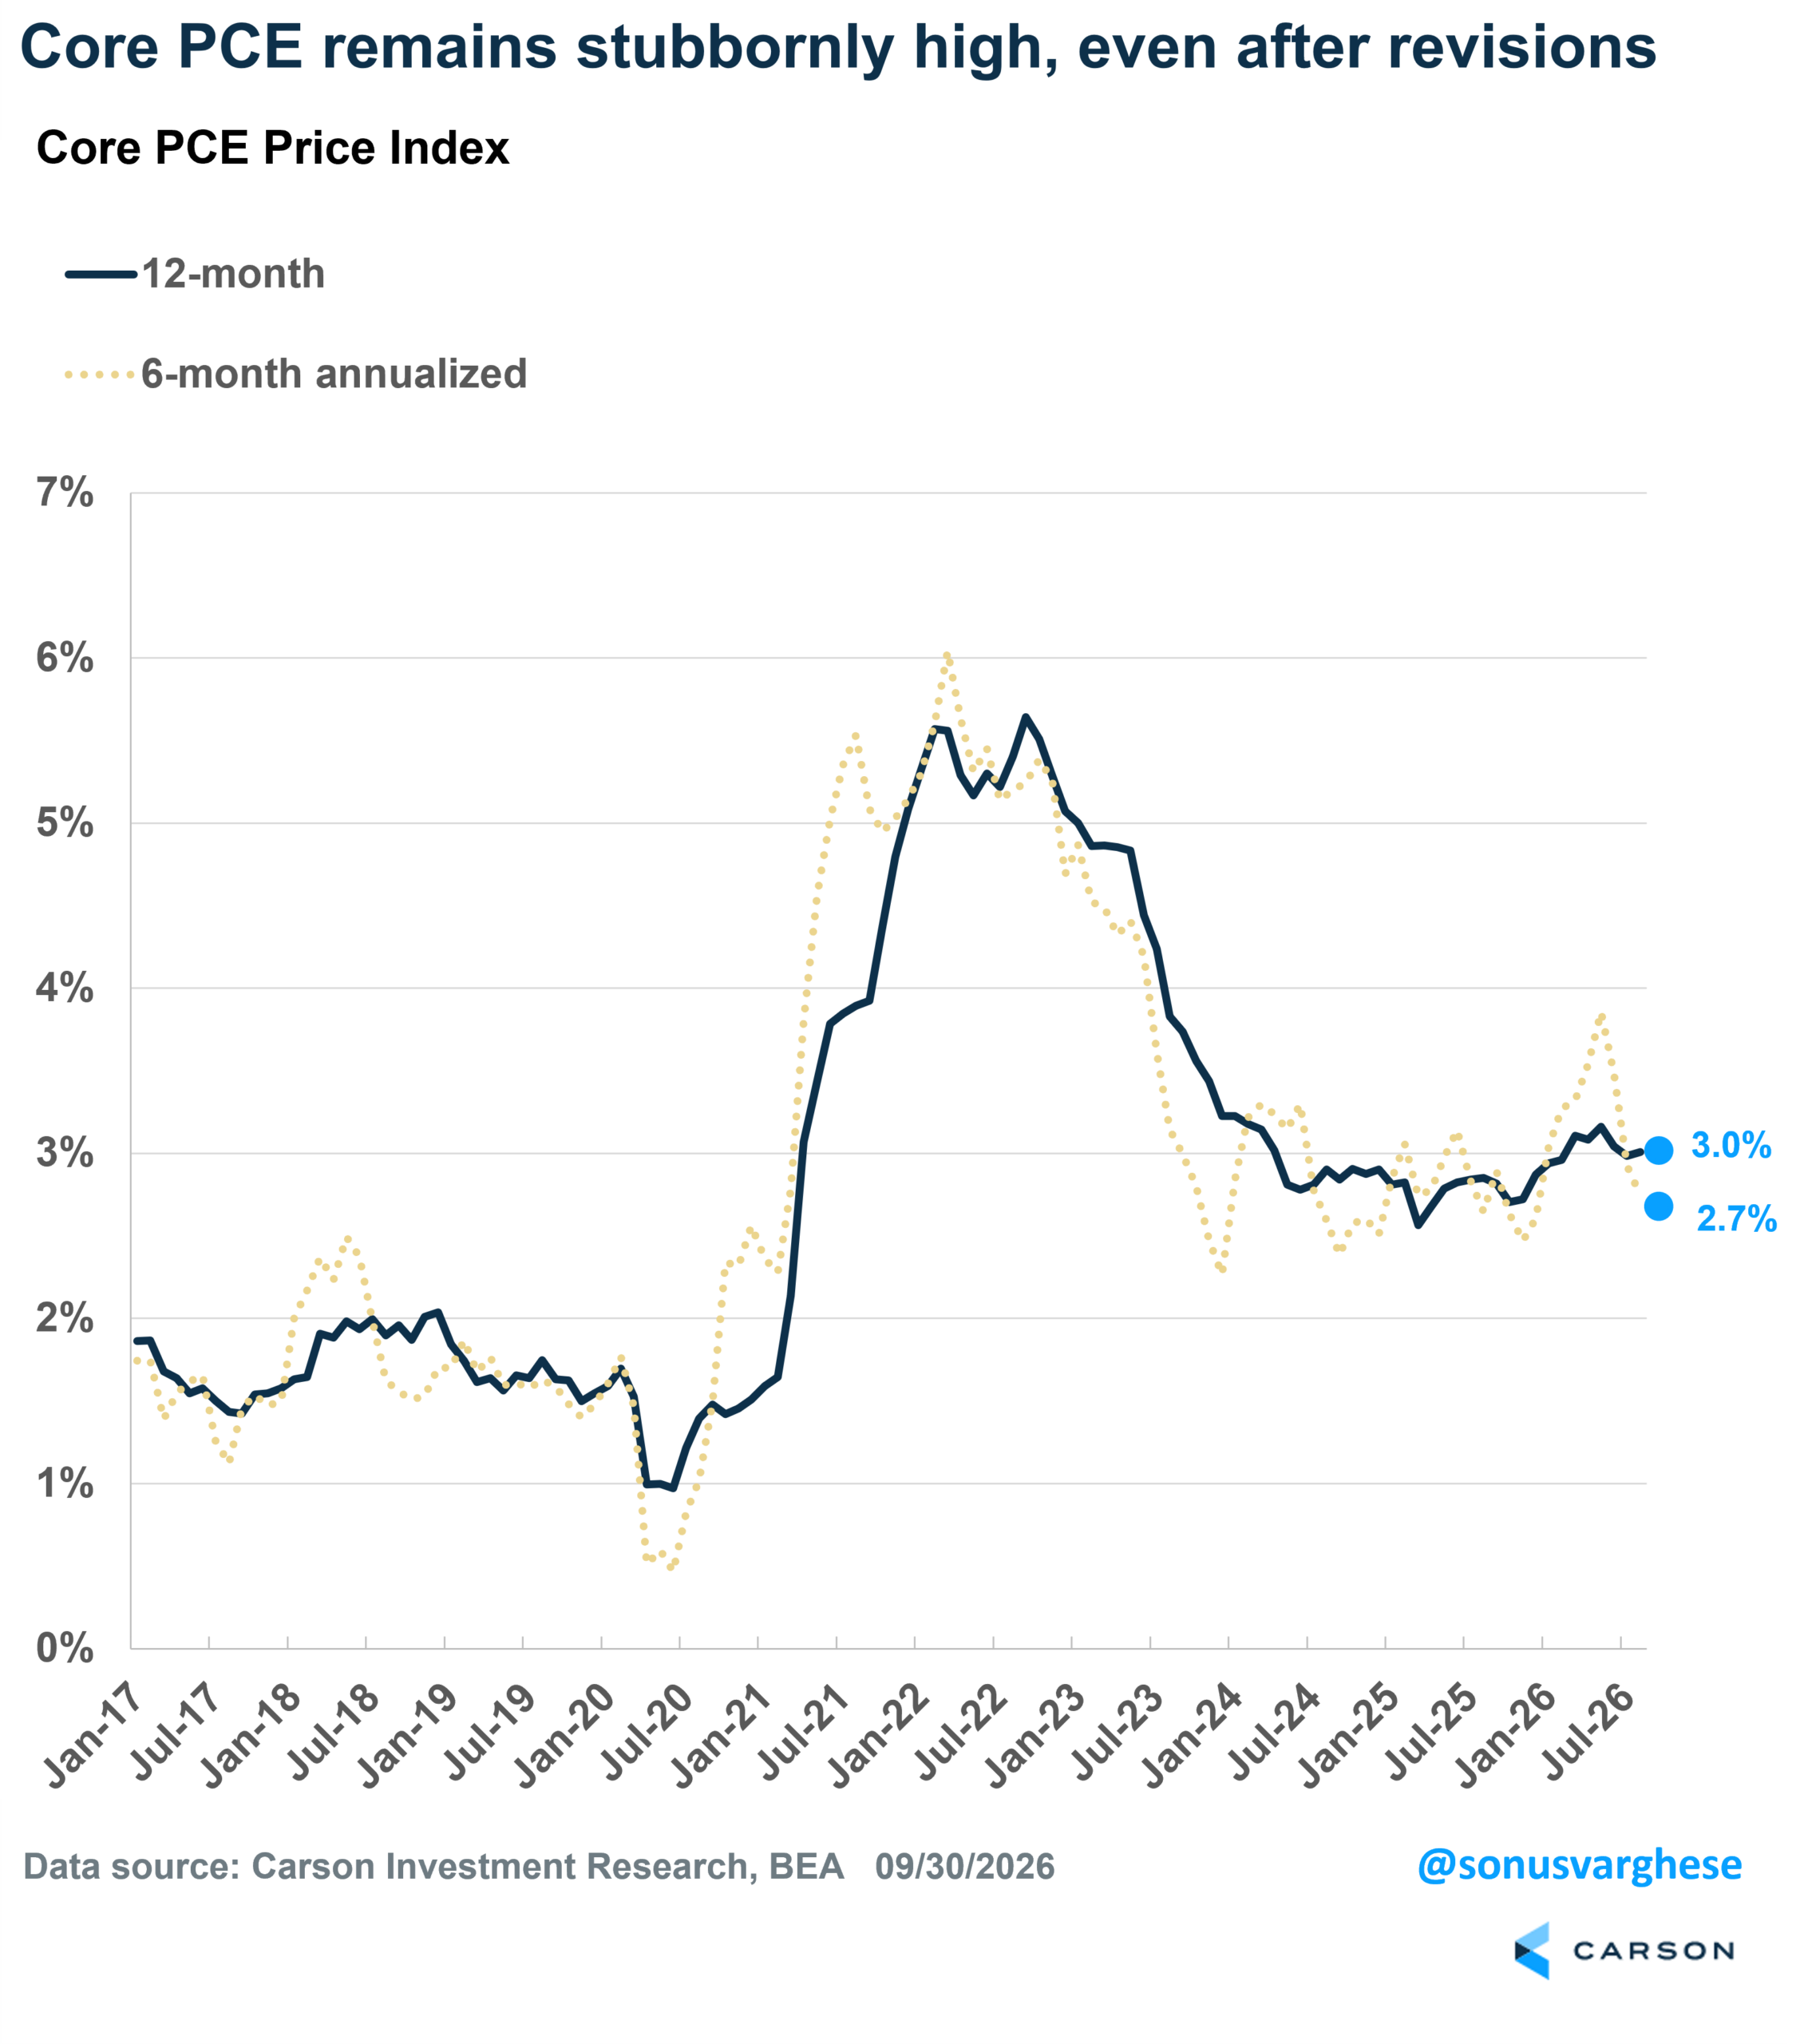
It’s obvious inflation’s running hot, but there’s plenty of confusion because core consumer price index (CPI) inflation is softer than core PCE. Core CPI is up just 2.4% from a year ago and usually gets more headlines, even though the Fed has used PCE as its inflation gauge since 2000. PCE is broader, accounts for substitution as spending habits change, and older data can be revised. Another big difference is shelter: 42% of core CPI versus only 17% of core PCE.

Stay on Top of Market Trends
The Carson Investment Research newsletter offers up-to-date market news, analysis and insights. Subscribe today!
"*" indicates required fields
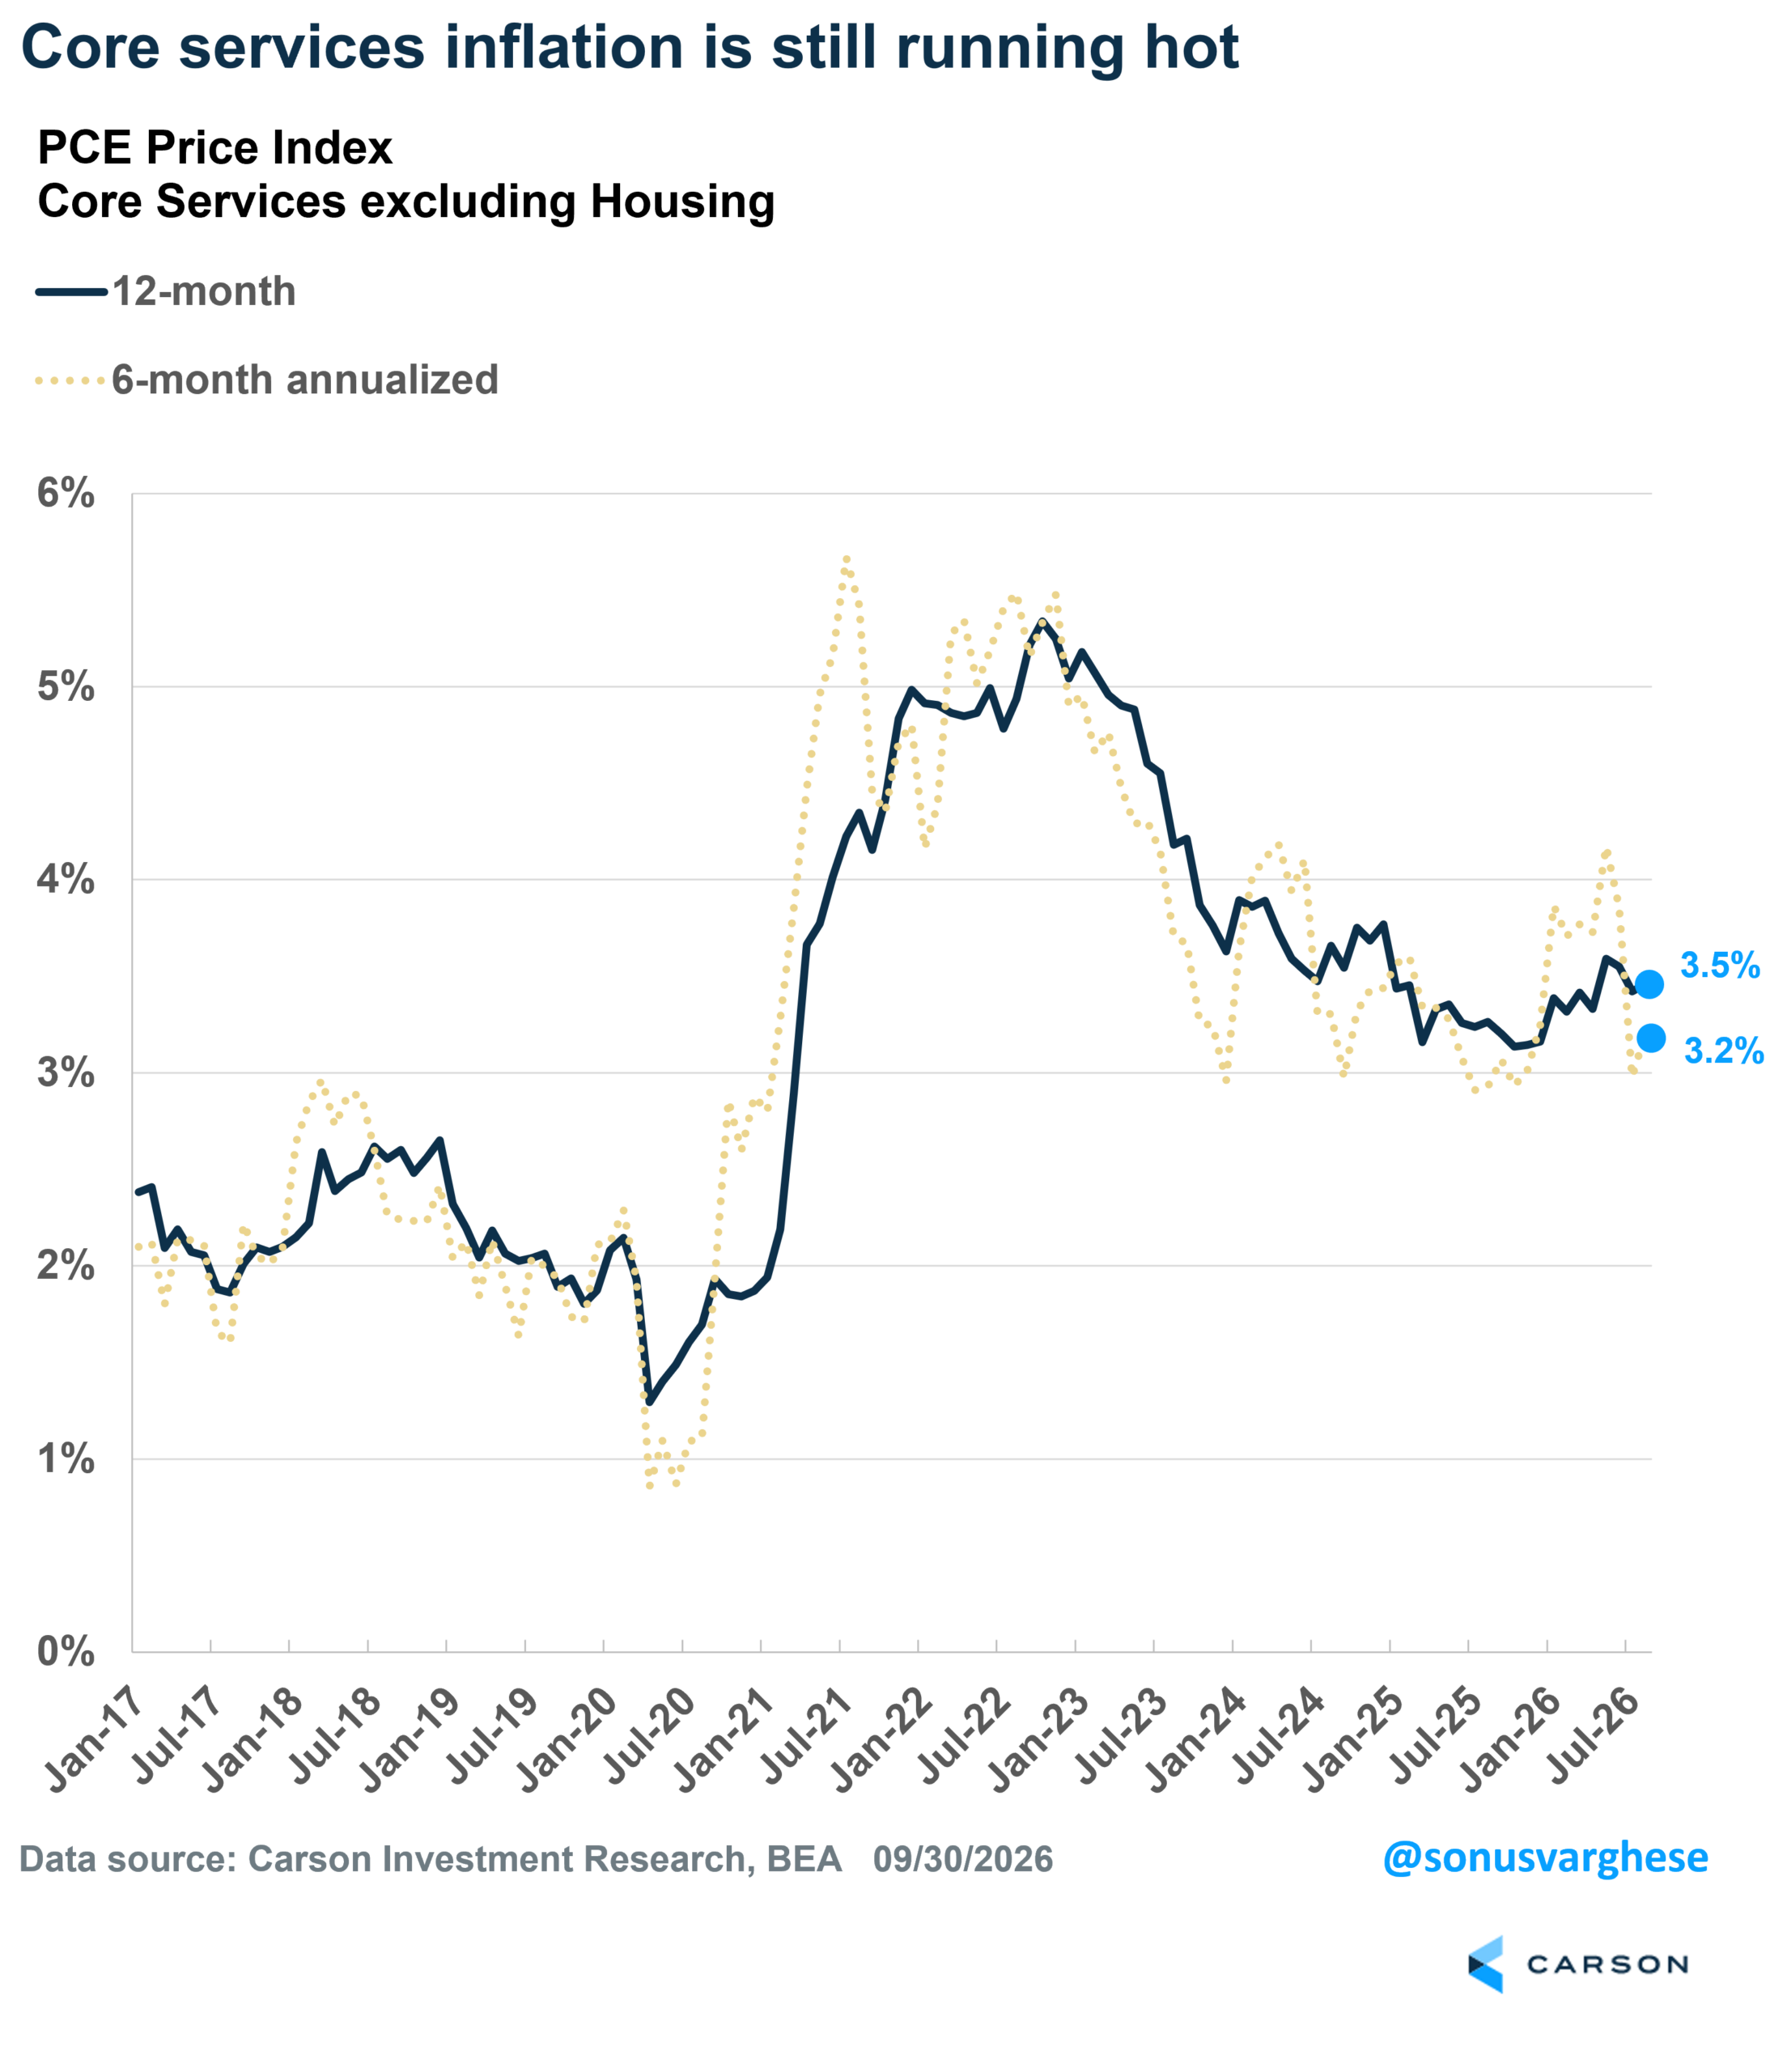
One knock against these elevated PCE readings is that tariff-impacted goods inflation and elevated computer software inflation are pushing core PCE higher. The argument is that tariff inflation should fade, and computer software prices weren’t being measured correctly; the latter was addressed in the methodology update. I’d argue tariffs don’t hit all at once, as companies pass higher import duties to consumers over time, making the impact more persistent. And the AI capex boom itself is inflationary, so focusing on the exact approach to measuring software prices misses the forest for the trees. Even excluding these, along with energy, food, and housing, inflation remains elevated. Core services excluding housing rose at a 4.4% annualized pace in August, is up 3.2% annualized over the past six months, and 3.5% over the past year. For comparison, here’s how it ran during the meat of the last three expansion cycles (all annualized):
- 1995-1999: 2.5%
- 2003-2007: 3.4%
- 2017-2019: 2.2% (2010-2019: 2.1%)
The current pace is well above what we saw previously (except for 2003-2007, which I’ll get to below).
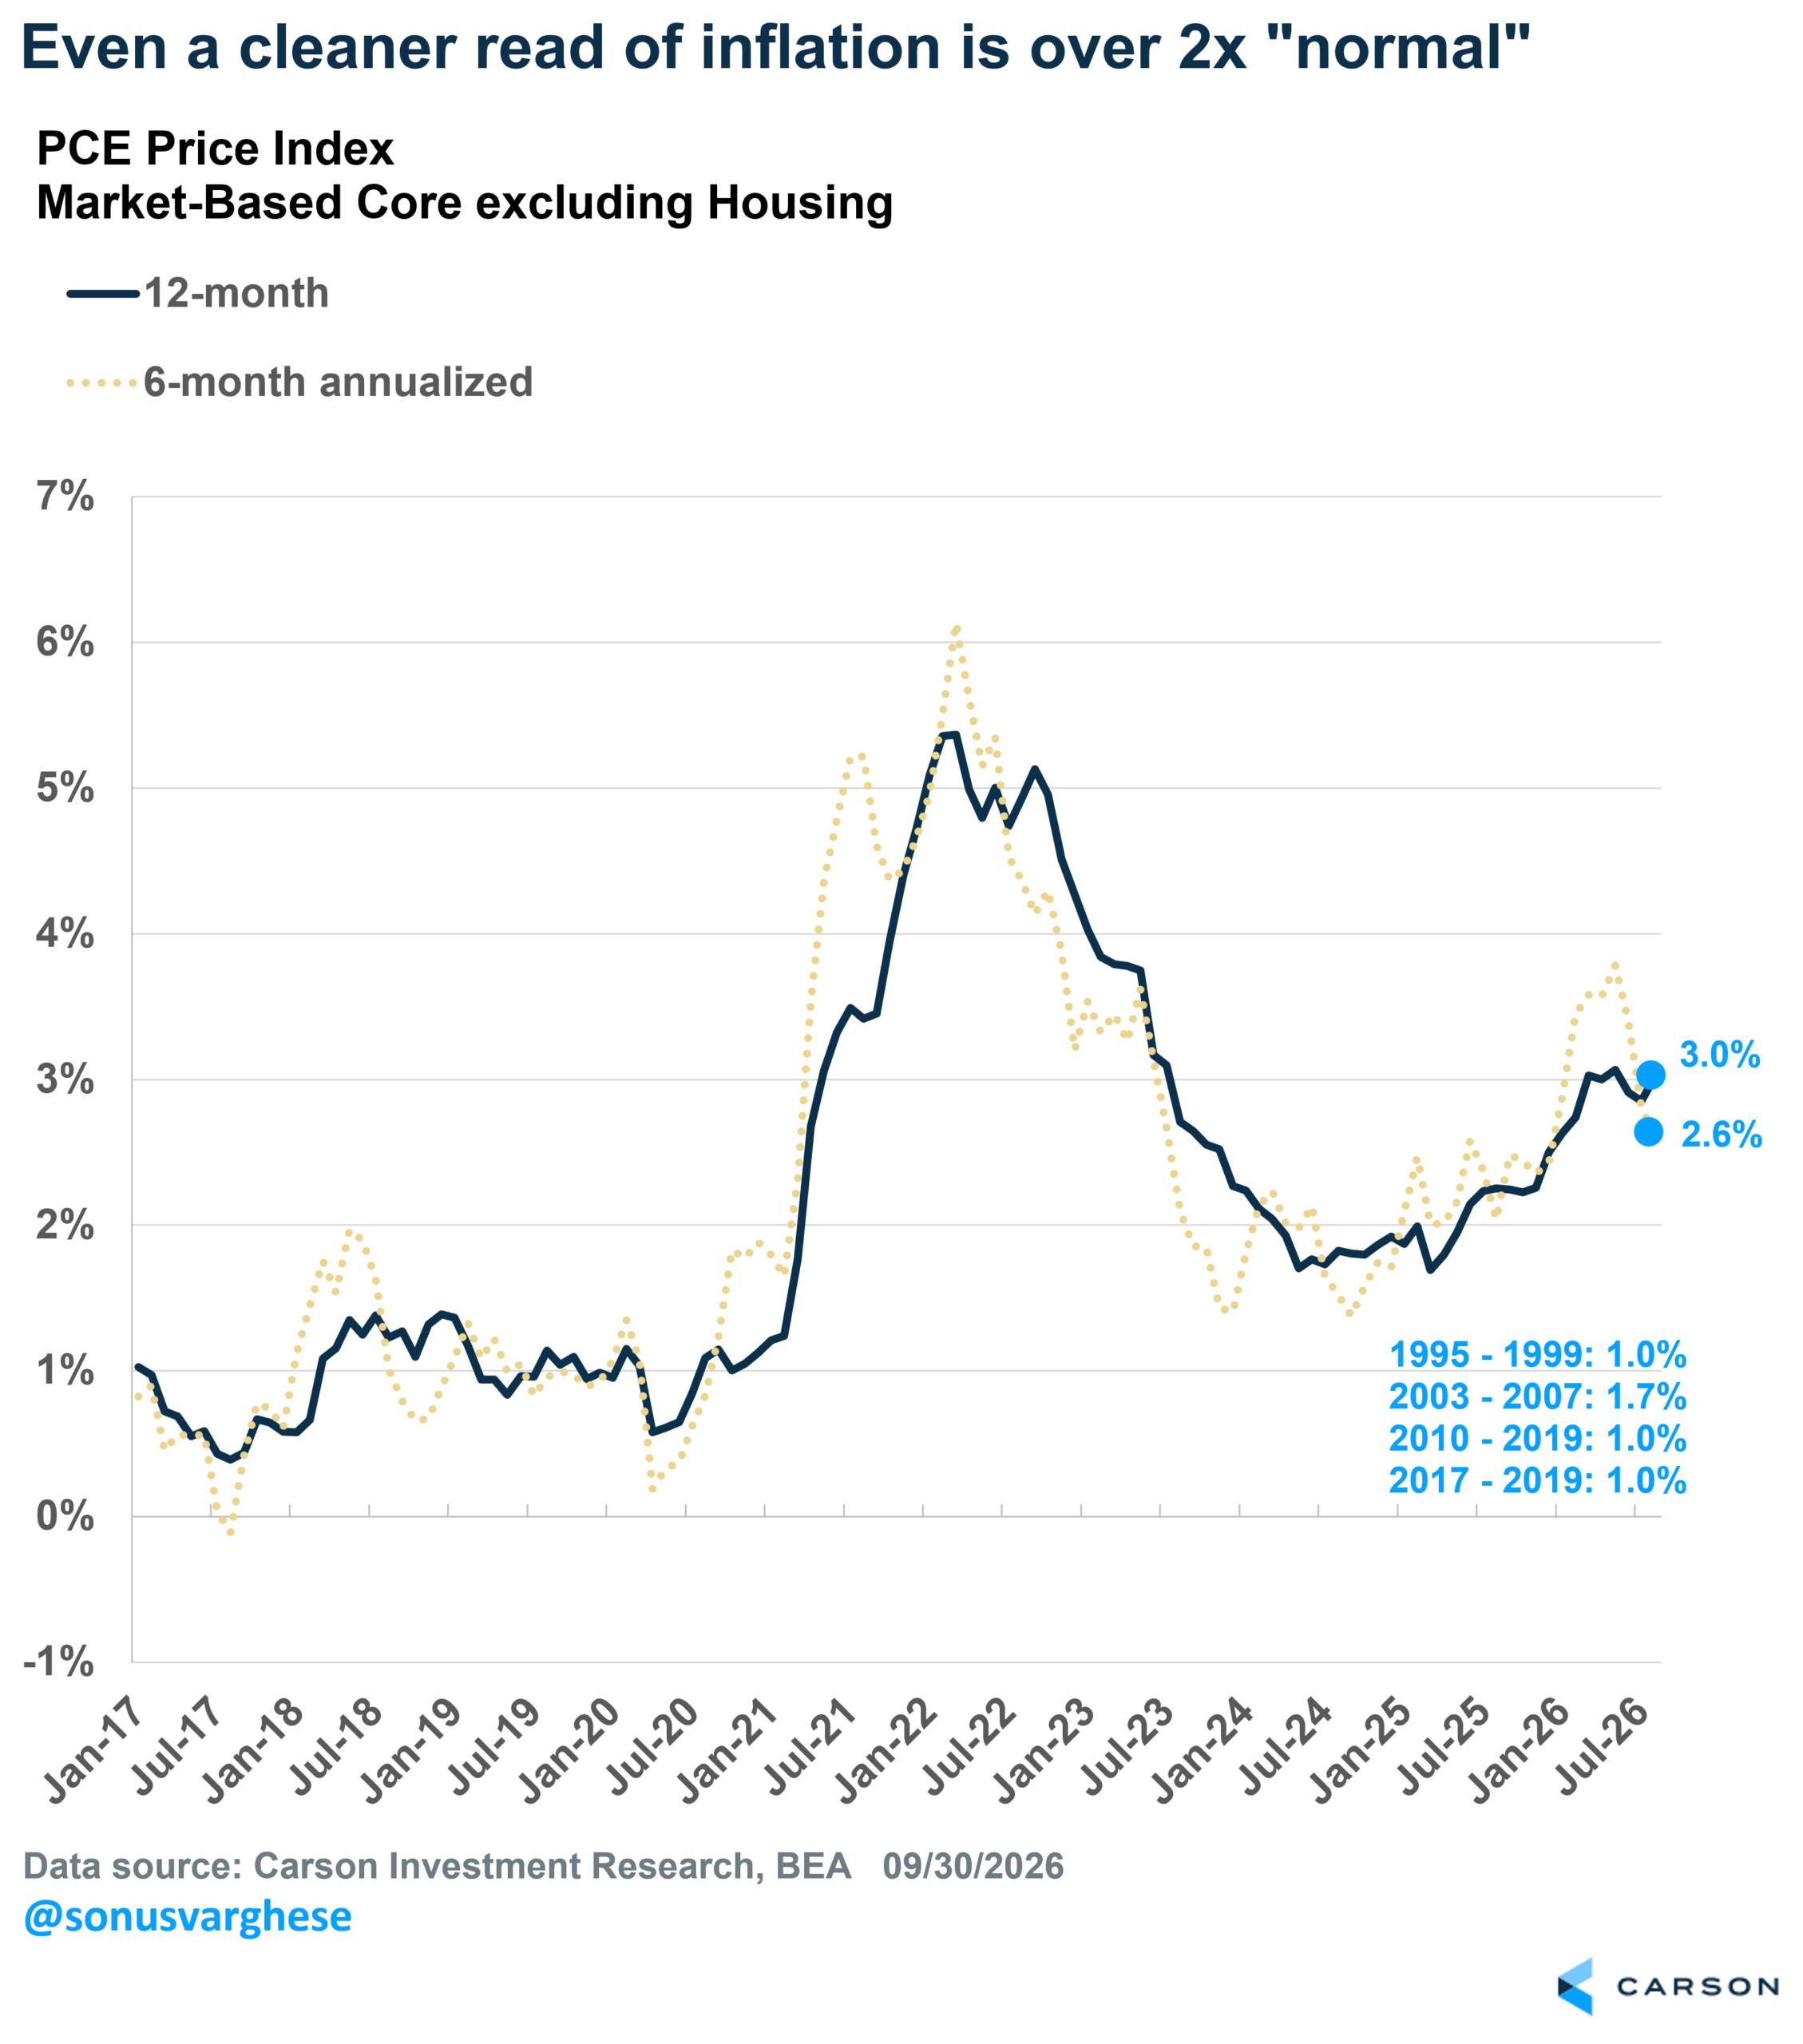
Some would argue even this cut isn’t right because several prices aren’t observed in ordinary transactions between businesses and consumers. That’s where “market-based” PCE comes in: it strips out components whose prices aren’t directly observed in market transactions. Market-based core services excluding housing is up 2.6% annualized over the past six months and 3.0% over the past year. Here’s how this measure ran during prior expansions:
- 1995-1999: 1.0%
- 2003-2007: 1.7%
- 2017-2019: 1.0% (2010-2019: 1.0%)
Suffice it to say, we’re nowhere close to “normal”, with the current pace more than twice what we’ve seen in the past.
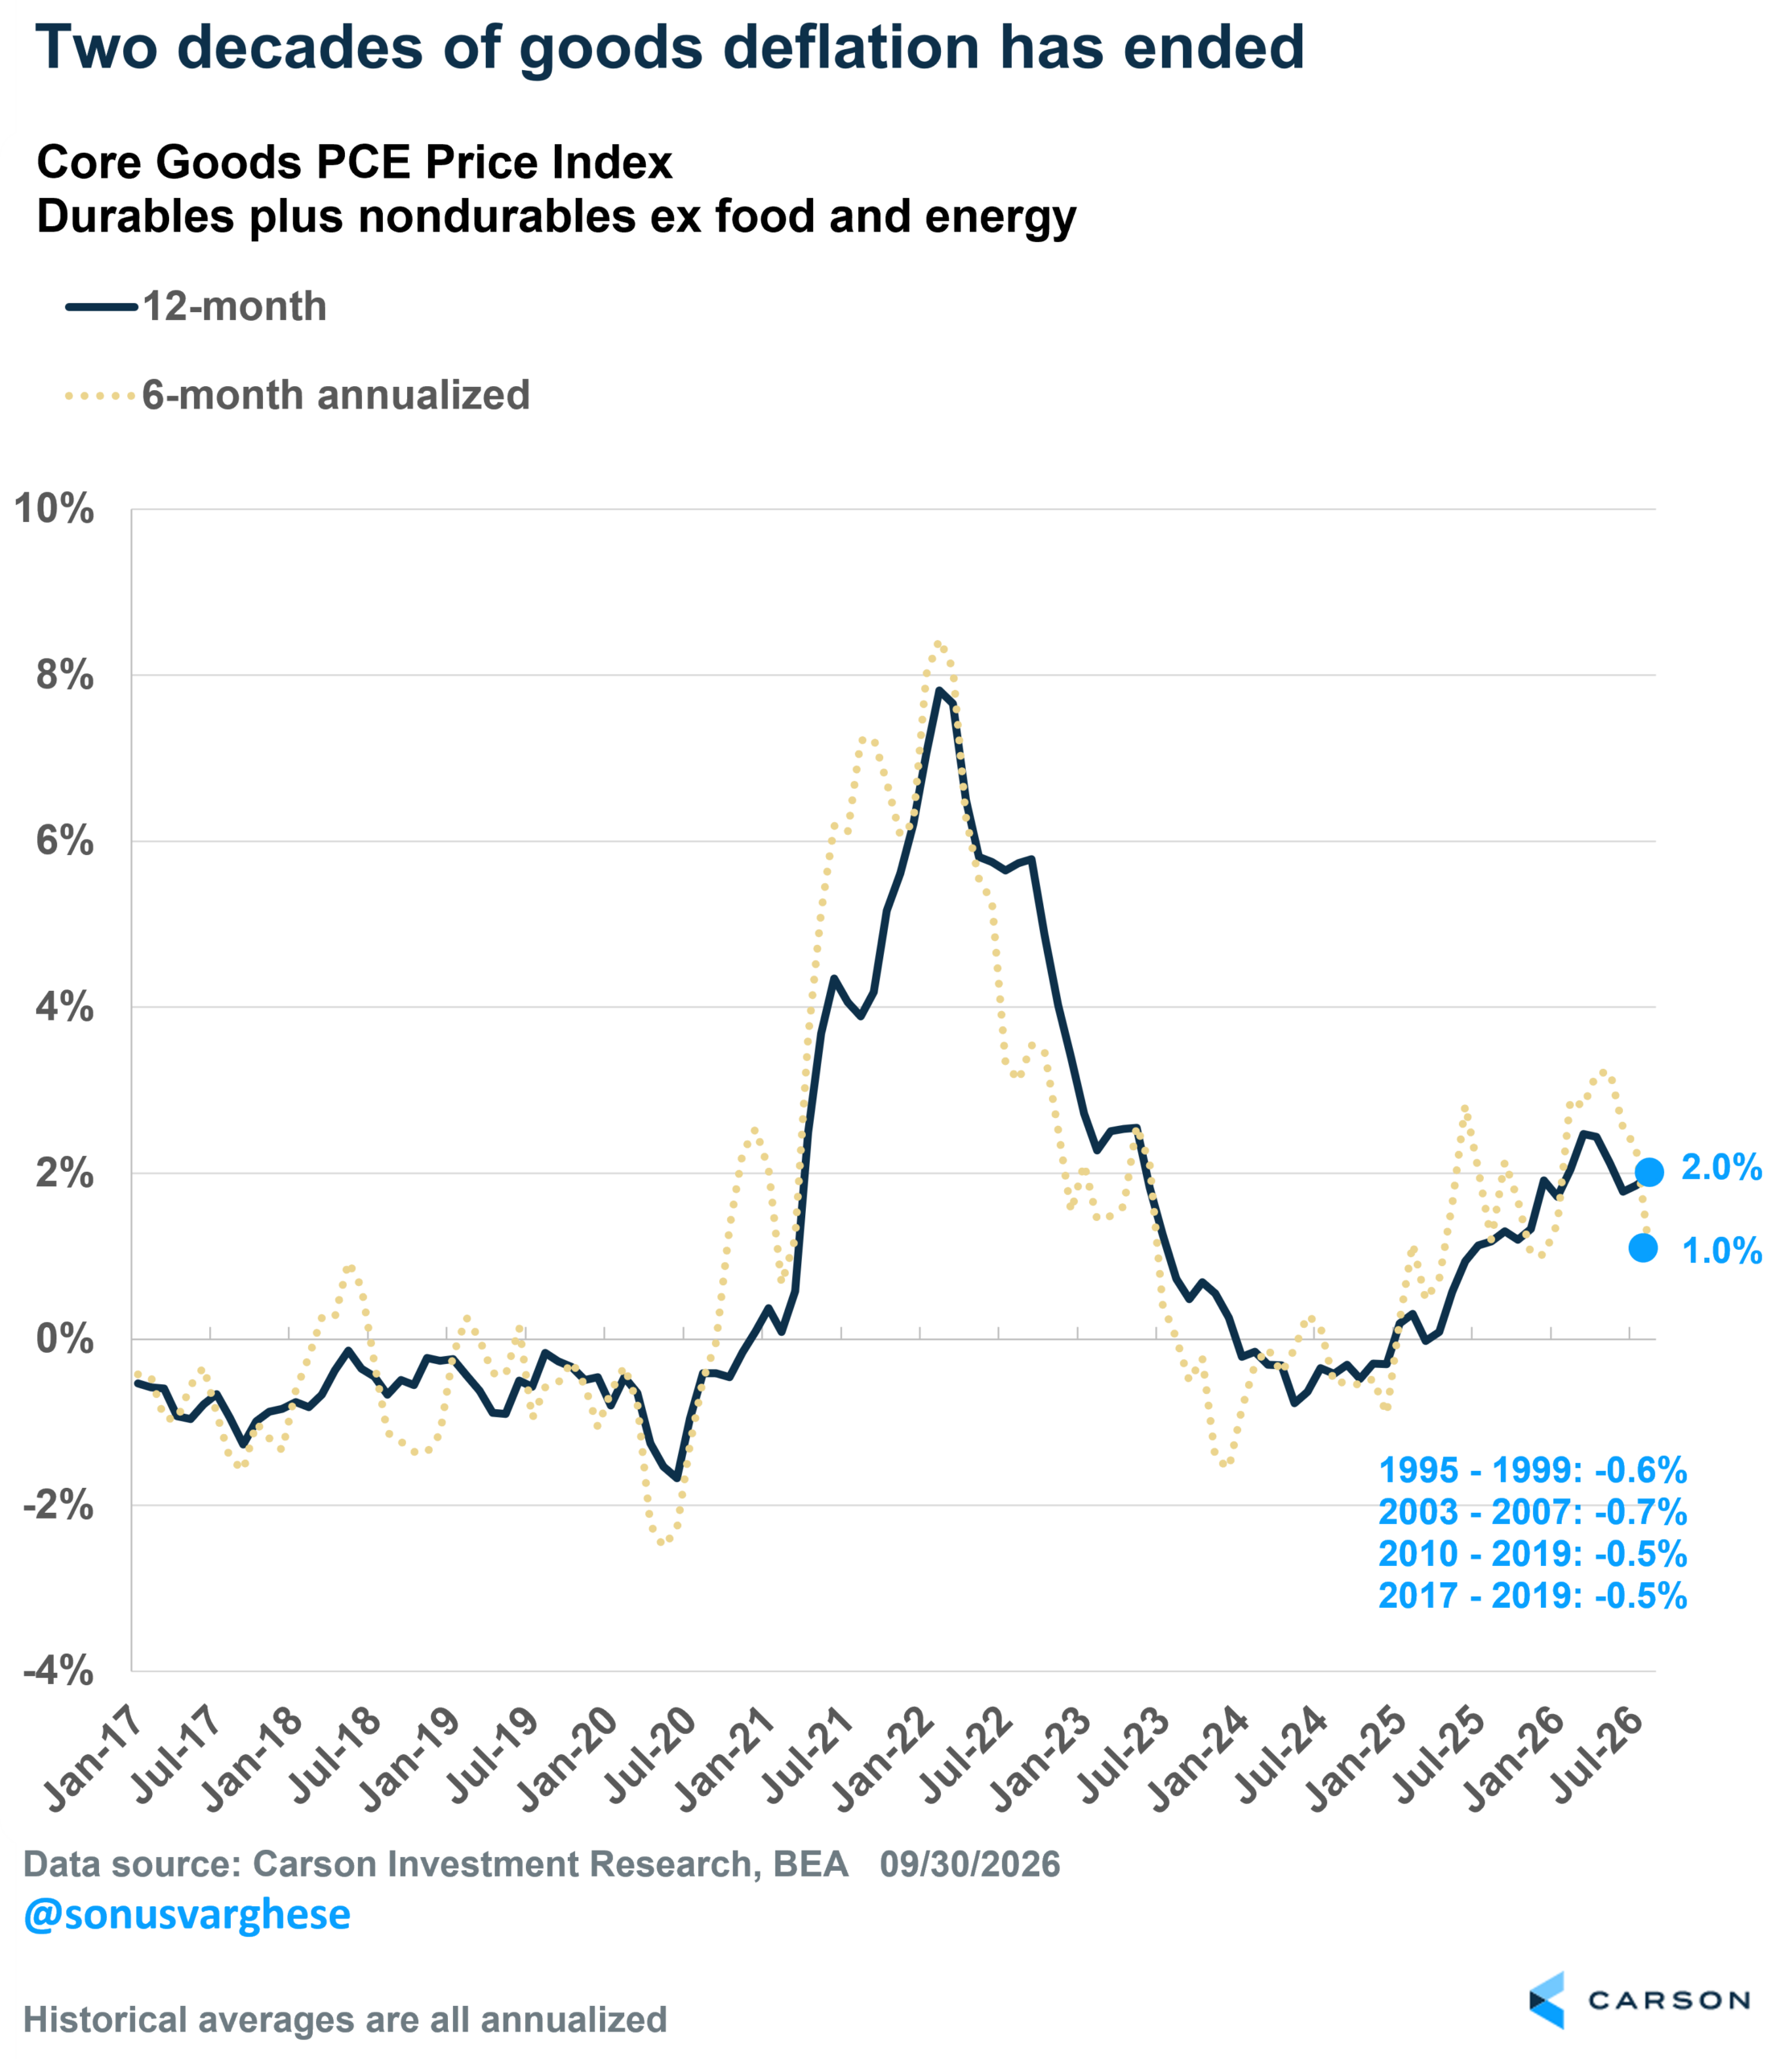
It would be one thing if core services were running hot while core goods prices were falling, as they were over the 25 years before 2021. That’s why core PCE averaged 2.1% annualized from 2003-2007, even as core services ex housing ran at 3.4%: core goods inflation was -0.7%, providing an offset. That’s not the case today, thanks to tariffs and AI-related bottlenecks. Core goods PCE is up 1% annualized over the past six months and 2% over the past year. That may not sound like much, but it’s a big shift from a deflationary environment and doesn’t offset elevated services inflation.
Breadth of Inflation Still Concerning
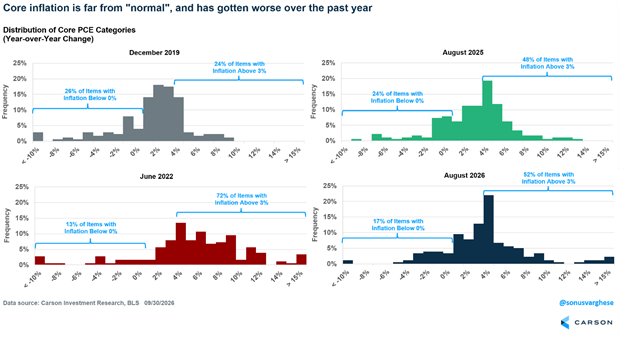
Beyond aggregate inflation data, it’s useful to look at the distribution of inflation across components. I looked at 178 items within the core PCE basket and calculated the distribution of year-over-year inflation at four points in time. Inflation broadened dramatically by June 2022 relative to December 2019. It narrowed through last year, but never fully normalized, and over the past year things have worsened again. That breadth matters because it tells us whether the problem is isolated or widespread. Here’s the proportion of items with inflation above 3% (above 4% in parentheses):
- December 2019: 24% with 3%+ inflation (10% with 4%+ inflation)
- June 2022: 72% (58%)
- August 2025: 48% (28%)
- August 2026: 52% (30%)
Fed Chair Warsh also cited this breadth data in his Jackson Hole speech last month, describing price pressures as widespread rather than isolated to a few categories.
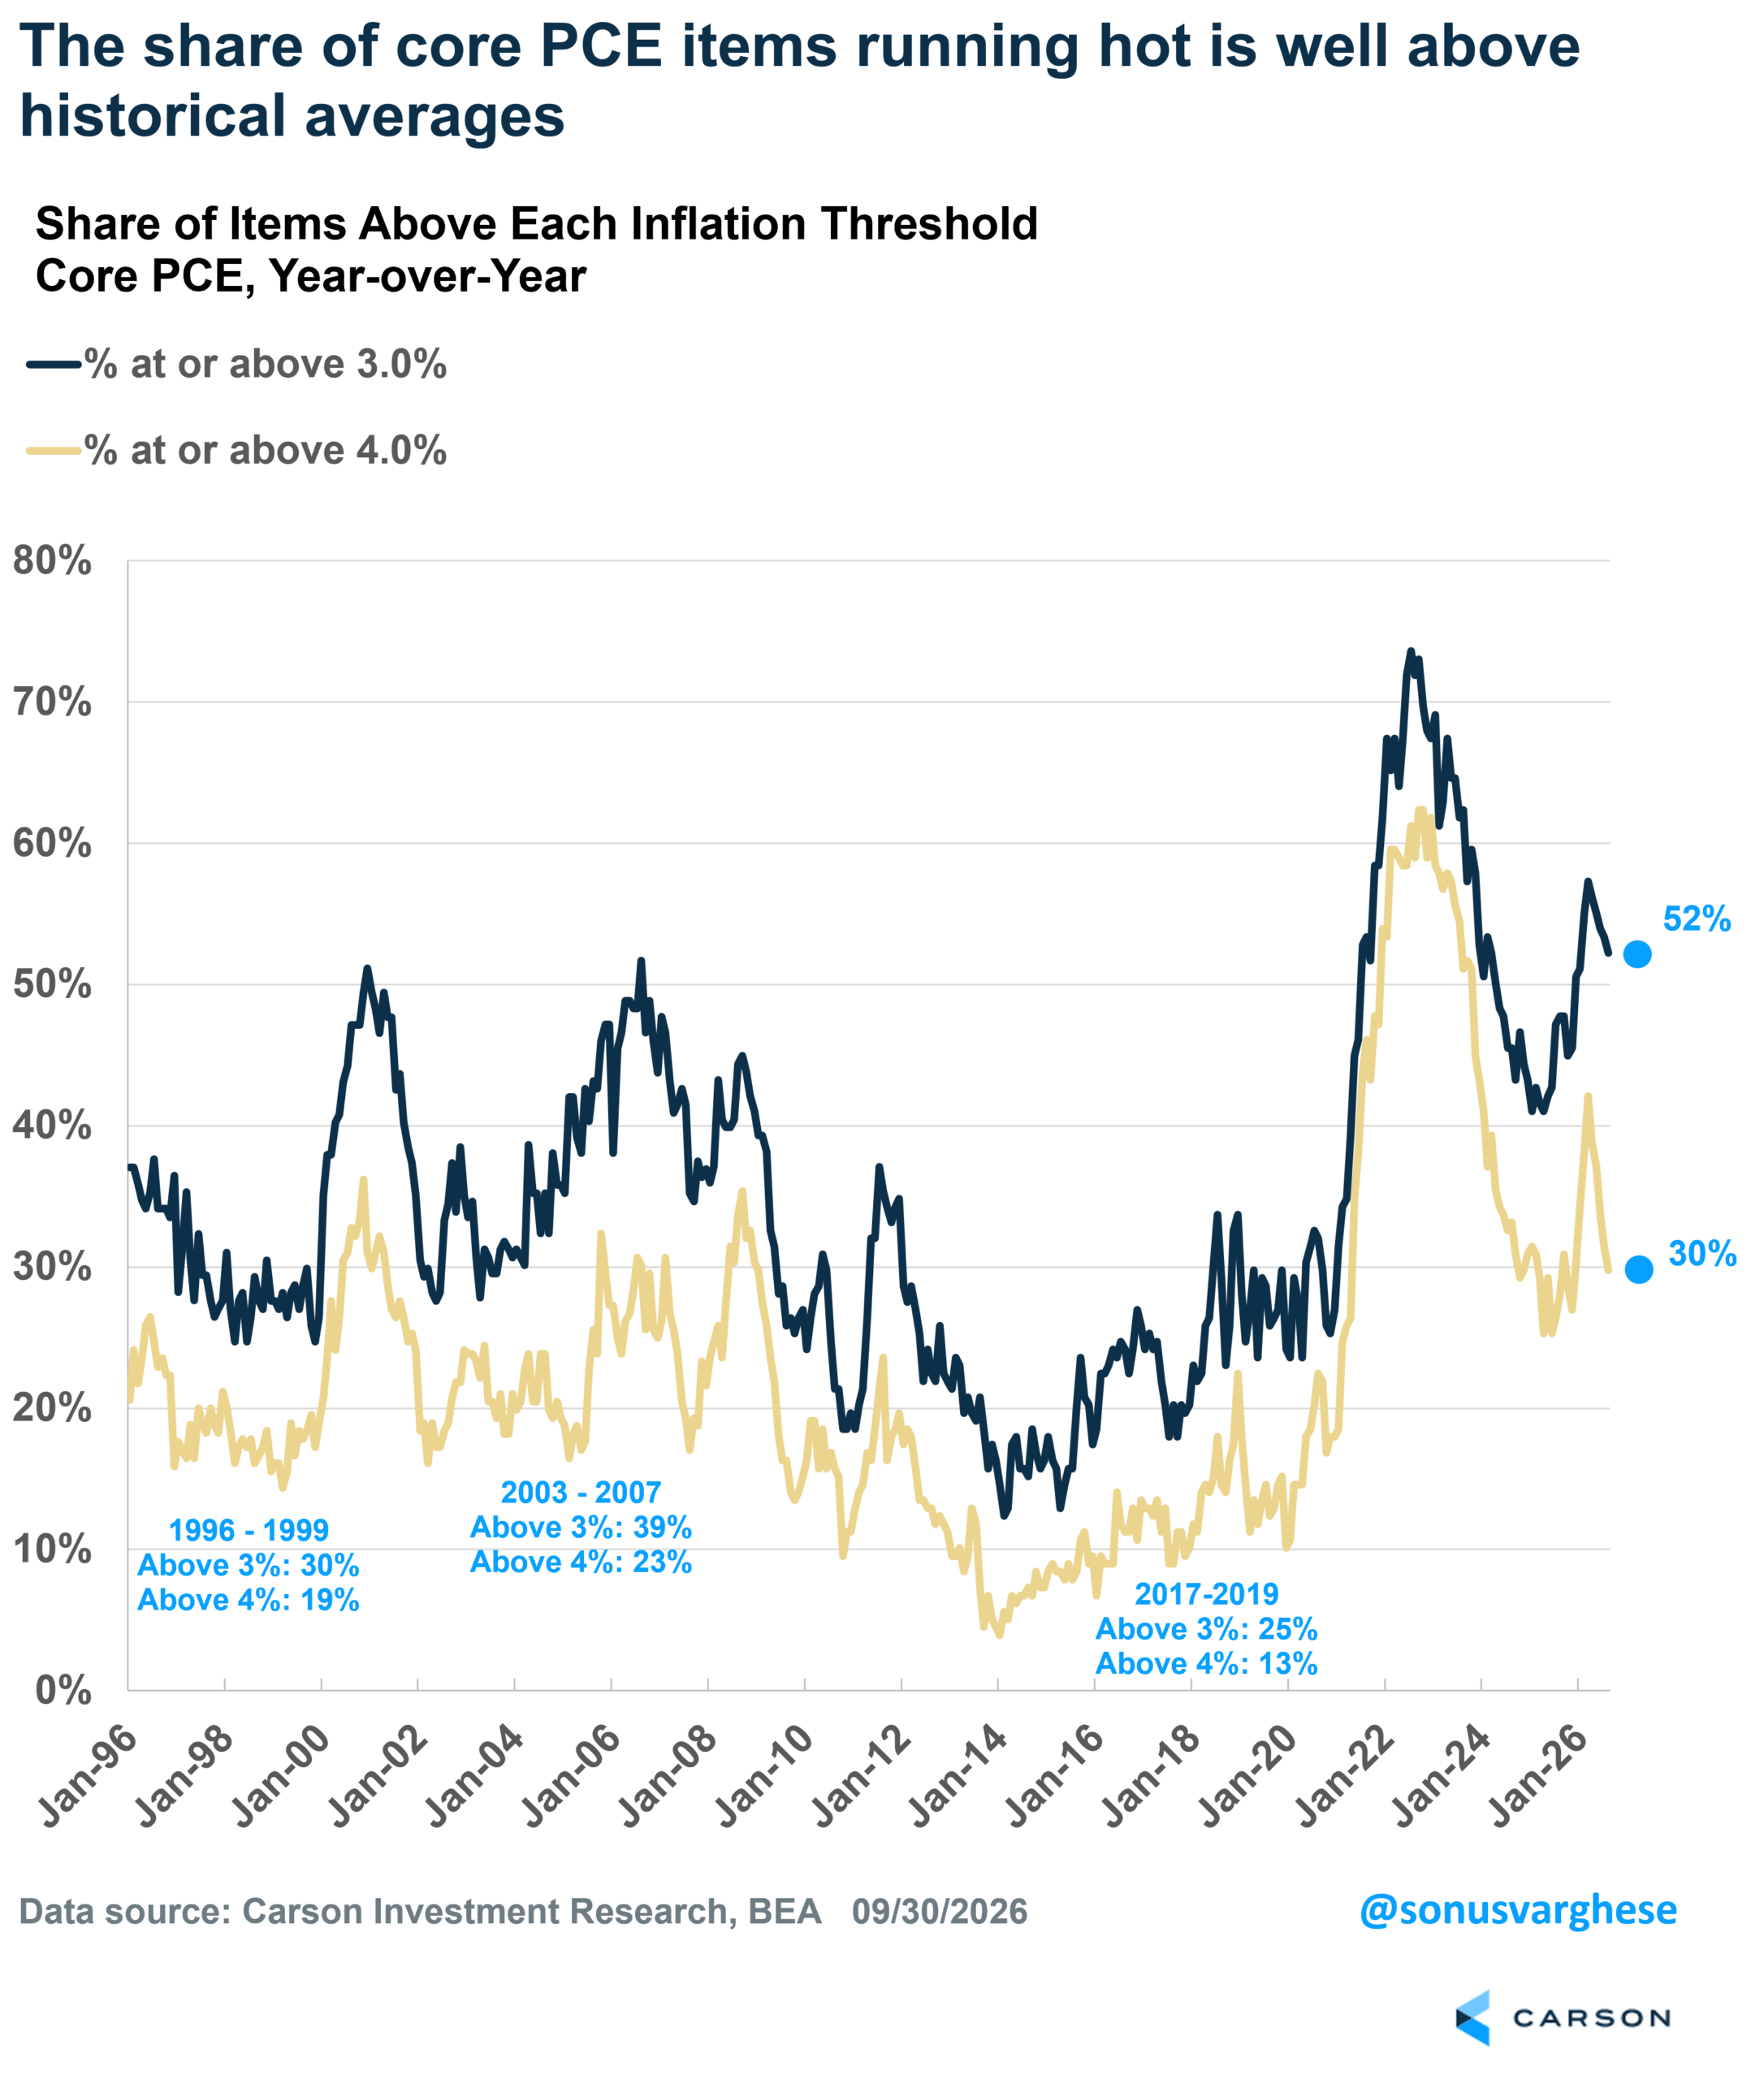
Looking at this “diffusion index” back to 1995, the current 52% share of core PCE items with inflation above 3% is above the peak levels seen in prior cycles, and well above the historical averages shown in the chart. In other words, the current inflation problem is not just a handful of outliers.
Things don’t look much better within core services, excluding housing. As of August, 58% of items are running above 3% year-over-year inflation and 33% above 4%. Here’s how that compares with history:
- 1996-1999: 41% above 3% (27% above 4%)
- 2003-2007: 55% above 3% (32% above 4%)
- 2017-2019: 29% above 3% (17% above 4%)
There’s no two ways about it. Slice the data any way you want, and it still shows an inflation problem. The question is how far the Fed is willing to go to pull it back as we move into Q4 and 2027. With the labor market strengthening and non-residential capex spending running gangbusters on the back of the AI boom, it’s hard to see inflation easing meaningfully without a bust. But that’s not really on the cards right now. We just got revisions to Q2 GDP data, and real GDP growth was revised up from 1.5% to 2.2%. That doesn’t seem very exciting, but nominal GDP growth (which is what matters for company revenues and profits) was revised up from 8.0% to 8.5%. Q3 seems set to run just as hot, and for now, that’s good news for the stock market.
For more content by Sonu Varghese, Chief Macro Strategist, click here.
9154139.1. – 30SEPT26A