Welcome to Day Three of the government shutdown, thanks to which we didn’t get the September payroll report that would have been released on Friday, October 3.
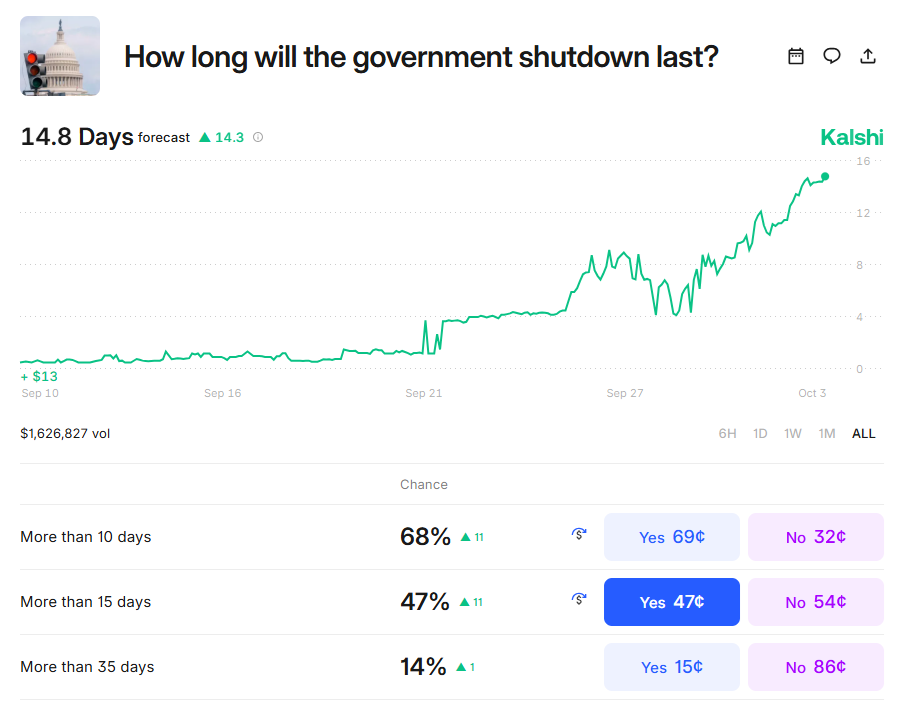
Right now prediction markets over at Kalshi are forecasting a 15-day shutdown, with the odds of a shutdown that lasts over 35 days at just 14%. I think the shutdown lasting that long is probably underpriced—at this point, there’s no incentive for either side to give in. But one forcing mechanism may be elections on November 4, with key gubernatorial races in New Jersey and Virginia, along with a mayoral election in New York. One of the parties is going to get a message from that election, perhaps forcing their hand into a compromise.
From our perspective, there are three questions when it comes to the shutdown:
- What happens with stocks?
- What happens to official government data?
- What does the Fed do?
Stocks Don’t Really Care About a Shutdown
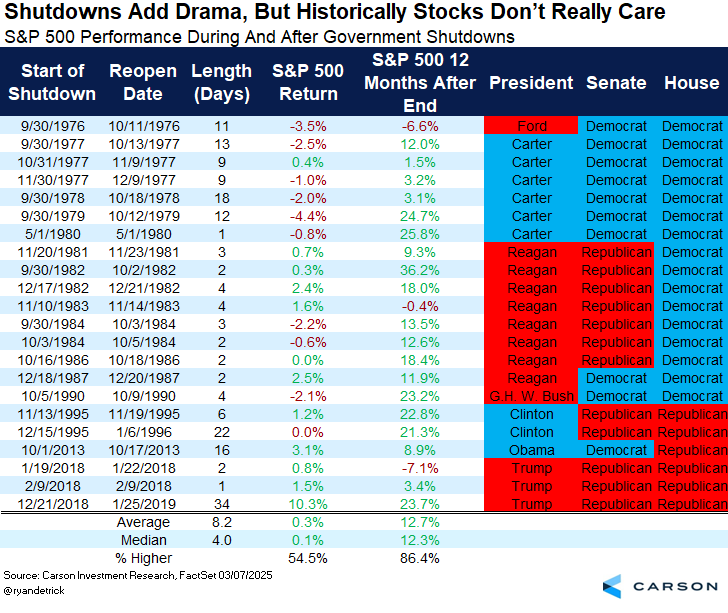
Ryan Detrick, Chief Market Strategist at Carson Group, recently wrote about the impact of shutdowns on markets, and historically there really isn’t one. In fact, the last shutdown, in 2018–2019, was a record 34 days and stocks gained more than 10%! Most shutdowns last only a few days, so just long enough to get into the headlines, and then the’re over just as quickly. Below is a table we put together that shows how stocks are up a little bit during the previous 22 shutdowns, but a year later have been higher 19 times and up an average of nearly 13%. Now, each time is different and we don’t recommend this as guide on how you invest, but it’s nice to have some perspective on what’s happened historically amid Washington dysfunction.
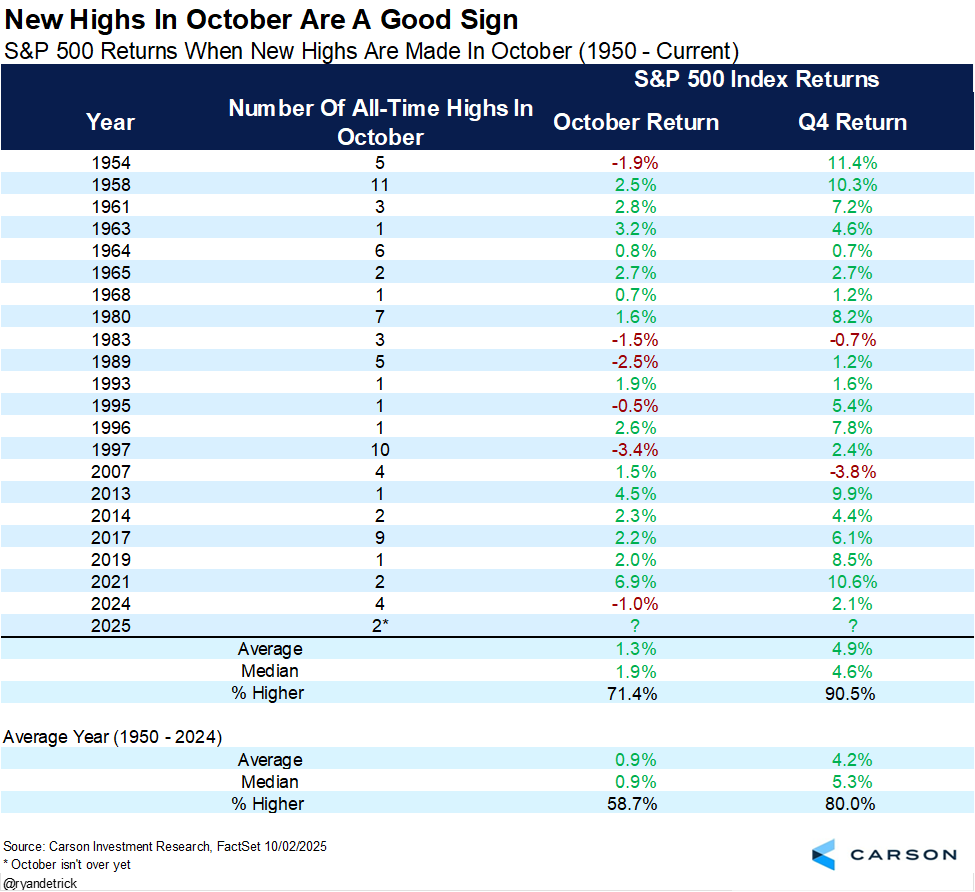
Of course, markets have continued to rally over the last week. The S&P 500 just notched five straight months of gains and hit its 30th new all-time high for the year yesterday (October 2). Momentum begets momentum and the fourth quarter is historically a strong time of year for stocks. Here’s another chart from Ryan showing that when the S&P 500 makes a new high in October the fourth quarter is positive more than 90% of the time, with a median return of 4.6%.
There’s another important potential tailwind from the Fed cutting rates, but that brings up the problem of government data availability before their next meeting on October 28-29.
Shutdown = No Data
Perhaps the most important immediate impact of the shutdown from a market perspective is that we didn’t get the regular weekly unemployment insurance benefits claims data on Thursday morning, nor the September payroll report that would have been released on Friday. And if the shutdown extends into the next two weeks, we’re going to miss another couple of claims reports along with the September inflation data (both CPI and PPI).
All this means the Fed will be flying blind going into their next meeting on October 28–29, since they will not have received critical new information on labor markets and inflation since their last meeting in September.
Still, we have received some information about the labor market since then, and I thought it’d be useful to do bit of a roundup. The big picture is that the labor market continues to cool with weak hiring. The only good news is that companies are still reluctant to let people go.
Weak Hiring, Low Firing
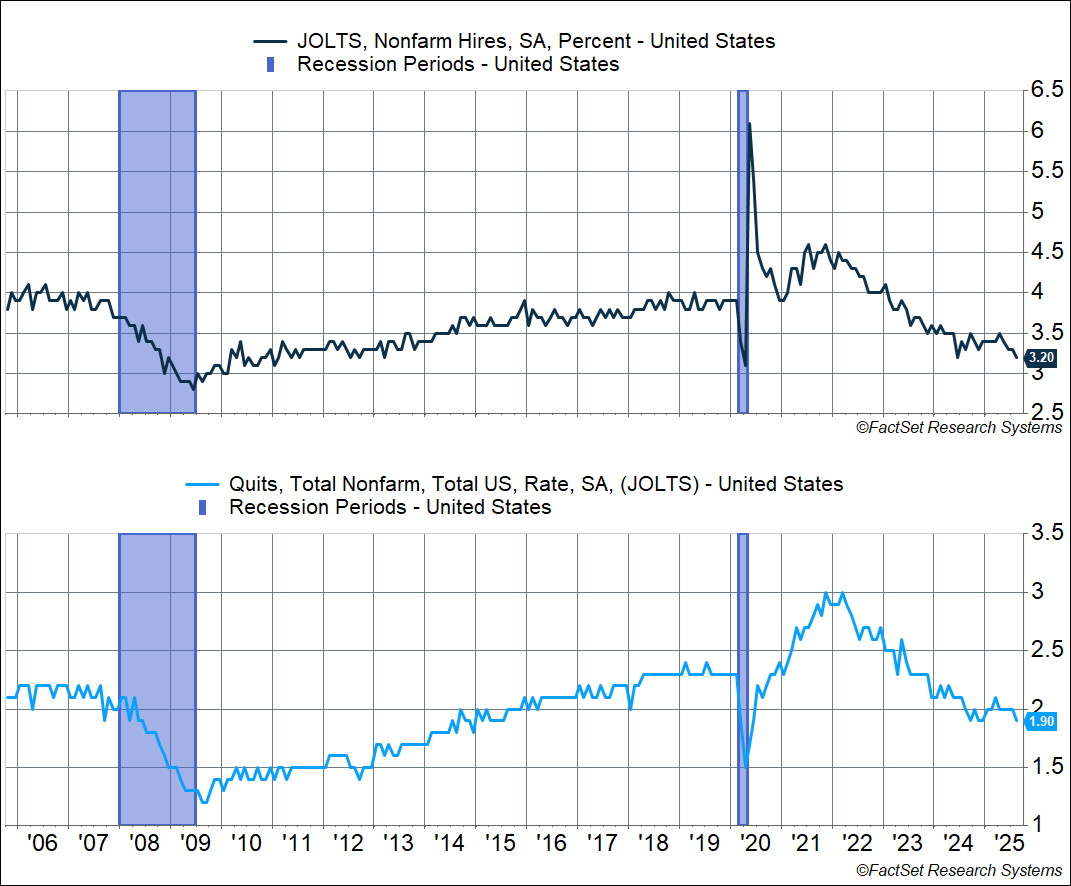
The last official labor market data we got was the August JOLTS report (Job Openings and Labor Turnover survey). While this is August data, it is not that much lagged from official September payrolls data. The JOLTS data is for the entire month of August while the survey period for payrolls would have been around September 12. And JOLTS gives us a good sense of the underlying dynamics of the labor market.
Hiring has consistently been the worst part of the labor market since 2023, but we had seen some stabilization earlier this year. The problem is that things have gotten worse over the last three months. The “hiring rate,” which is hires as a percent of labor force, fell to 3.2% in August, matching the post-Covid low. This is the weakest pace of hiring since early 2013 (ex Covid). For perspective, the average hiring rate in 2019 was 3.9%. The big picture is that hiring has eased a lot since 2022 and early 2023. It appeared to have stabilized between mid-2024 and mid-2025, but things have gotten worse on the hiring front since June, with a visible downtrend.
Note that this is “gross hiring,” as opposed to the payroll report’s estimate of “net hiring.” What this tells you is that “job finding” conditions aren’t as good as they were in 2021–2023, let alone 2016–2019. Companies may be very judicious about hiring, especially if they retrench in preparation for a slowdown. Also, lower immigration means hiring doesn’t have to increase to keep up with population growth.
Meanwhile, the quit rate (quits as a percent of the workforce) fell from 2.0% to 1.9%. This matches the lowest quit rate we’ve seen in the post-Covid cycle. For perspective, the 2018–2019 average was 2.3%. A relatively strong quit rate is a sign of labor market strength, and vice versa. Workers quit at higher rates only if it’s easy to find a job. The quit rate usually plunges only during recessions, and from mid-2023 onwards we’ve seen a big drop in the quit rate. It looks like things stabilized earlier this year, albeit at a level lower than what we’d associate with a strong labor market, which told us that it wasn’t easy to quit and find a job. But it looks like things got a little worse in the summer.
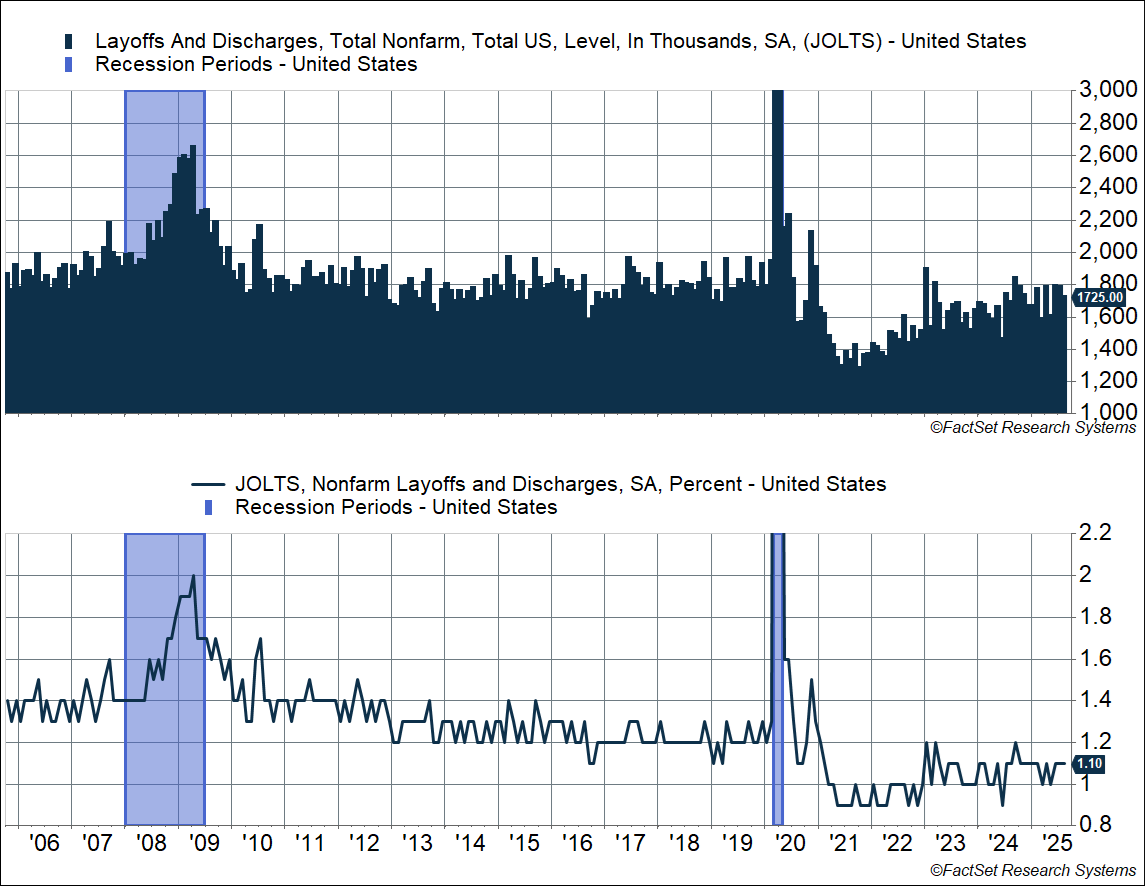
The good news is that we still seem to be in a low firing environment. There were 1.73 million layoffs in August, which seems like a lot but this is below the 1.8+ million we saw pre-pandemic. At the same time, the labor force is much larger than it was six years ago. The layoff rate (layoffs as a percent of the workforce) was also unchanged at 1.1%. That’s well within the range we’ve seen over the last two years, and below the pre-pandemic rate of 1.2–1.3%. Low layoffs have consistently been the best part of the labor market data. Note that we didn’t see a big pickup in initial claims for unemployment benefits either in September (up until the most recent data release). This data is consistent with the “low firings” story from claims.
Second-Tier Labor Market Data from Private Sector Isn’t Great Either
In the absence of official government data, we have to rely more on private market data. This is definitely lower quality than what we get from the BLS—surveys are expensive and so the data we get from the private sector is much smaller in scope. Also, all these private sector data points are dependent on official data for methodological reasons.
First up is the most cited labor market indicator that comes from the private sector, payroll processor ADP’s estimate of payrolls. And the news isn’t good. Based on ADP, the economy lost 32,000 jobs in September, the third month out of the last four during which the economy lost jobs. Over the last six months (April–September) the economy has created an average of just 23,000 jobs. Over the prior six months (October 2024–March 2025), job growth averaged 170,000 a month. So we’ve seen a sharp slowdown recently (essentially since the tariff chaos started back in April).
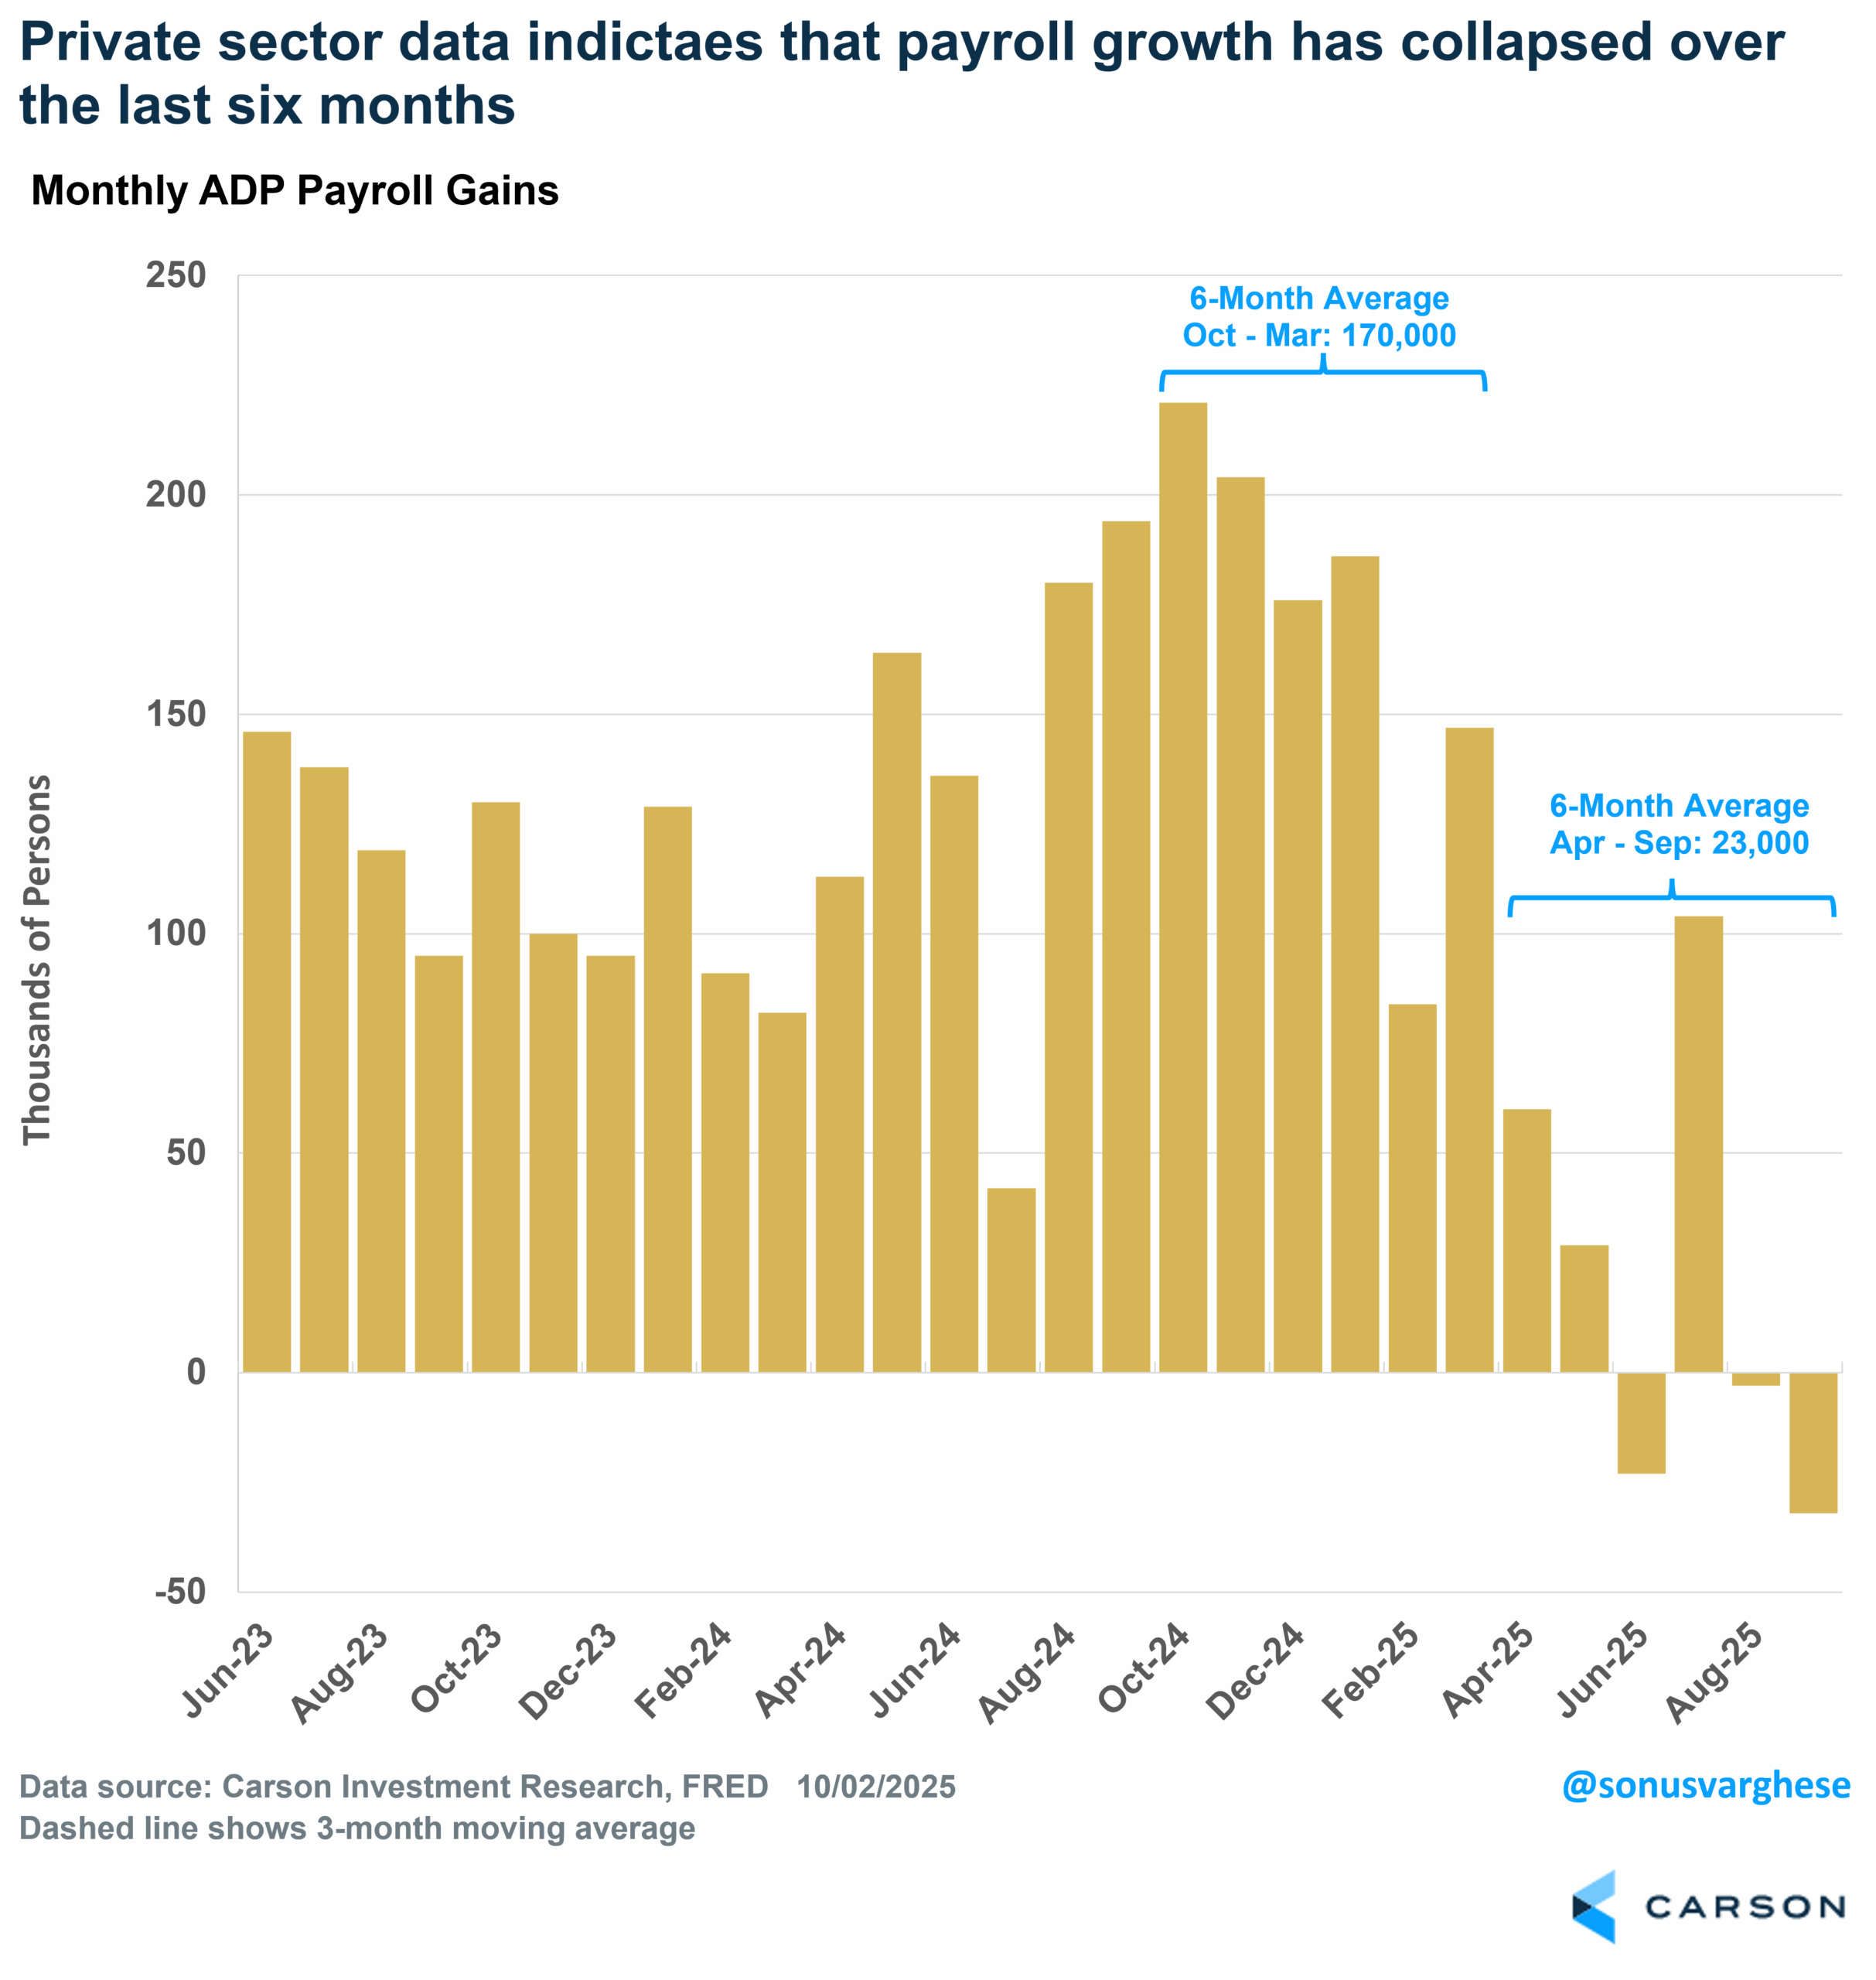
This one can vary quite significantly from the BLS report, and it usually comes out a day ahead. Of course, it’s especially handy when the official data is not forthcoming. It’s mostly useful to gauge the trend of what’s happening in the labor market, and that typically matches what we see in the official data. And right now, the trend is down, whether you look at payroll data from the BLS or what ADP reports. As of September, ADP payrolls have grown just 0.9% year over year (matching the BLS payroll growth rate in August). In 2024, year-over-year growth was 1.3% for both surveys.
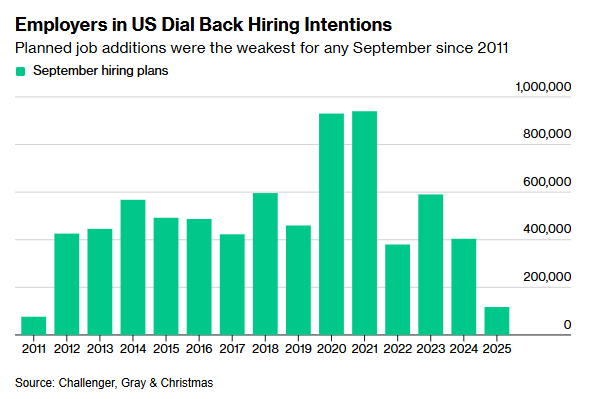
Another dataset came from Challenger, Gray, and Christmas Inc. The September data was mixed. Companies announced plans to add just 117,313 jobs, down a whopping 71% from last year. This is the weakest September for hiring plans since 2011. Year-to-date data (January–September) shows that US companies announced plans to add just 205,000 jobs, the weakest year-to-date total since 2009. You should take the absolute numbers here with huge heaps of salt. The JOLTS hiring data shows that companies hired 5.13 million workers in August alone. Challenger data just picks up what companies “announce.” Again, it’s the trend that is more useful here.
At the same time, Challenger data indicated that companies announced plans to cut 54,064 jobs in September. That’s down 26% from last year and below the 86,000 announced in August. Year to date, employers have announced plans to cut 946,00 jobs, the highest year-to-date total since 2020 (though some of these “planned cuts” don’t materialize). Cutbacks have been highest in the government sector, with DOGE-related reductions of 289,000. This could increase in October if the Trump administration goes through with their threat of firing thousands more government employees amid the shutdown.
Consumers Aren’t Optimistic About the Labor Market Either
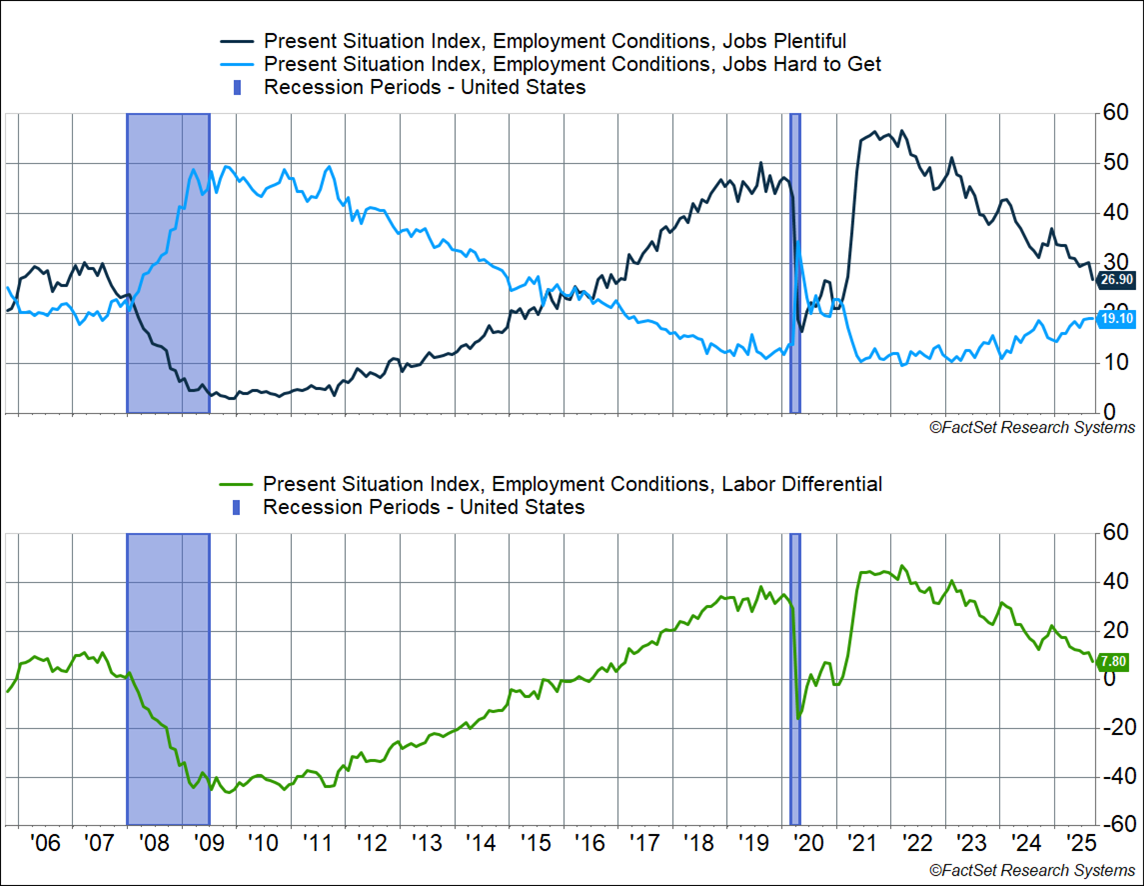
Consumer confidence has been plunging over the summer, whether you look at the survey from the University of Michigan or from the Conference Board. The latter report tends to be more in tune with the labor market, and they explicitly ask consumers about what’s happening on the jobs front. The percent of respondents saying “jobs are plentiful” fell 3.3% points to 26.9% in August. This is similar to what we saw back in early 2017, which is fairly healthy but not great (like 2018–2019 or 2021–2022). The problem is back in 2017 things were in an uptrend, whereas now it’s in a downtrend.
The percent of respondents saying “jobs are hard to get” was unchanged at 19.1%. As you can see below, this metric is higher than 2017–2019 levels. The big issue is that the trend is in the wrong direction, as it’s been rising since the beginning of the year. It tells you that hiring is weak, which is also consistent with other data like the hire rate.
The difference between the two is called the “Labor Differential Index,” fell 3.3% points to 7.8%, the lowest level since February 2021. The labor market differential is well below peak levels we saw in 2021–2022, and also below 2018–2019 levels. Even beyond the absolute level, the trend just does not look good. But this is being driven by a weak hiring environment, rather than layoffs.
What Next for the Fed?
Given the lack of incremental official information about the labor market data, the Fed will likely stay on course and cut rates again. Yes, inflation remains elevated but they’ll present that as transitory (even if they don’t use that word) and prioritize protecting the labor market. As you saw from all the data I showed above, hiring is weak. Yes, firings are not high either, but the worry is that layoffs will start increasing if this continues and then the labor market may enter a downward spiral that cannot be controlled.
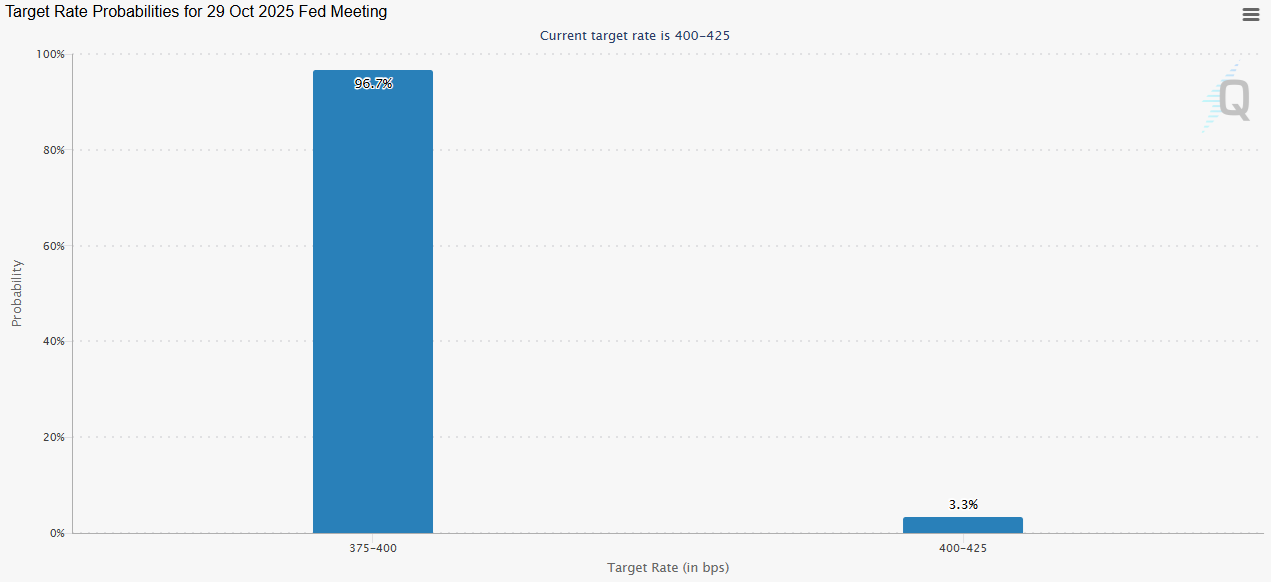
This is why markets are currently pricing a cut at the Fed’s October meeting with a 97% probability (based on fed funds futures).
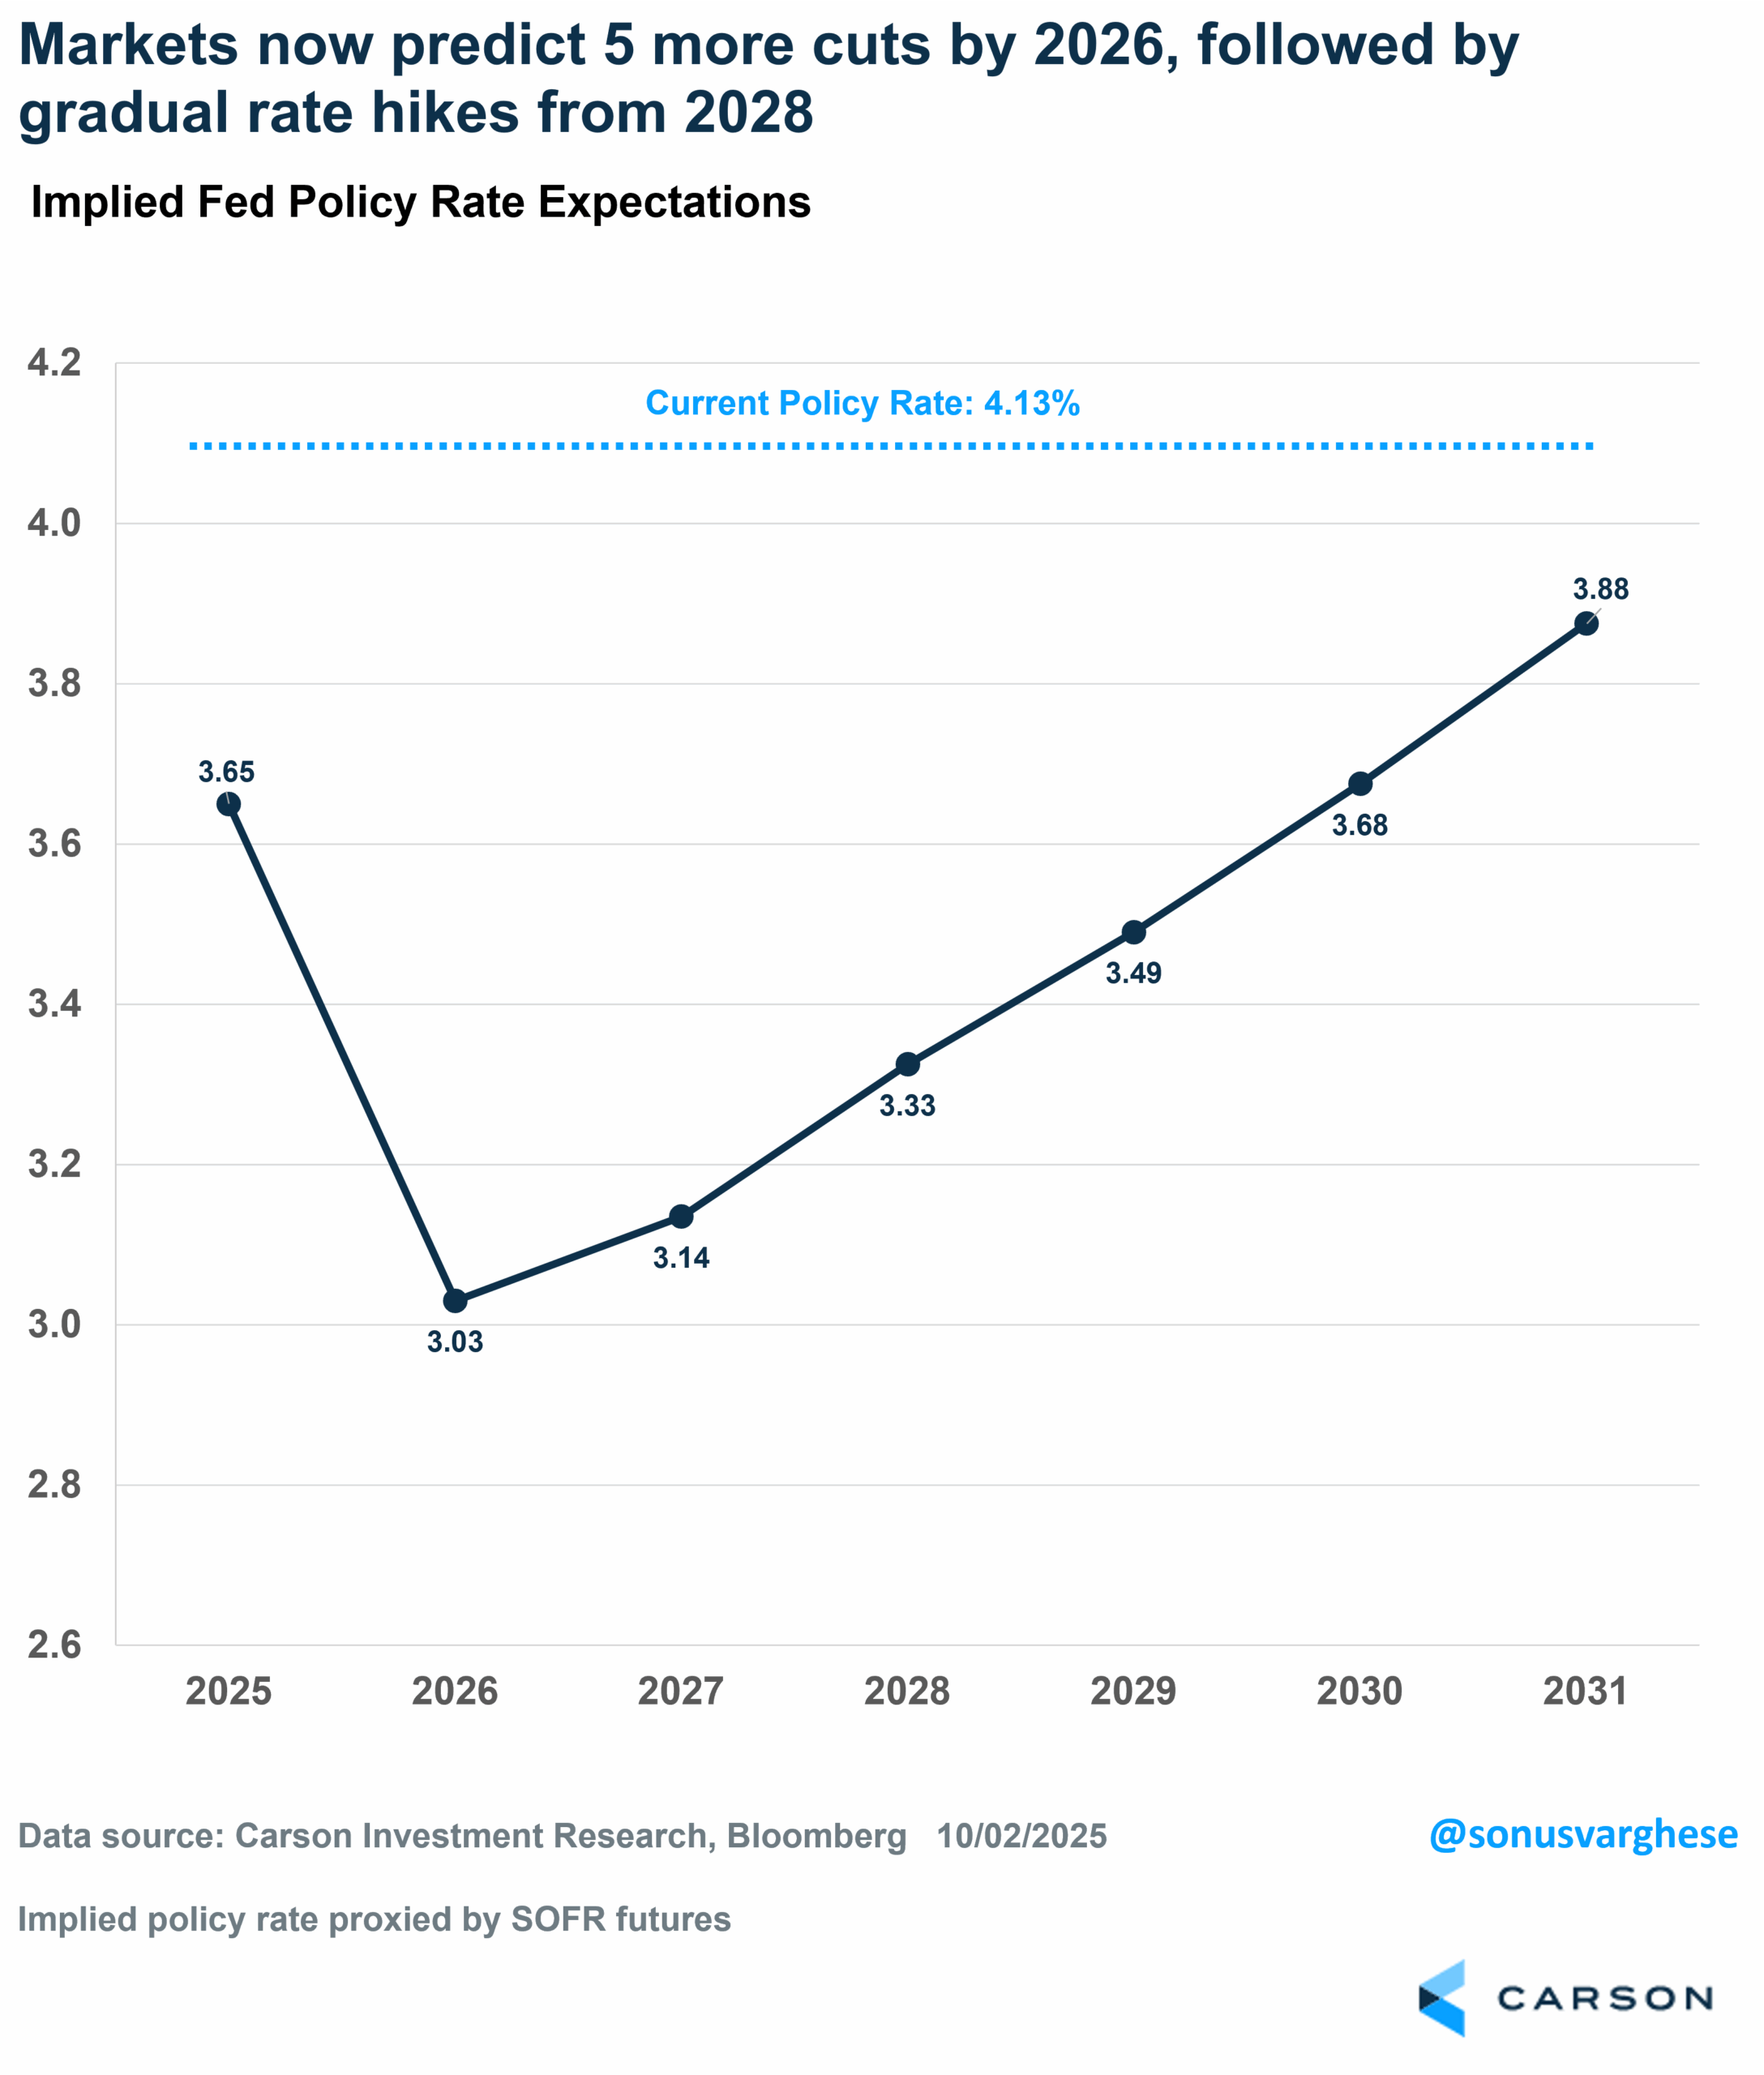
That’s not all. Markets expect another rate cut at the Fed’s December meeting, and another three cuts in 2026, taking the Fed funds rate from its current level of 4.1% all the way down to about 3%. That by itself would be a big tailwind for the cyclical areas of the economy. Of course, the bond market could be wrong about this but look at it this way—if these cuts don’t materialize as markets currently expect, that would mean the economy, and the labor market, is doing quite well.
All said and done, despite the shutdown, which looks like it has no immediate end in sight right now, stocks have some nice tailwinds going for them:
- Strong momentum after several months of strong returns, and momentum begets momentum
- Strong Q4 seasonality, which may be further supported by investors who have been dour on markets since April trying to catch up
- A slew of Fed rate cuts, despite elevated inflation and an economy that seems to be holding up even in the face of a cooling labor market, which is a recipe for inflationary growth as we move into 2026, which is good for profits (and stocks)
8461845.1.-03OCT2025
For more content by Sonu Varghese, VP, Global Macro Strategist click here.
