
“If the opposite of pro is con, then the opposite of progress must be Congress.” Sam Stovall, Chief Investment Strategist at CFRA
Ready or not, midterm elections are coming. We’ve already discussed them in detail in Midterm Elections Don’t Matter a Whole Lot to Markets, but Here’s What Might, but I wanted to share some other charts and things to consider.
It Doesn’t Always Play Out
I will start with this: if you hear how a certain industry or sector will move a certain way based on the midterm results, just be skeptical. When President Trump won in 2016, we were told that he didn’t like Jeff Bezos, Amazon’s founder and Executive Chairman (and vice versa), and large-cap tech would struggle. Obviously, the past decade has been all about tech and those bearish tech calls didn’t play out very well. When President Biden won, we heard that marijuana stocks would go higher (get it 😊) and coal stocks would collapse. Well, we saw the exact opposite. Even more recently, we were told that President Trump was the most pro-Bitcoin president ever when he won the second time. I don’t think you can really argue this, but note that bitcoin is down since he was inaugurated in January 2025.
I will let the late market forecaster Joseph Granville sum it up with his famous quote, “If it is obvious, it is obviously wrong.”
Don’t Shoot the Messenger
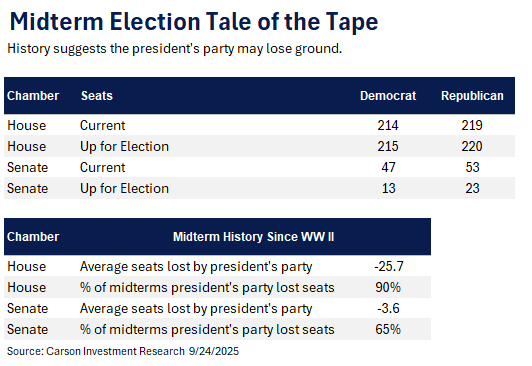
Ok, please don’t get too mad at me here; I’m just sharing the facts. The facts are that the motivated party is the party that lost the presidential election, which in this case would be the Democrats. Below is a nice Tale of the Tape that shows it is quite common for the party in the White House to lose 25 seats in the House and close to four in the Senate in the midterms.
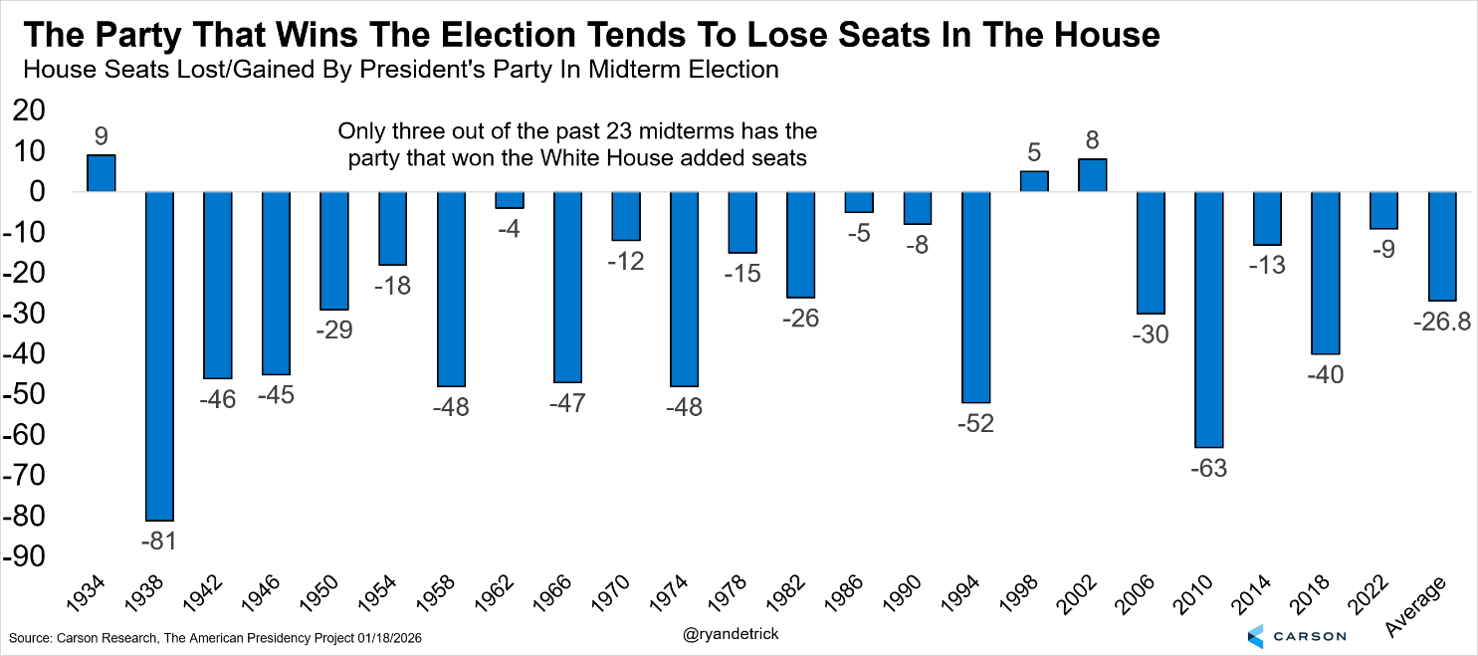
Here’s another chart that shows only three out of the past 23 midterms saw the party that won the White House add seats in the House in the midterm election. With one of the smallest House majorities in history, it isn’t too controversial to suggest the House flips to the Democrats.
Not About Red or Blue
As of now, the oddsmakers have the Democrats taking the House by a wide margin, but the Senate is a little bit closer at about a 65% chance. Looking at history, having a Republican president and a Democratic Congress is one of the worst for returns. A split Congress and a Republican president is much better for returns.
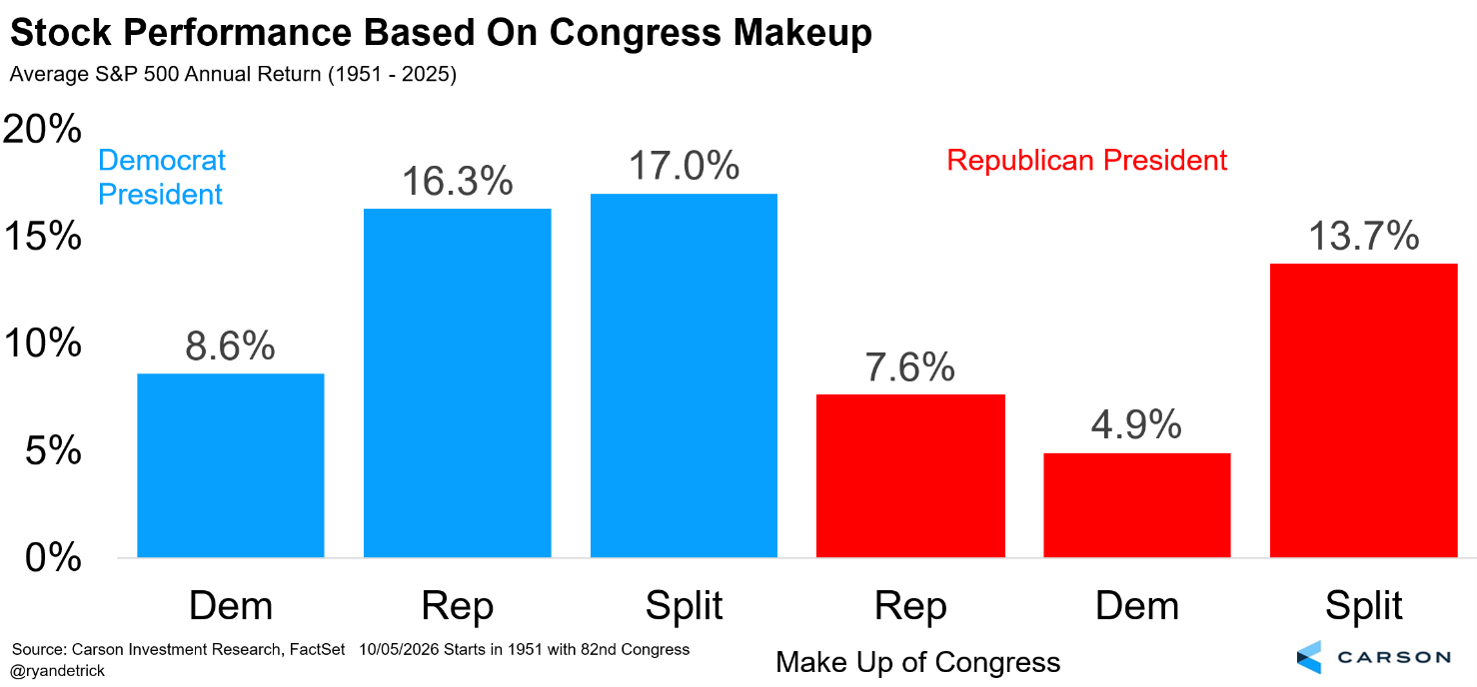
Here’s the thing: it isn’t about red, it isn’t about blue; it is about green. We broke it down by Congress, and it showed that a Democratic Congress is quite weak, a Republican controlled Congress is a little bit better, but the best scenario for investors is a split Congress. Maybe the best Washington is one that needs to work together to get things done?

Stay on Top of Market Trends
The Carson Investment Research newsletter offers up-to-date market news, analysis and insights. Subscribe today!
"*" indicates required fields
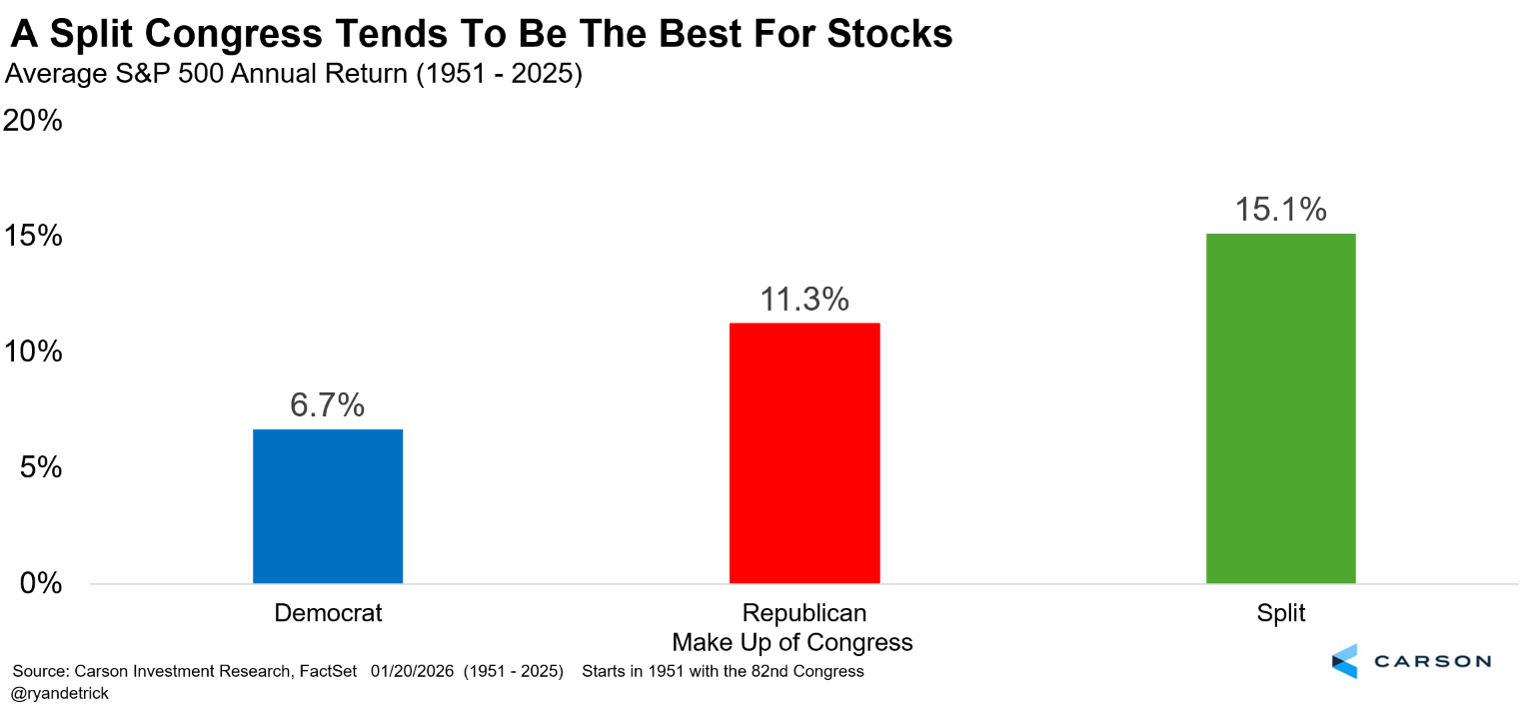
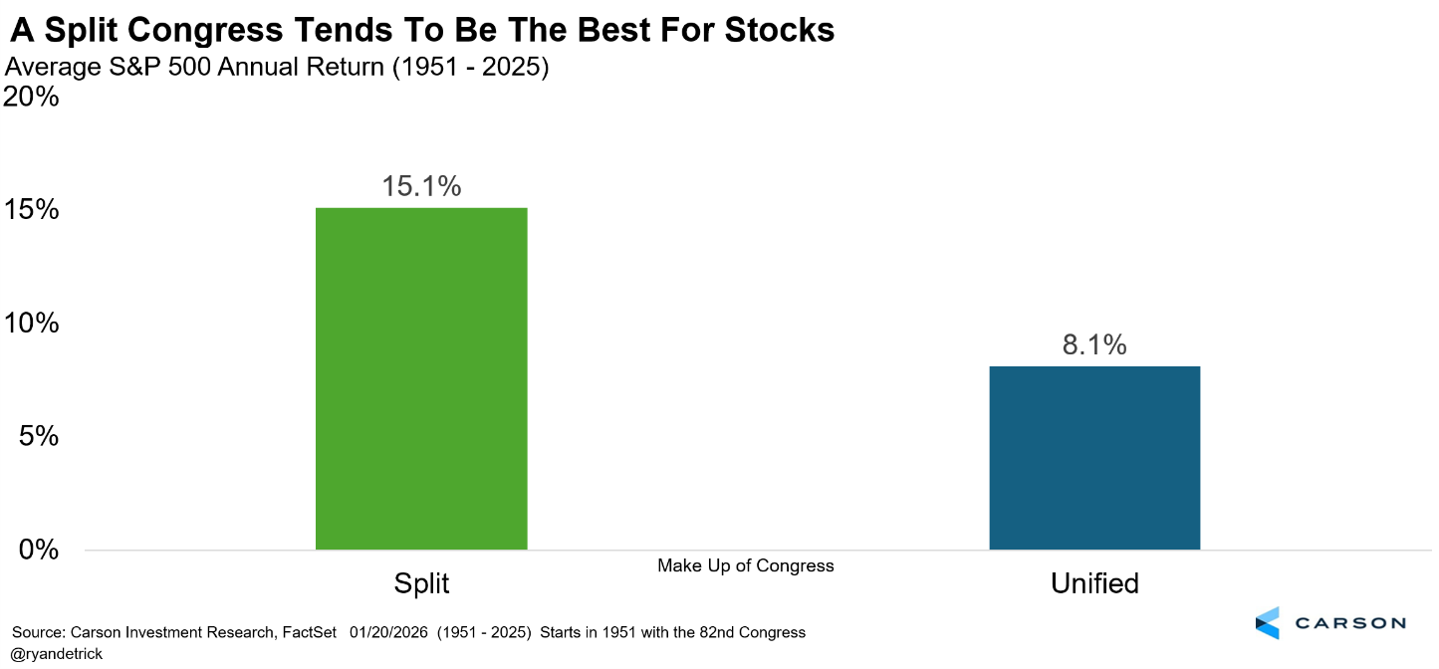
Here’s the same data, shown just based on a unified Congress versus a divided Congress. Yet another way of showing that a split Congress tends to be better for investors.
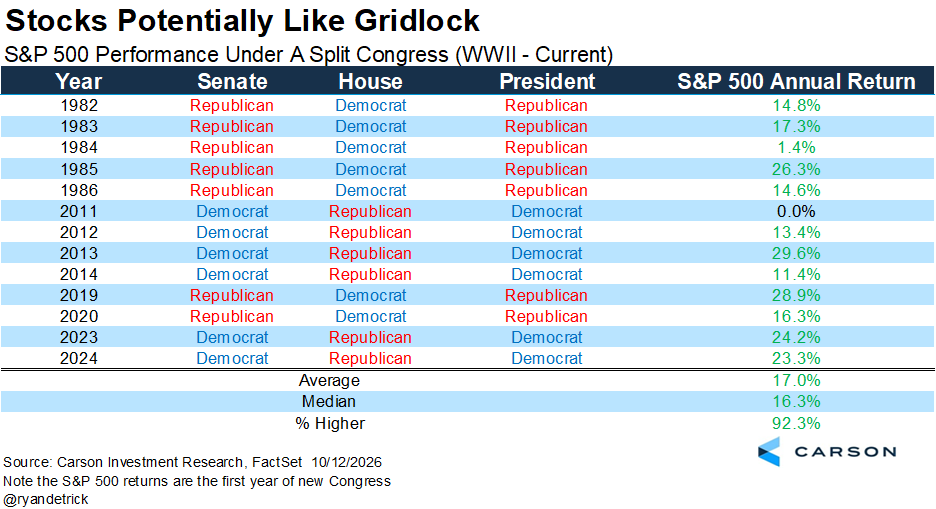
Lastly, the past 13 times we had a split Congress, the stock market never fell. Yes, 2011 was an exactly flat year, but the rest of those years were green and some by a nice margin. Gridlock can be a good thing. So the most likely configuration (Republican president; Democratic Congress) isn’t great right now, although the second most likely (Republican president; split Congress) is above average. But we wouldn’t take our bearings from this too strongly. It’s what’s happening in the economy that really matters, and we can’t imagine whether Congress is split or unified will make a meaningful difference.
Now What?
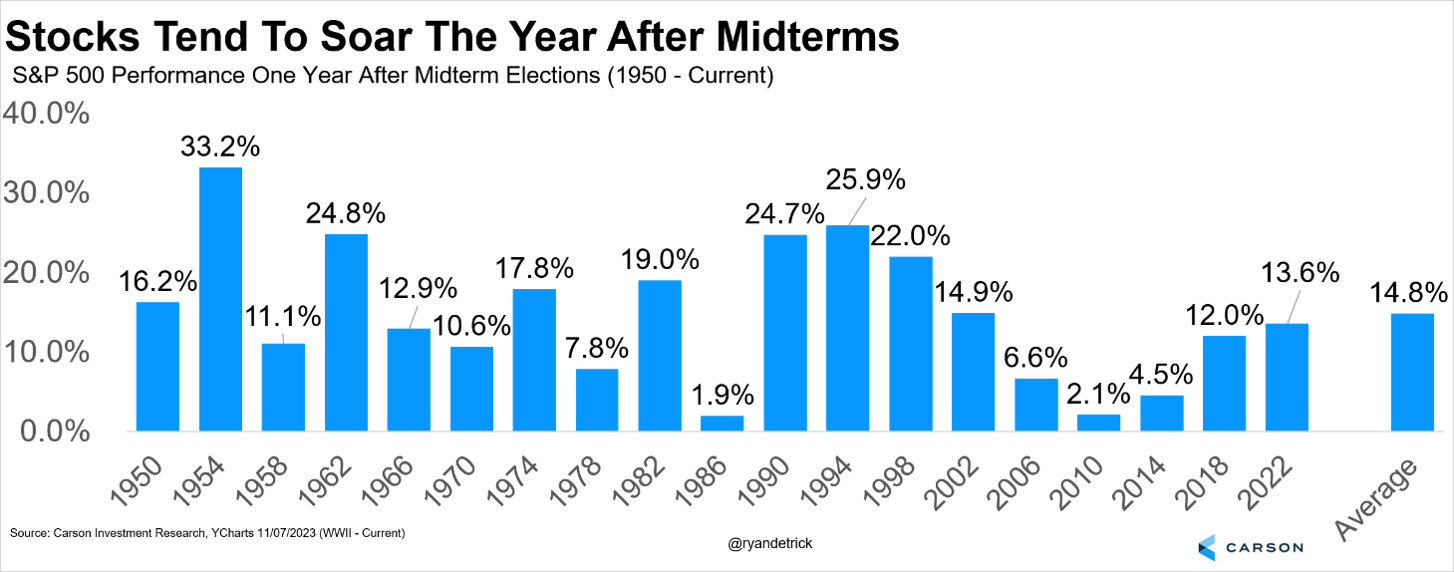
We can pontificate all day about midterms and what might happen, but the bottom line is the S&P 500 has been up a year after midterms the past 19 times, averaging close to 15%. 19 times in a row! We don’t think that streak will end this time.
Earlier this year, the S&P 500 had a 9.1% mild correction that ended in late March. We’ve heard all year how bad midterms tend to be, but if you’ve read what we’ve said, we were on record that that would be the largest pullback we’d see this year. That call wasn’t popular. In August and September, many long-term bulls were cutting their forecasts and predicting bear markets, but we never did and held firm that the second half of 2026 would be a good one for investors.
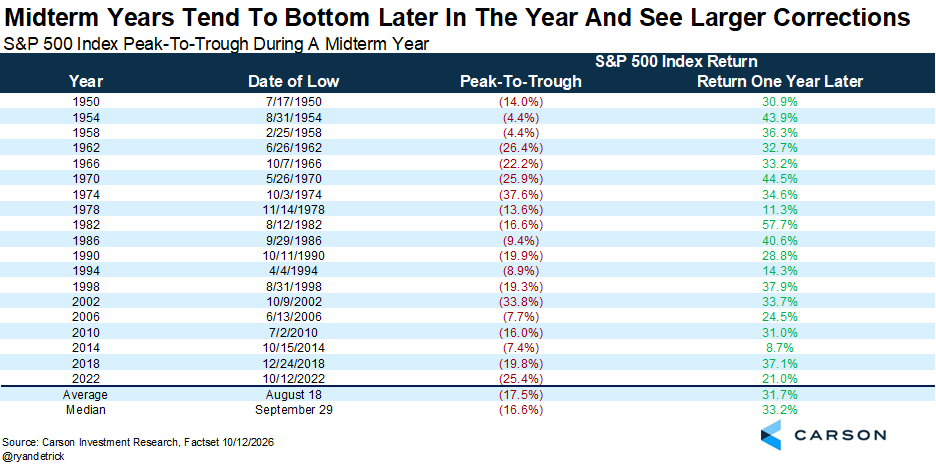
Want some more good news? Historically, the S&P 500 is up nearly 32% off the midterm year max pullback, so in this case that would be March 30. Well, stocks are up just over 18% since the late March lows and history would suggest there could be more in the tank.
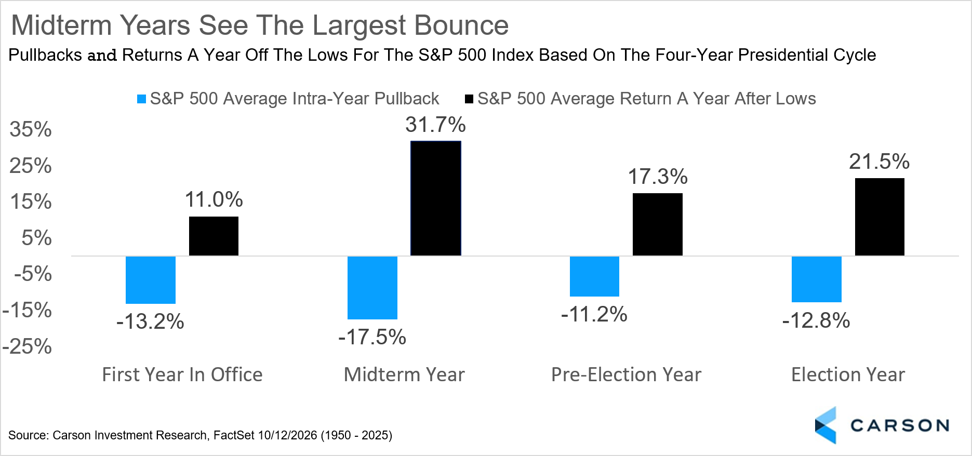
Lastly, here is that same data, but broken down by all midterm years. Everyone knows that midterm years are the most volatile and tend to see the largest peak-to-trough correction out of the four-year cycle. The max drawdown tends to occur later in the year, but as we said back in May, the 9.1% mild correction we saw in February/March could be the max this year. While an unpopular call, it is now looking like it could be the right call, and the late March lows could be the earliest max peak-to-trough correction since 1954.
For more content by Ryan Detrick, Chief Market Strategist, click here.
9179855.1. – 14OCT26A