
In my opinion one of the most important factors in assessing an investment’s performance, especially an active manager’s, is understanding the market environment in which the performance came from. Knowing what sectors, industries, styles, and segments of the market capitalization spectrum performed strongly or poorly relative to the broad markets is the first step in dissecting a fund’s performance attribution, before looking at idiosyncratic factors like security selection.
Usually, these factors and their relationship to a manager’s relative performance are fairly straightforward — for example, the fund was overweight Technology in 2023 and outperformed, or the bond fund was long on duration in 2022 and underperformed. Sometimes, however, looking deeper can end up yielding a more meaningful explanation.
Small Cap equities in the US have historically been a fertile landscape for active managers to generate alpha in. With more constituent stocks creating the investment universe, significant variation in represented sectors and industries, and a market dynamic balanced between companies that have plateaued as small cap versus those just stopping by on their way up (or down), the spectrum among small caps provides a greater opportunity set for managers to find excess performance.

Stay on Top of Market Trends
The Carson Investment Research newsletter offers up-to-date market news, analysis and insights. Subscribe today!
"*" indicates required fields
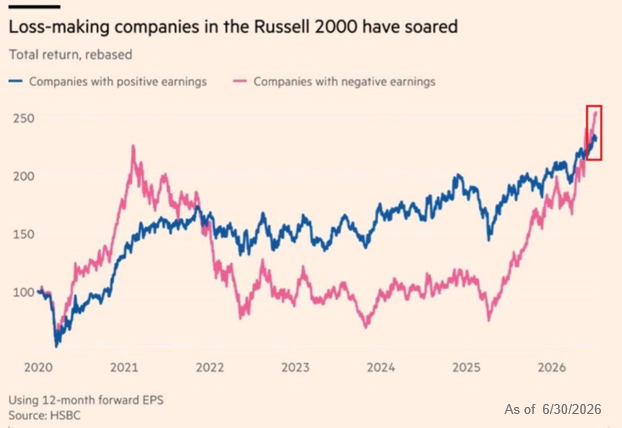
Over the past few years, the line between the haves and the have nots in small caps has had less to do with sectors or industries, and more a company’s profitability. If you are like me and came up in the industry reading The Intelligent Investor and learning stock valuation through a discounted cash flow model, then this is probably going to be as confounding to you as it has been to me over the past 12 months. Companies in the Russell 2000 index with negative earnings (as viewed by forward looking EPS) have significantly outperformed their index-mates with positive earnings since mid-2025.
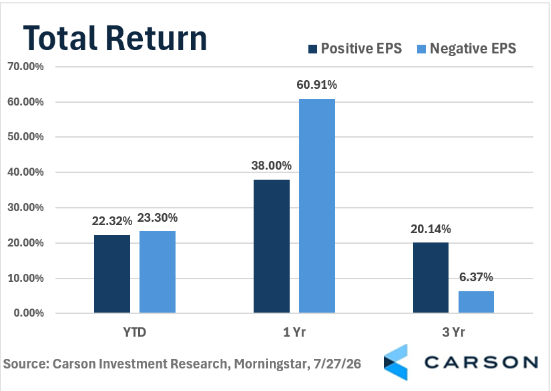
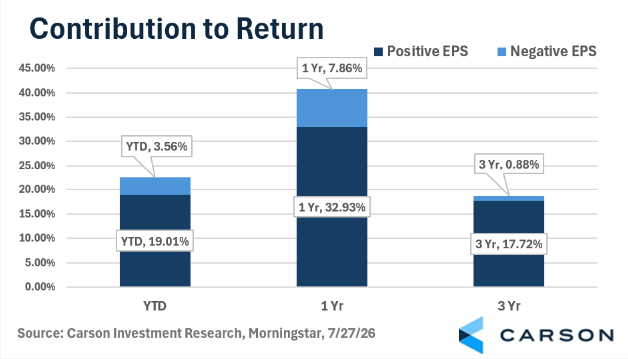
Non-earners typically comprise 10-15% of the Russell 2000 index. Many active managers within the space tend to either be significantly underweight companies with no earnings, or they eliminate those companies from their investable universe altogether. This has caused an increase in dispersion for returns in the peer group.
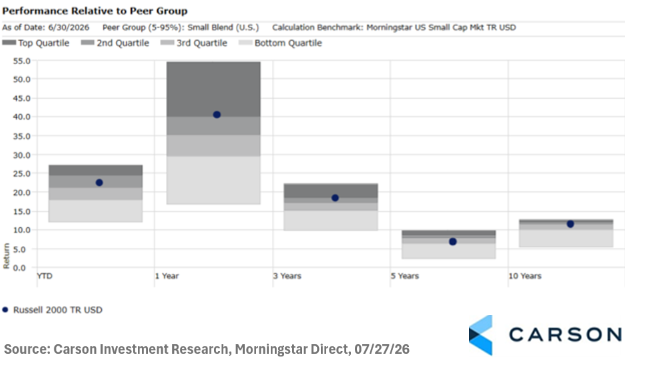
You can see the dispersion in one-year performance for the Small Blend peer group ranging from the 5th percentile just shy of 60% and the 95th percentile just shy of 10%. You can also see the benchmark index at just about the 25th percentile of peers. This is atypical for the peer group, as the benchmark index is generally at or below the category average on a rolling basis (rolling two-year performance rank shown below), highlighting the robust and persistent opportunity set for active managers to add alpha.
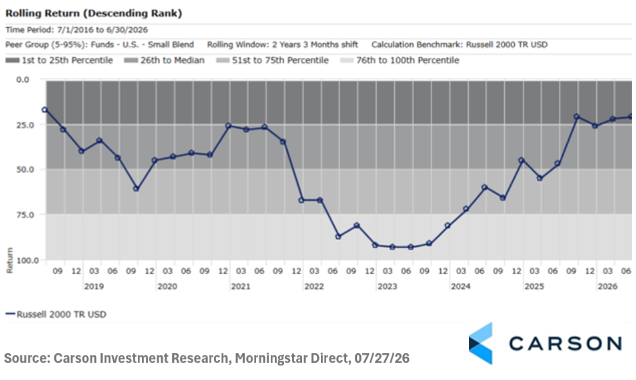
As my colleague Sonu Varghese, Chief Macro Strategist, wrote in an earlier blog, the impact of AI spending and market exuberance is alive and well even in the small cap universe. Much of the negative earning segment of the Russell 2000 that has negative earnings are companies in the technology and industrials sectors with close ties to AI infrastructure and future use cases. Understanding how these dynamics fit together and impact performance of strategies where the impact is not clear on the surface is an integral part of our manager diligence and monitoring process.
By Michael Barczak, Analyst, VP, Investment Due Diligence
9043486.1. – 27JULY26A