
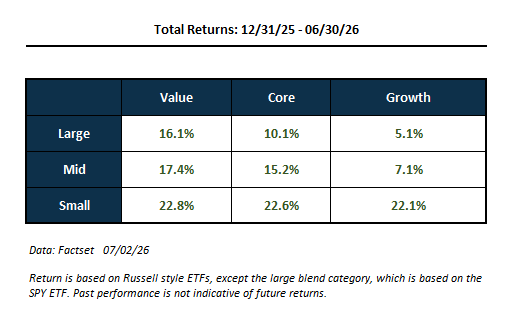
You would think AI is a growth story, but it’s showing up in more places than in the obvious “large cap growth” stocks. In a recent blog I noted how even so called “value” stocks have seen returns driven by the AI wave. Looking at style box returns for the first half of the year, you can see that large value has beaten large growth (a function of the Mag 7 underperforming), but also that mid and small cap stocks have outperformed the S&P 500. The Russell 2000 index gained about 23% over the first half, versus 10% for the S&P 500. That’s a big difference, and it’s easy to look at that and think recent market gains are more than just AI (which on the surface is all about large-cap semiconductor stocks). But think again.
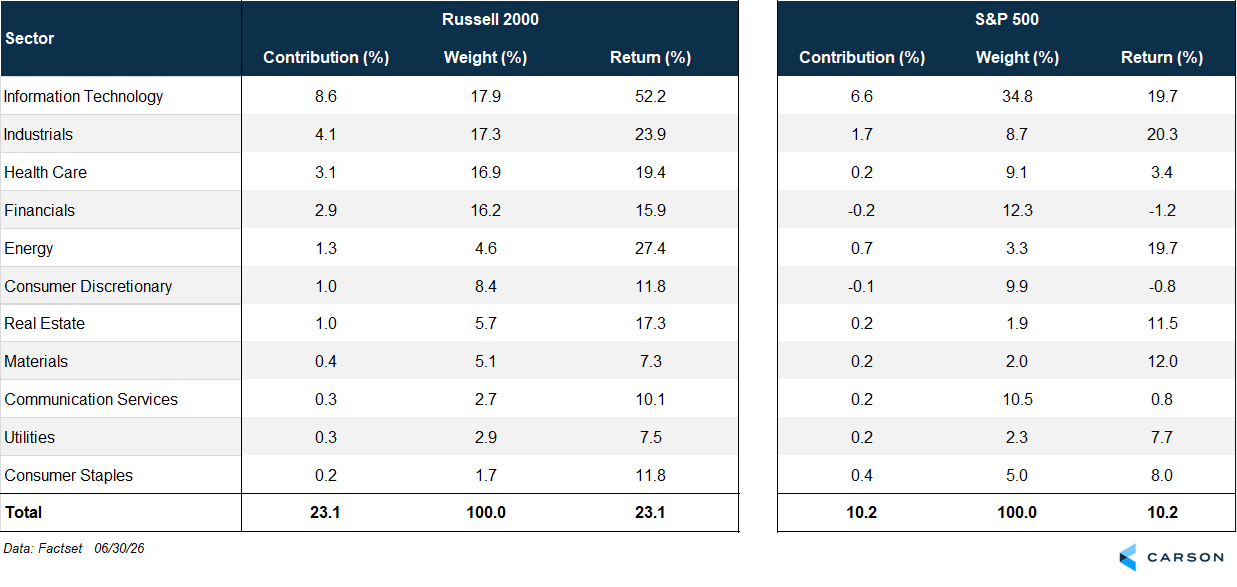
I looked at the attribution of first half returns for the Russell 2000 by sector. Usually, small caps are dominated by financials and health care. Together they make up 33% of the basket. Technology, the largest sector, makes up almost 18% of the basket. That’s not as high as in the S&P 500 (35% weight), but it’s still significant. Still, the contributions from the technology sector make up a large part of the Russell 2000’s first half return, as they did for the S&P 500:
- Technology stocks in the Russell 2000 gained 52.0% (weighted average), contributing 8.6%-points to the index return of 23.1% (37% of the total return).
- Technology stocks within the S&P 500 index gained 19.7% (weighted average), contributing 6.6%-points to the index return of 10.2% (65% of the total return).
The next largest contributor for the Russell 2000 and the S&P 500 is the industrials sector — adding 4.1%-points to the former and 1.7%-points to the latter. Interestingly, the weighted average return for every sector in the Russell 2000 is positive, and in all but two sectors (materials and utilities), the returns are higher than the corresponding sector return in the S&P 500.
That’s the sector view, and by itself, you’d think tech directly ties in with the AI story. However, I thought it would be interesting to do a deeper dive on how much of the Russell 2000’s first half return was tied to AI. I used a couple of approaches:
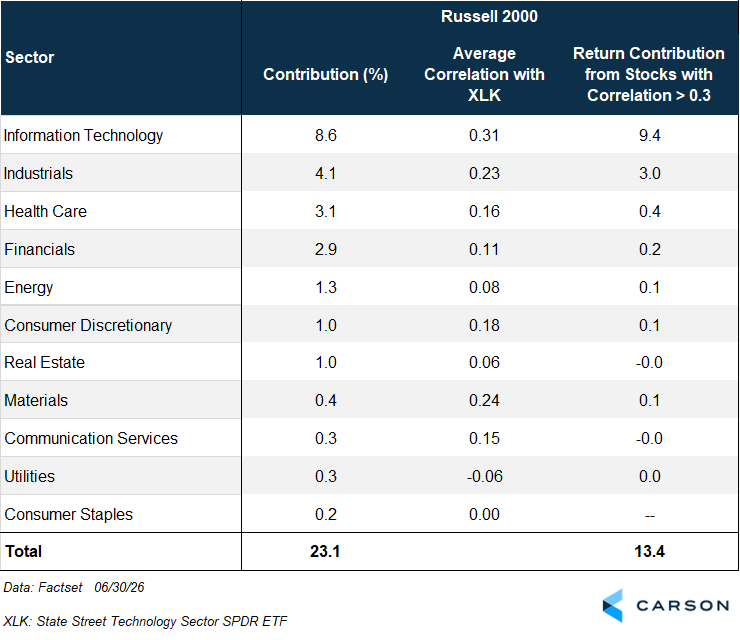
- A quantitative approach, where I looked at the correlation of all the stocks in the Russell 2000 index with the S&P 500 Technology ETF (XLK) over the past year, and added the return contribution from stocks with a significant correlation to technology (greater than 0.3)
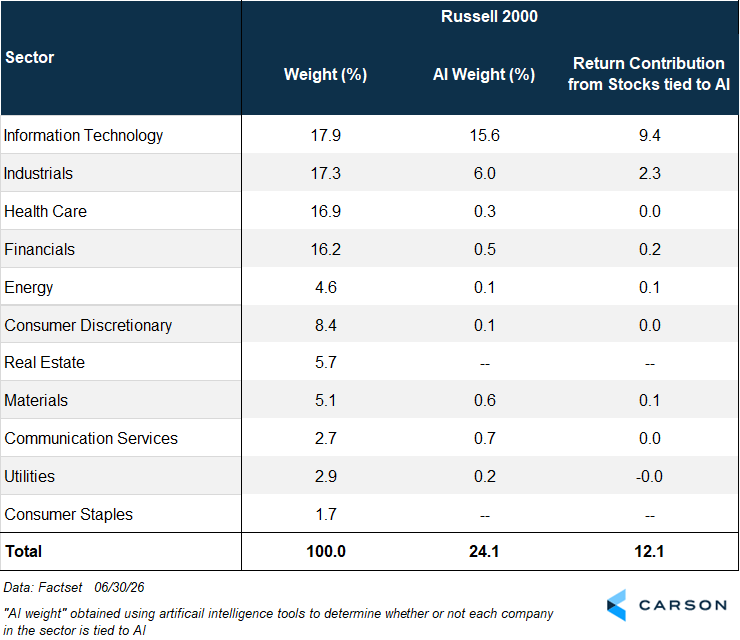
- A qualitative approach, where I used an AI engine (LLM) to tell me whether every company in the index is tied to AI in some form of the other

Stay on Top of Market Trends
The Carson Investment Research newsletter offers up-to-date market news, analysis and insights. Subscribe today!
"*" indicates required fields
The table below shows results from the quantitative approach, i.e., using the correlation to the large-cap technology sector. I’ve included the sector contributions (to overall return) and average correlations of all the stocks within each sector with XLK for reference. As you may expect, technology makes a large contribution from stocks with a significant correlation with XLK (9.4%-points). However, small cap industrial stocks that have a significant correlation with XLK contributed another 3.0%-points to the Russell 2000’s first half return. Add in contributions from companies in other sectors that are correlated to XLK, and you get a total of 13.4%-points from tech-correlated companies, i.e., 58% of the total return of 23.1%.
You could argue that large-cap tech (proxied here by XLK) is not an accurate enough proxy for AI. That’s why I thought it would be interesting to corroborate the above results with the second approach, where I used an AI engine to obtain a more qualitative assessment (using text) of whether or not each stock within the Russell 2000 index is tied to AI. The table below shows the weight of each sector within the Russell 2000, the weight tied to AI, as well as the return contribution from those stocks tied to AI. A few observations:
- Based on this approach, 24% of the Russell 2000 index is tied to AI.
- 52% of the total first half return of the Russell 2000 (12.1%-points out of 23.1%) comes from companies tied to AI.
- Beyond technology, industrials have a significant portion of companies tied to AI.
- The fact that AI-exposed stocks contributed over half the return despite making up just a quarter of the index tells you that returns for these companies are much larger than companies not tied to AI.
Here’s a look at the top 15 contributors to the small-cap industrials sector. Of these, based on our AI engine analysis, 13 have ties to AI:
- 10 of the 15 have clear exposure to data centers, data-center power, cooling, electrical systems, site work, or AI compute power delivery.
- Additional areas tied to AI include clean-power electrification, semiconductor equipment/supply chain, and even defense-related AI.
From the table below, you can see the massive first-half returns for all these names, none of which are technology stocks, let alone large caps. (Note that these names are being mentioned for top-down analytic purposes only — this is not a recommendation.)
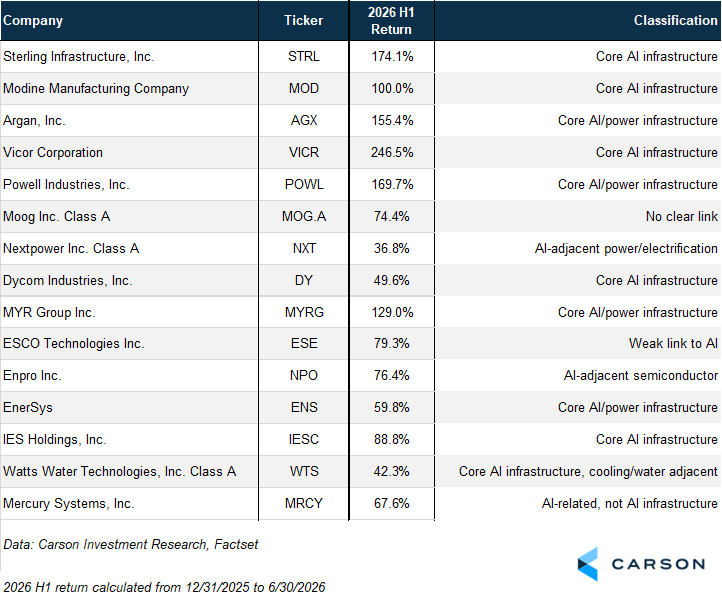
Of course, the qualitative approach is not an exact science, and there’s some irony in using AI to classify the stocks. Still, the quantitative approach tells us the same story.
The big picture is that over half of the first half return for the Russell 2000 is tied to AI, irrespective of which approach you take. The AI wave showed up in a big way even outside of large cap chip stocks in the first half of 2026. That doesn’t mean other sectors (even within the Russell 2000) didn’t do well. They did. But the analysis highlights that stocks tied to the AI wave made contributions well beyond the technology sector. That matters for portfolio diversification, especially if the AI wave crashes. Using size, sector, style, or region alone won’t tell you what your AI exposure is, whether you want it or are trying to avoid it.
For more content by Sonu Varghese, Chief Macro Strategist, click here.
9013011.1. – 8JULY26A