
“A cynic is a man who knows the price of everything, and the value of nothing.” Oscar Wilde
After stocks gained more than 2% in July, the first day of August landed with a thud, as the S&P 500 fell 1.60%, the first 1% drop since before Flag Day (June 13) and worst overall single day since a 1.61% drop on May 21. The truth is after a 28% rally and a historically calm market the past few months, some type of well-deserved volatility and a potential pause is perfectly normal.
Let’s take a look at some bad news and some good news in today’s blog.
The Bad News
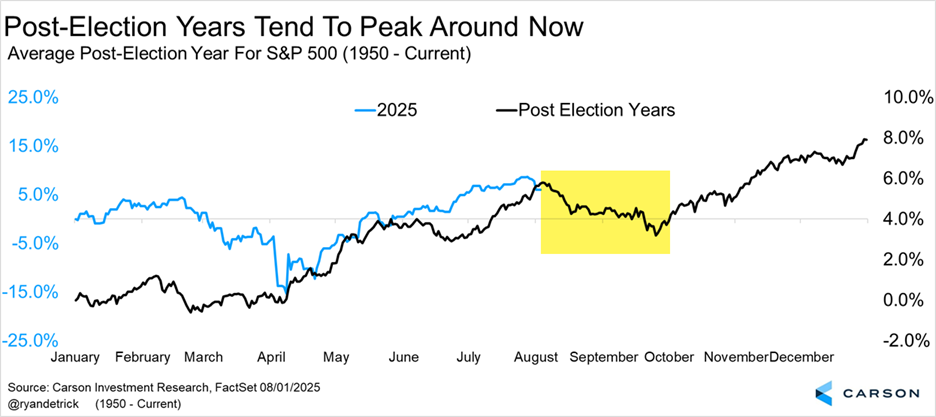
We will start with the bad news. Let’s be clear, we still see more good news than bad news and expect this bull market to continue into year end, but as we noted in Here Comes August, Buckle Up, this month tends to be volatile, especially in post-election years.
Taking this is step further, the average post-election year peaks in early August and tends to bottom in late October.
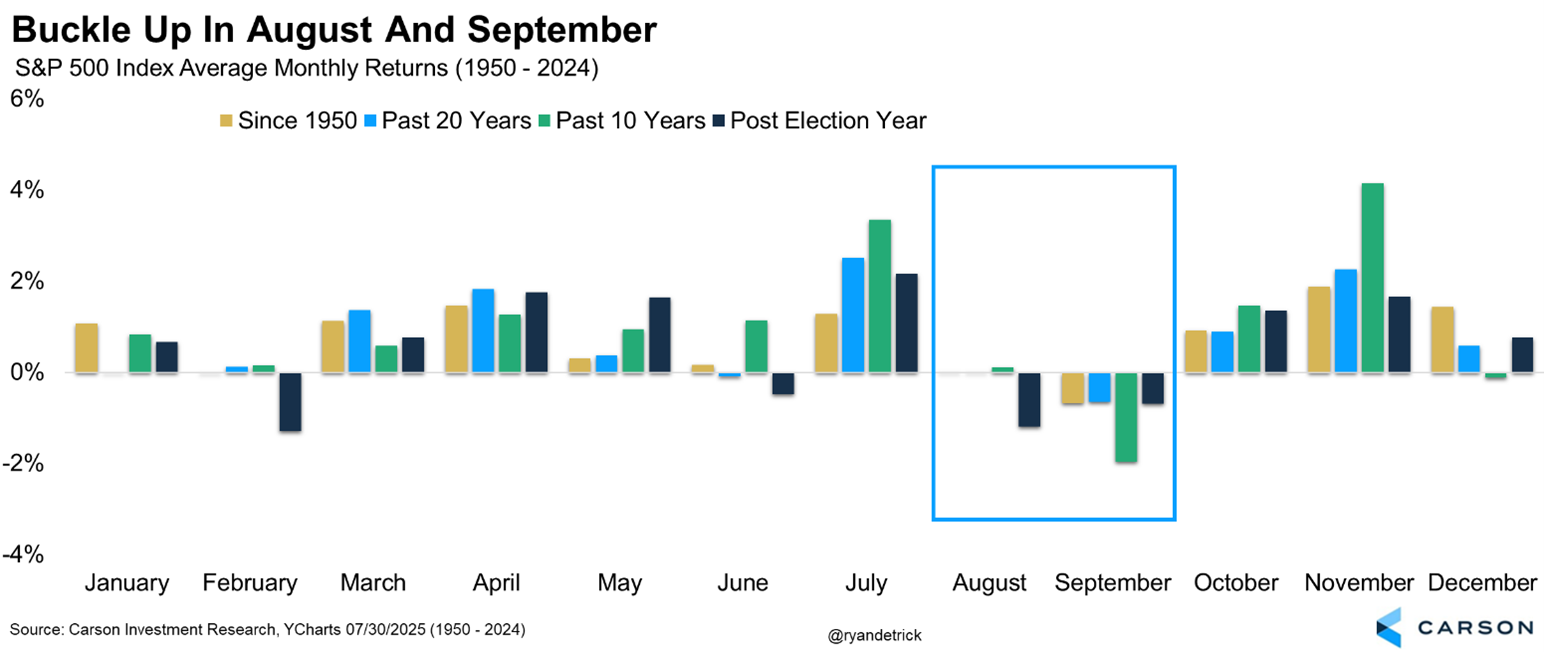
Here’s another way of showing that the next two months could be a headwind for the bulls. We’d like to remind readers we don’t suggest ever blindly investing in calendar effects, but it is good to have a gauge for what seasonality could bring and we are in the worst part of the calendar historically.
Some other bad news is the economy is clearly slowing down, yet the Federal Reserve Bank (Fed) is standing pat and refusing the cut interest rates. We discussed this in more detail in The Economy Is Currently Being Held Up By AI, but a slowing economy could be another worry going forward.
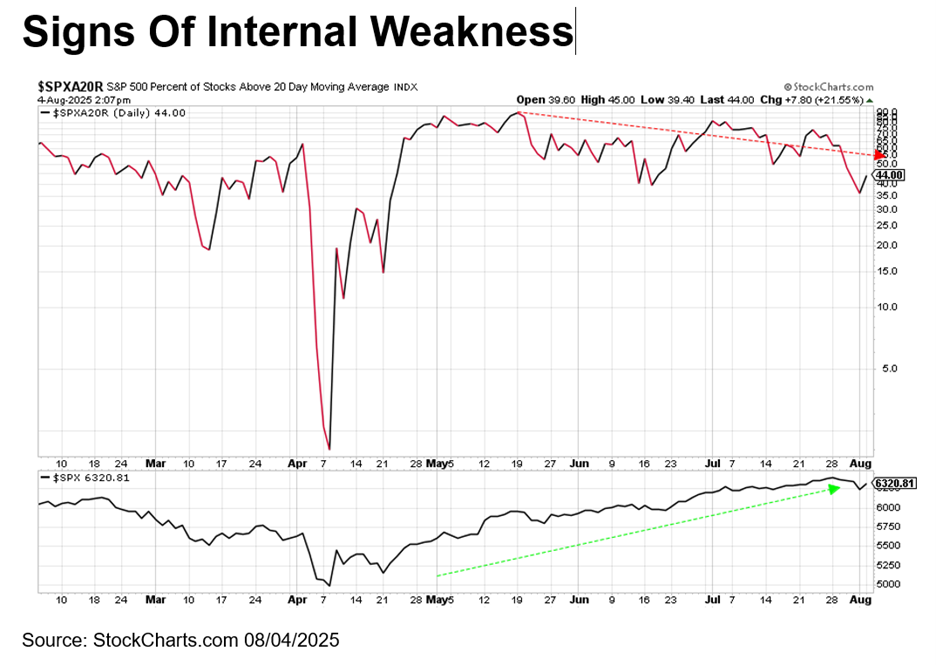
Lastly, we are seeing some potential signs of technical weakness, as the number of stocks above their 20-day moving average has been trending lower (after peaking back in May), even as indexes overall have moved higher. This isn’t end of world stuff, but it is a clue the footing for the bulls could be weakening.
The Good News
Ok, enough of that. I’m a glass half full type of person, so let’s now get to the good news.
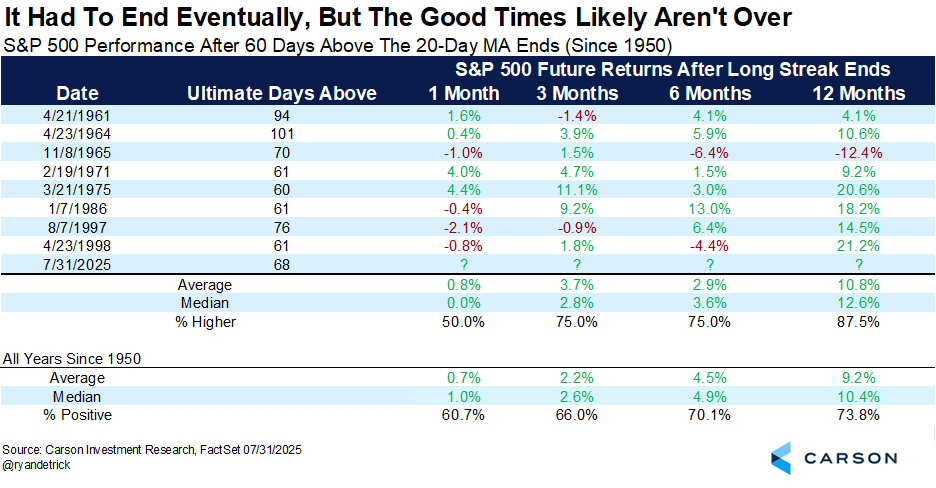
Friday’s big drop brought with it the first close for the S&P 500 beneath the 20-day moving average after an incredible 68 trading days above it, the longest streak since 1998. We found eight other times the index was above the 20-day moving average at least 60 days and the good news is after these long streaks ended it didn’t mean the bulls stopped having fun.
A year later, stocks were higher seven out of eight times and the past four times (going back 50 years) stocks were up each time, with a 14% gain the worst year while two years saw a gain of more than 20%.
Stay on Top of Market Trends
The Carson Investment Research newsletter offers up-to-date market news, analysis and insights. Subscribe today!
"*" indicates required fields
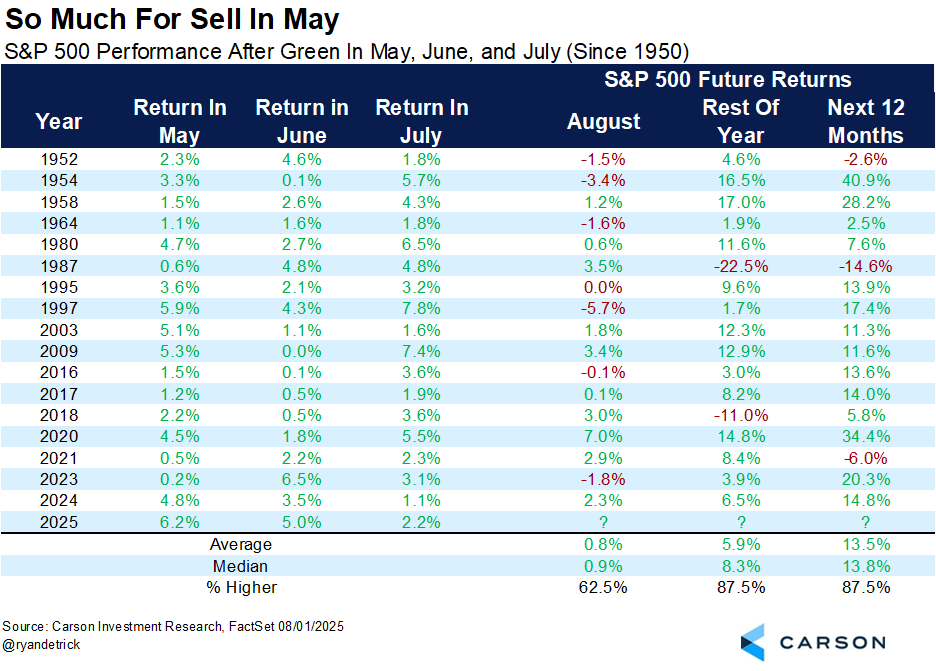
Remember Sell in May? They told us that the worst six months of the year were May through October and how stocks might struggle because of it in 2025. As you know if you are reading this, we pushed back against that narrative and expected a surprise summer rally, which fortunately has happened.
In fact, stocks were up in May, June, and July in 2025, something that has surprisingly happened three years in a row and five of the past six years. The good news is after these three months are higher, the rest of the year (final five months) is higher 15 out of 17 times and up nearly six percent on average with more than an 8% median return. Good news indeed for the bulls.
So there you have it, some bad news and some good news. Overall, worries are increasing, but we remain in the camp stocks will be higher (maybe by a decent amount) by year-end. As always, thank you for reading and hopefully you can enjoy the last few weeks of summer. For more of our take on why stocks can’t always go up, be sure to watch our latest Carson Take Five video below, live from the great city of Chicago!
8250170.1-08.05.25A
For more content by Ryan Detrick, Chief Market Strategist click here
