
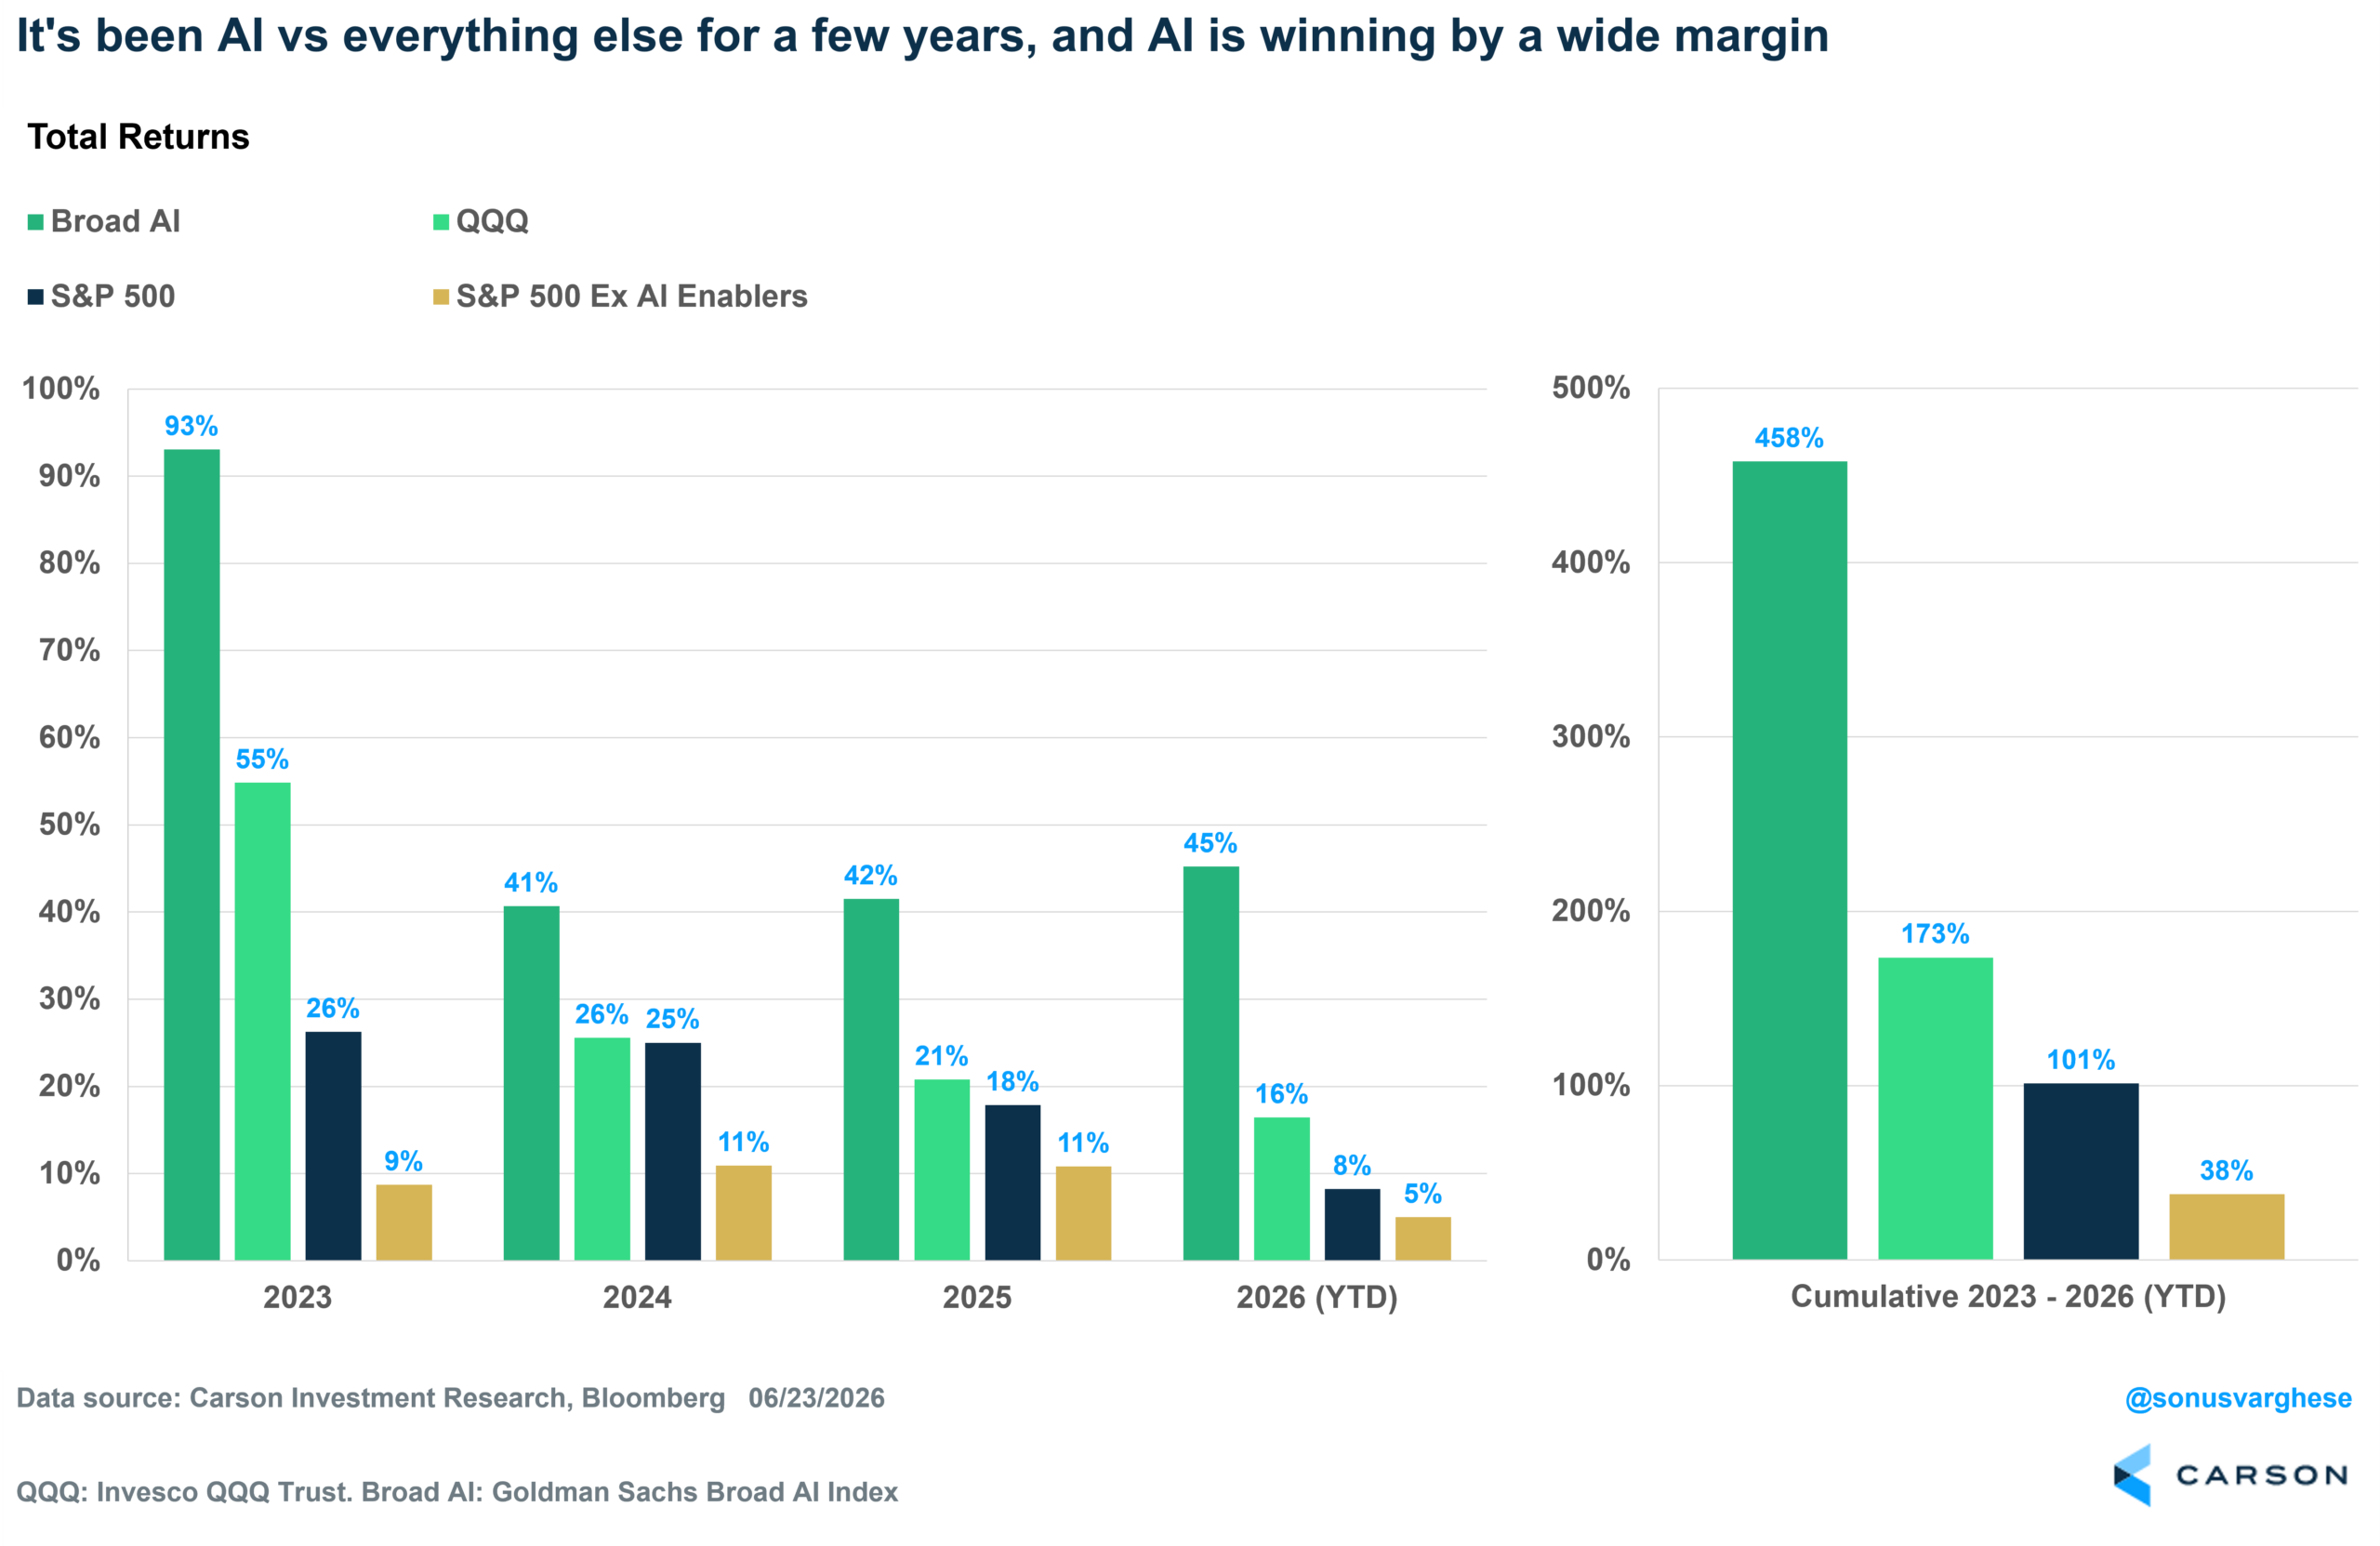
There I said it, the word “bubble.” To be honest, I don’t know if we’re in the middle of a bubble, and certainly not when it might burst if we are. But I do believe we’ll look back on this period several years from now and recognize it as a bubble. There’s clearly something huge happening right now with AI, with potentially significant technological transformation for the economy and a huge impact on markets. On the markets front, AI is clearly on a massive run: here’s a comparison of a basket of AI stocks versus the S&P 500 and S&P 500 excluding AI-related stocks. I’ve also included the QQQ ETF as an AI-adjacent reference. Since 2023, shortly after ChatGPT was released, AI-related stocks have raced ahead of everything else.
From January 1, 2023 through June 23, 2026:
- Broad AI (Goldman Sachs US Broad AI Index): 458%
- QQQ: 173%
- S&P 500: 101%
- S&P 500 ex AI (Goldman Sachs S&P 500 ex AI Enablers Index): 38%
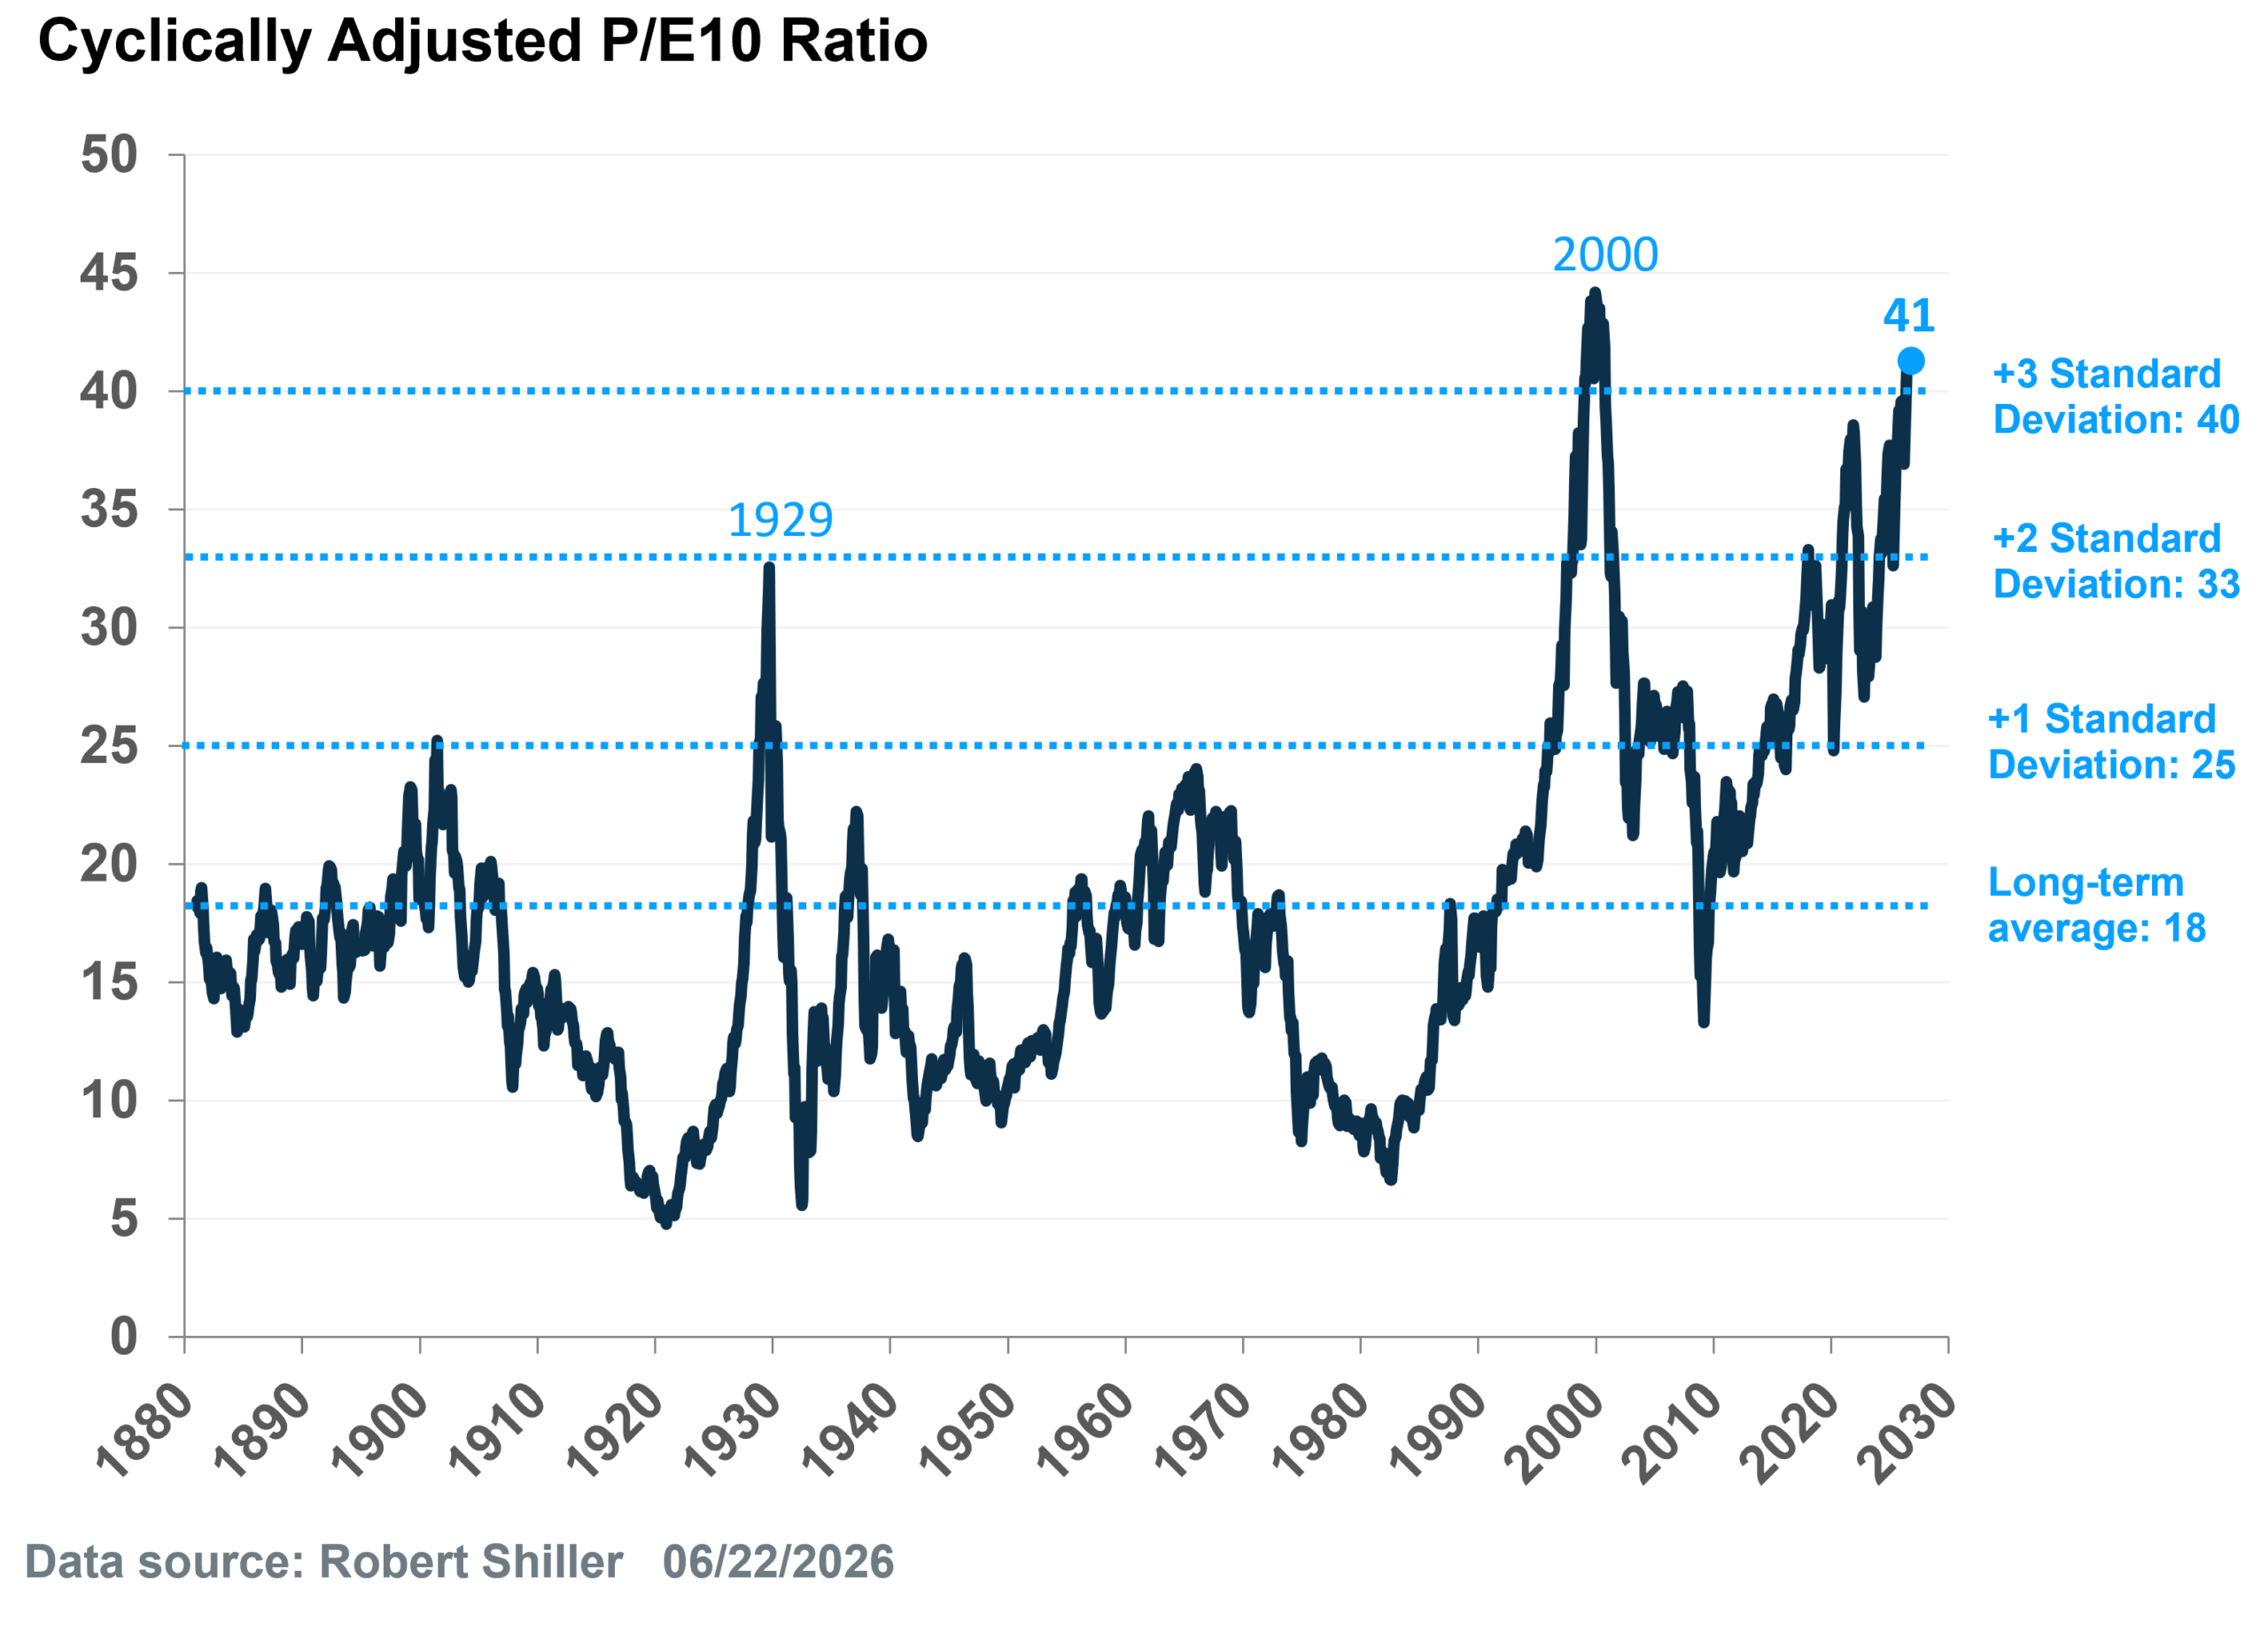
These sorts of return differentials raise bubble concerns. Valuations typically tend to be the more popular indicator of a bubble, but valuations can remain stretched for a long time. The CAPE ratio (cyclically-adjusted P/E ratio, with earnings averaged over the prior 10 years) is currently at 41, more than 3 standard deviations above its long-term average of 18 (since 1880). At the same time, it’s been above 2 standard deviations for over 2 years now, and above the 1-standard deviation level for over a decade.
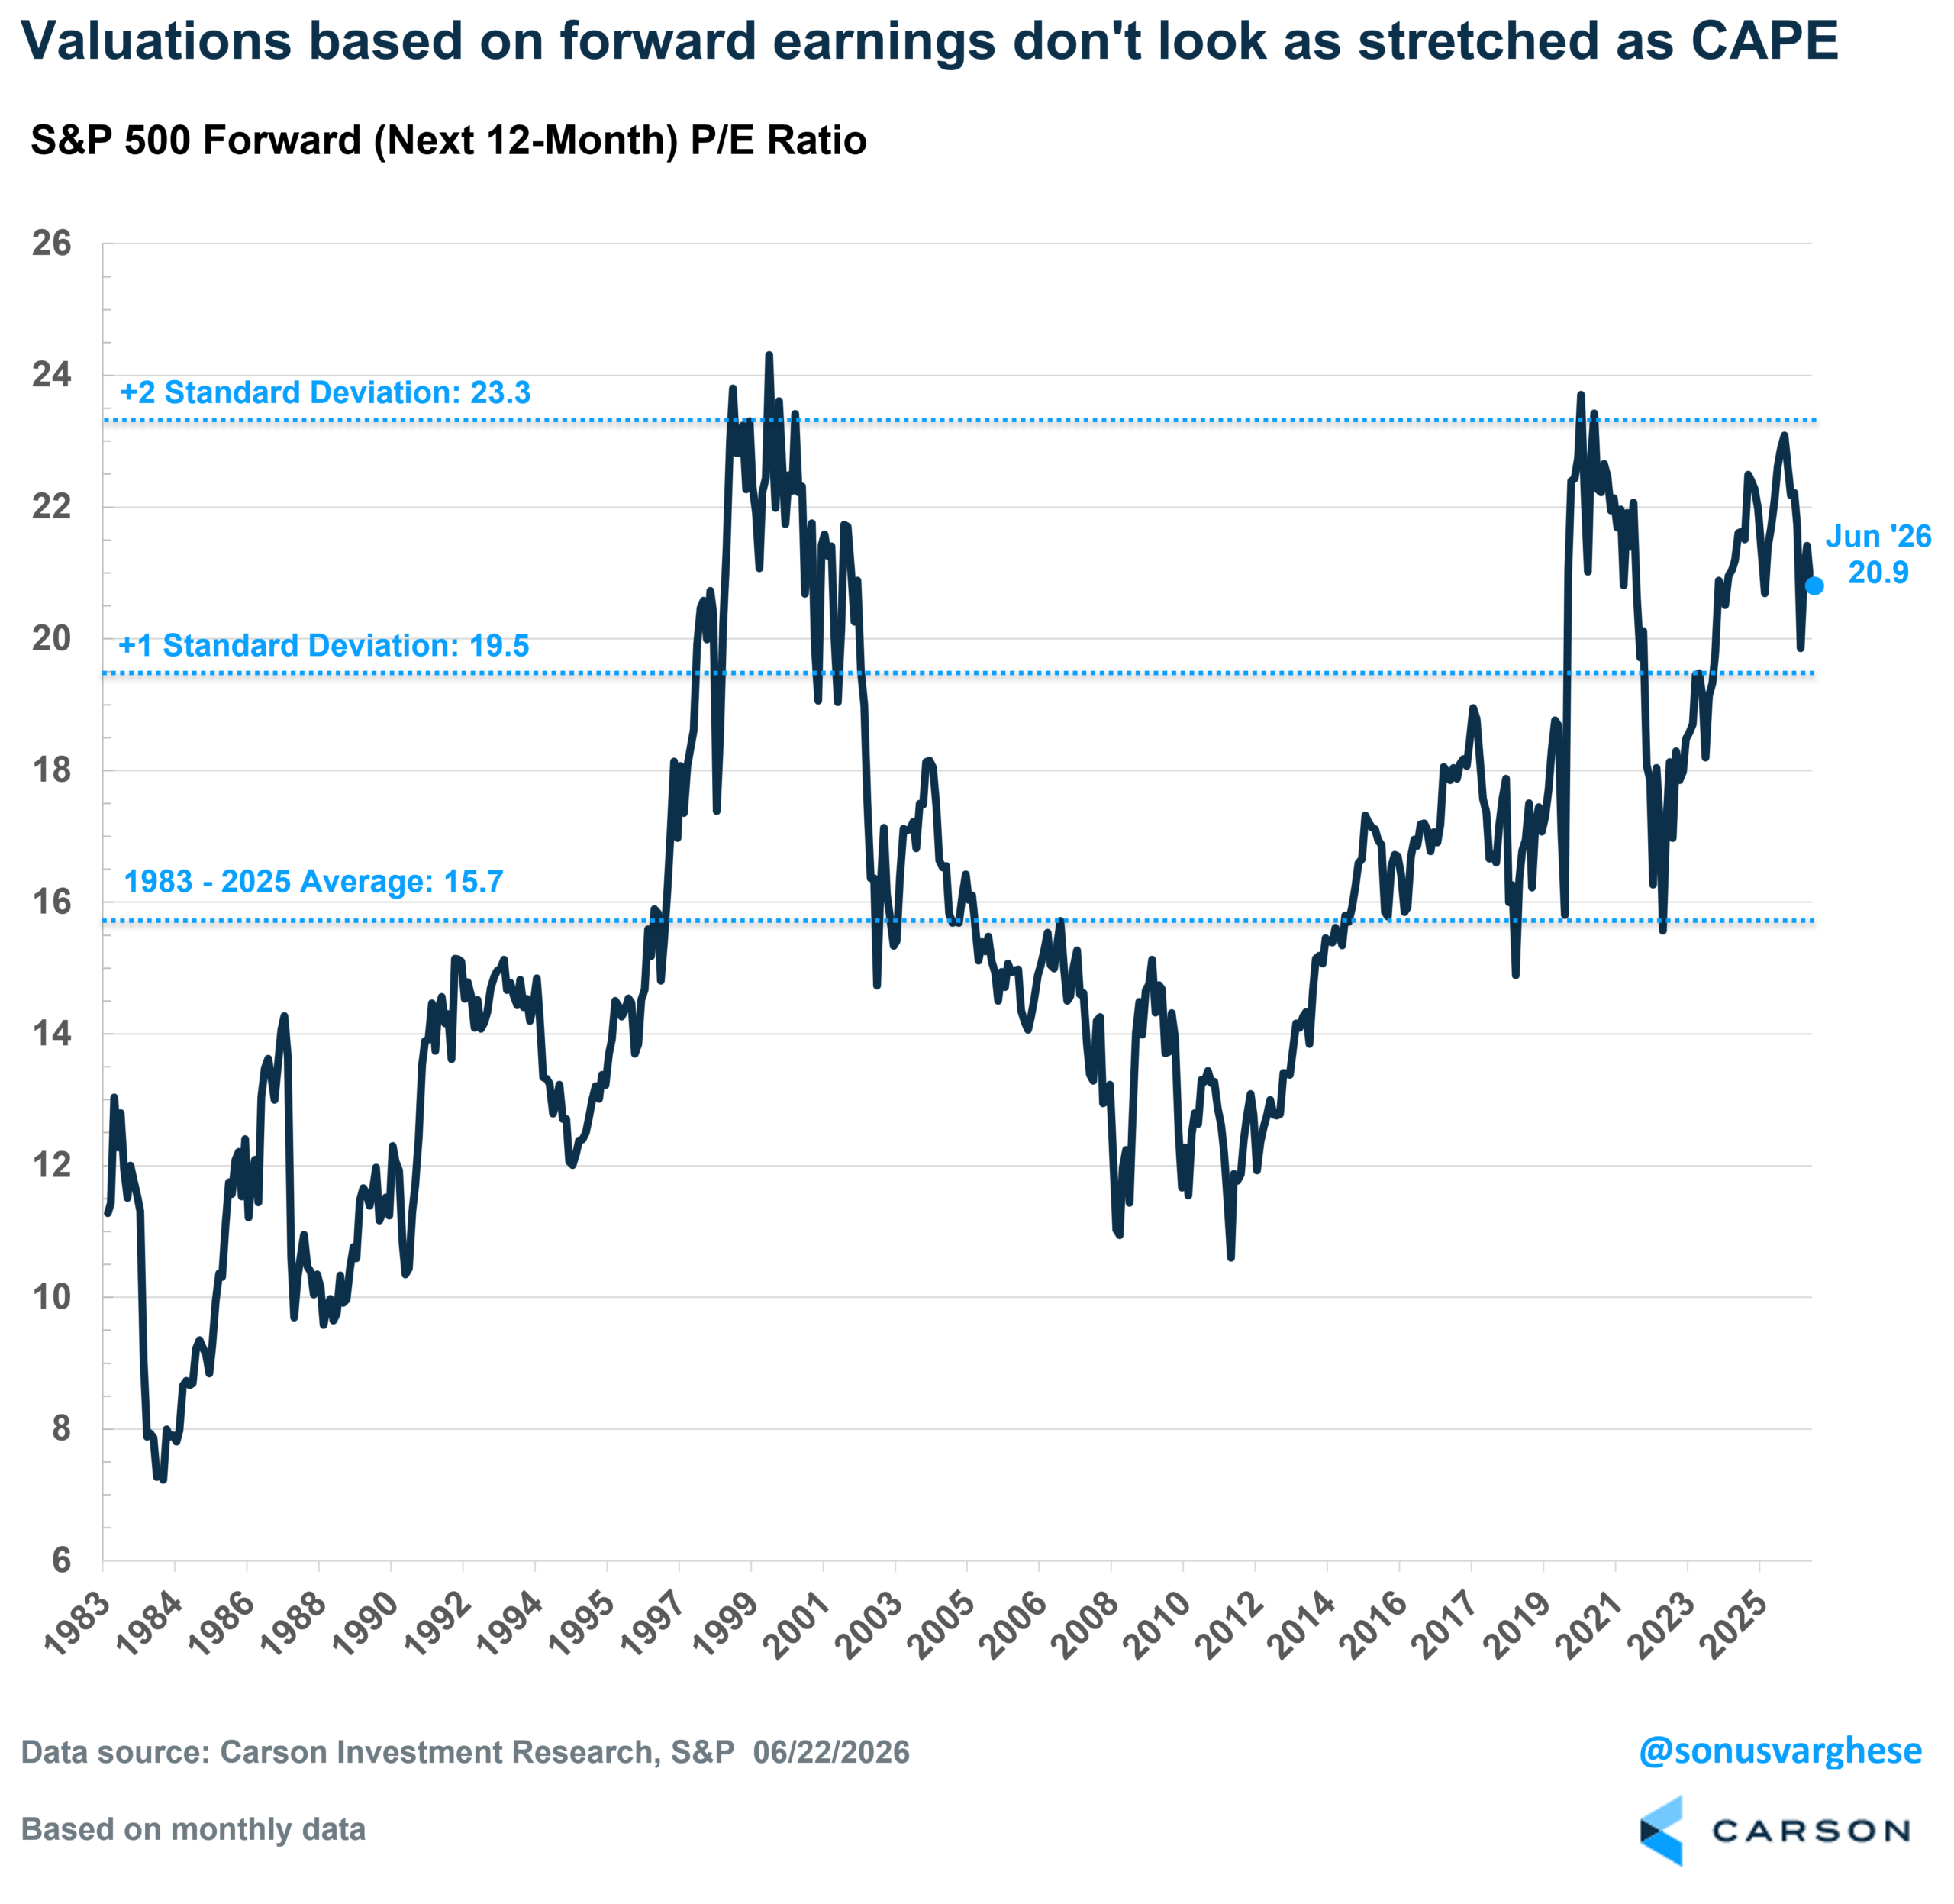
At the same time, if you look at P/E ratios using next 12-month EPS, the current level of 20.9x is just 1 standard deviation above its average level (1995-2025). That’s far from the stretched levels we see when looking at the CAPE ratio.
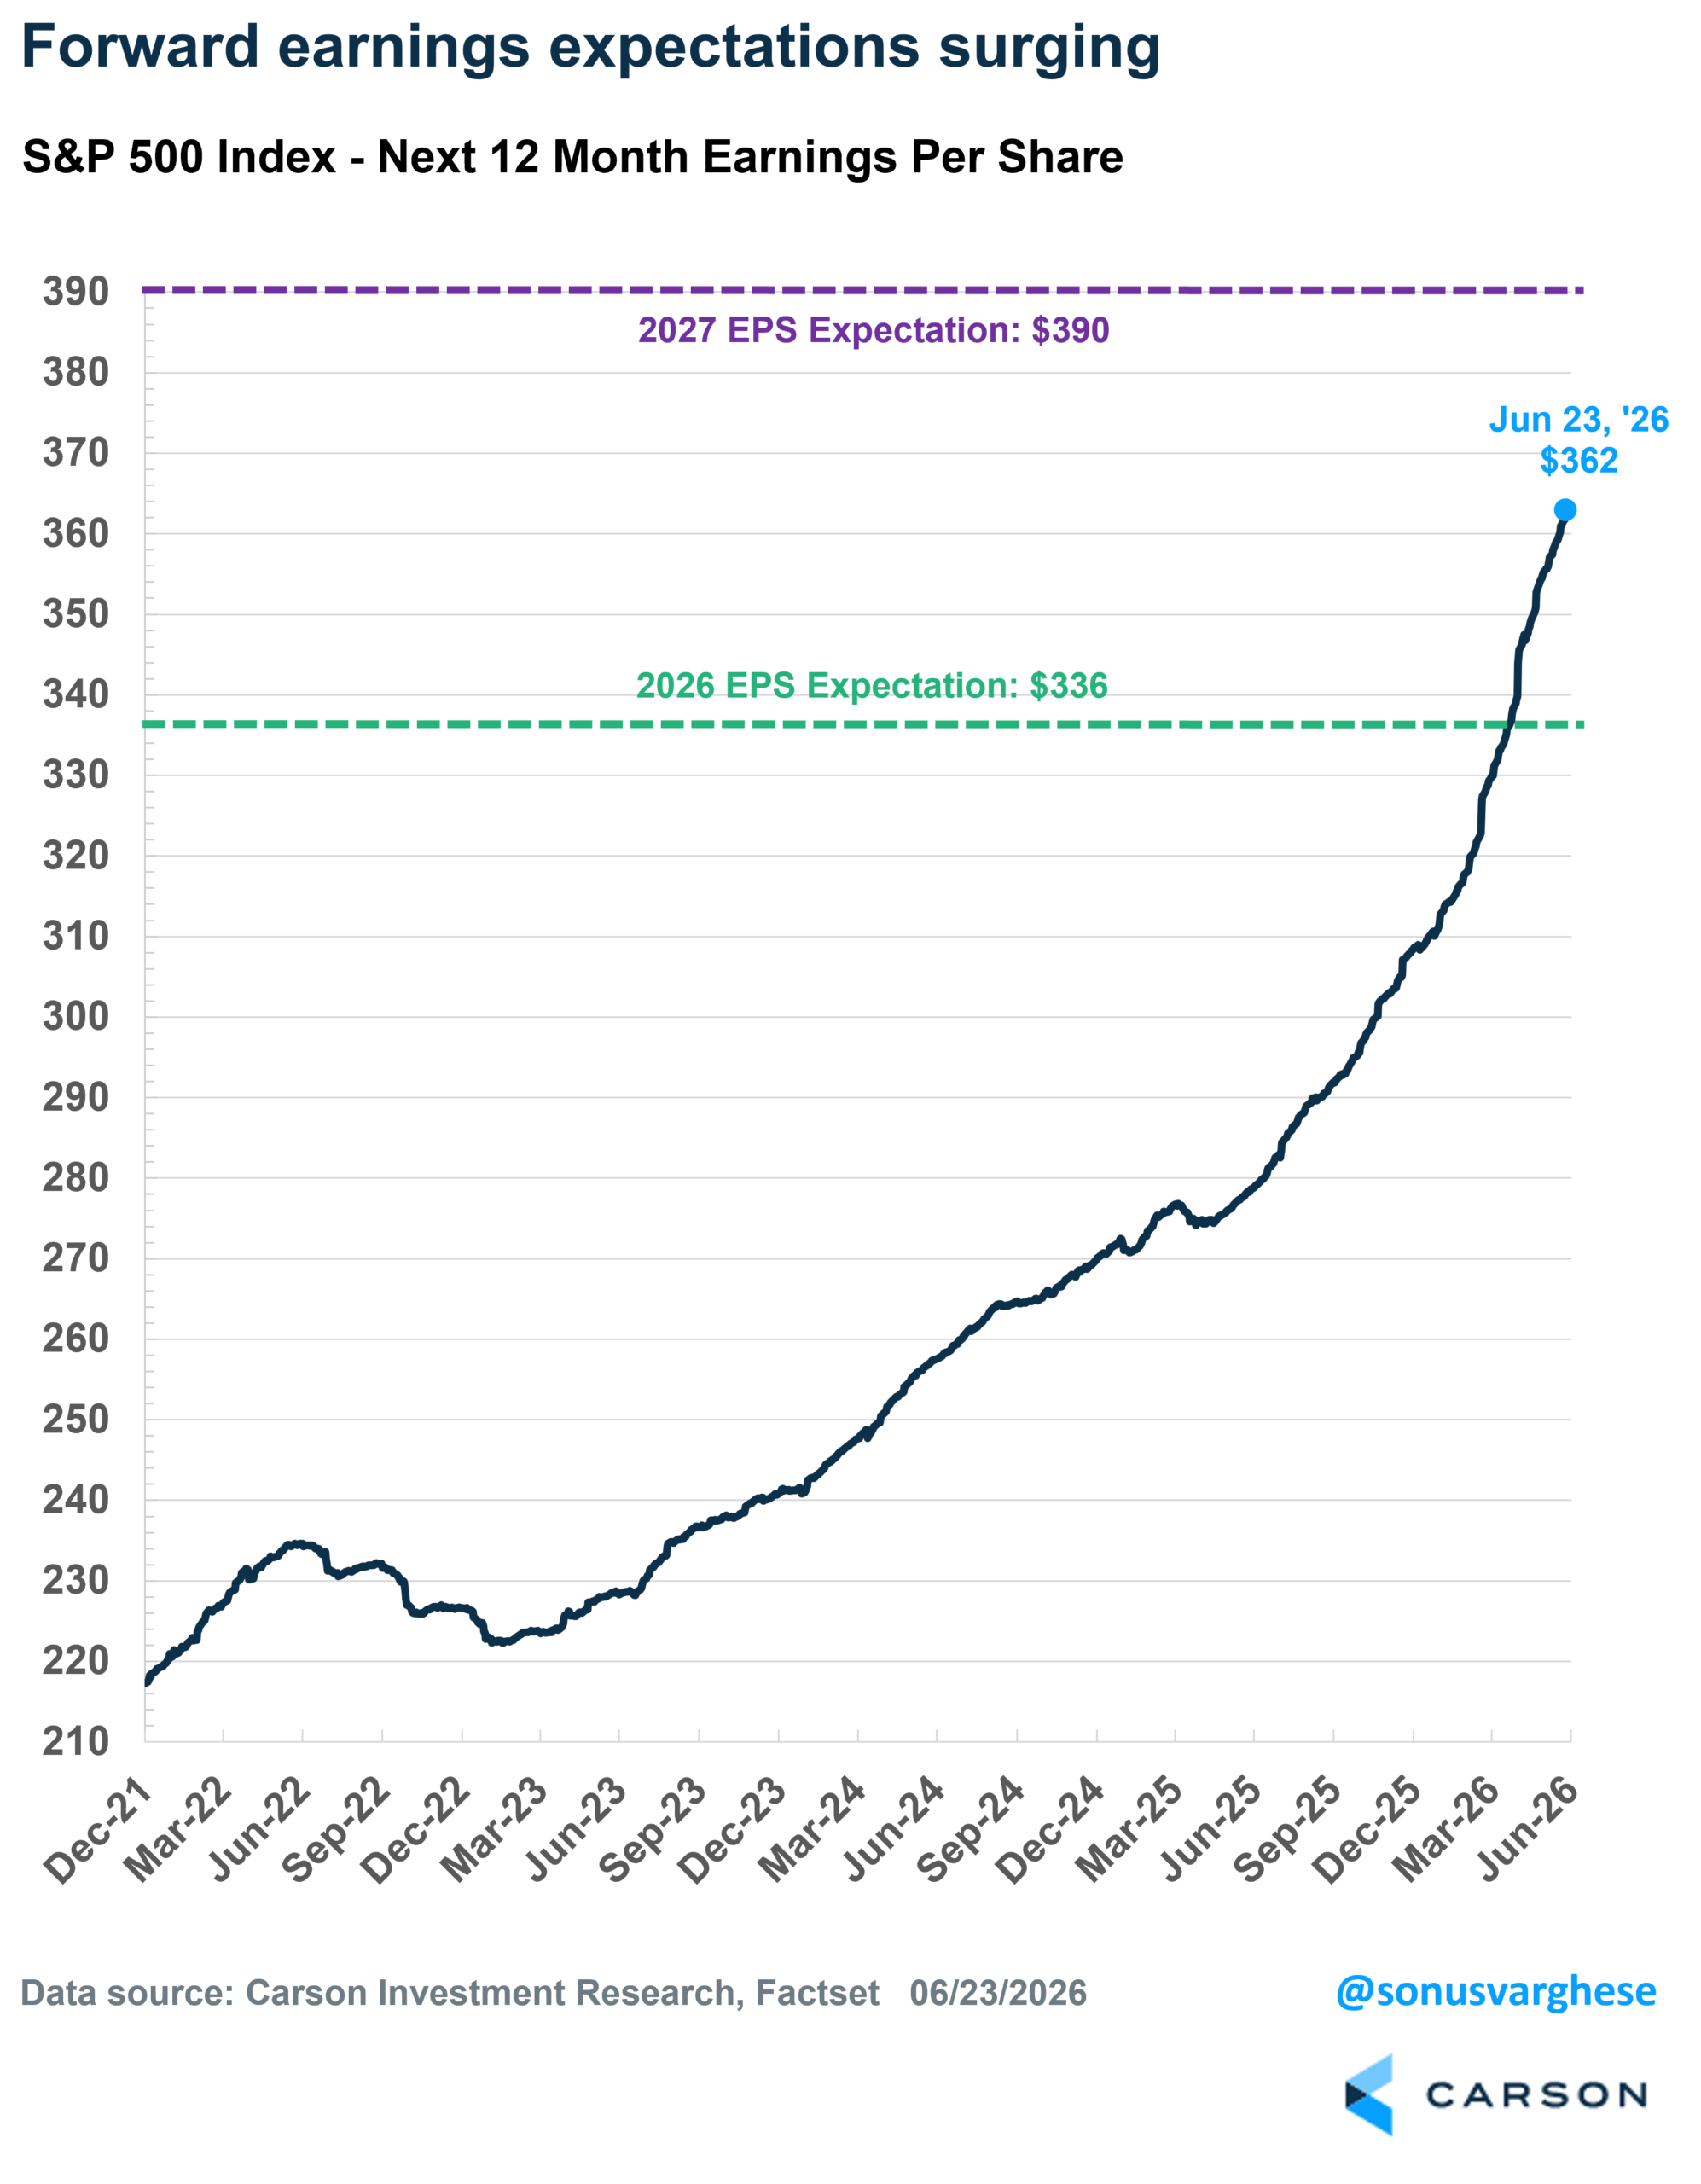
This is a result of corporate profits growing well above their long-term trend, and analysts projecting strong growth ahead as a result. Next 12-month EPS estimates are going almost vertical.
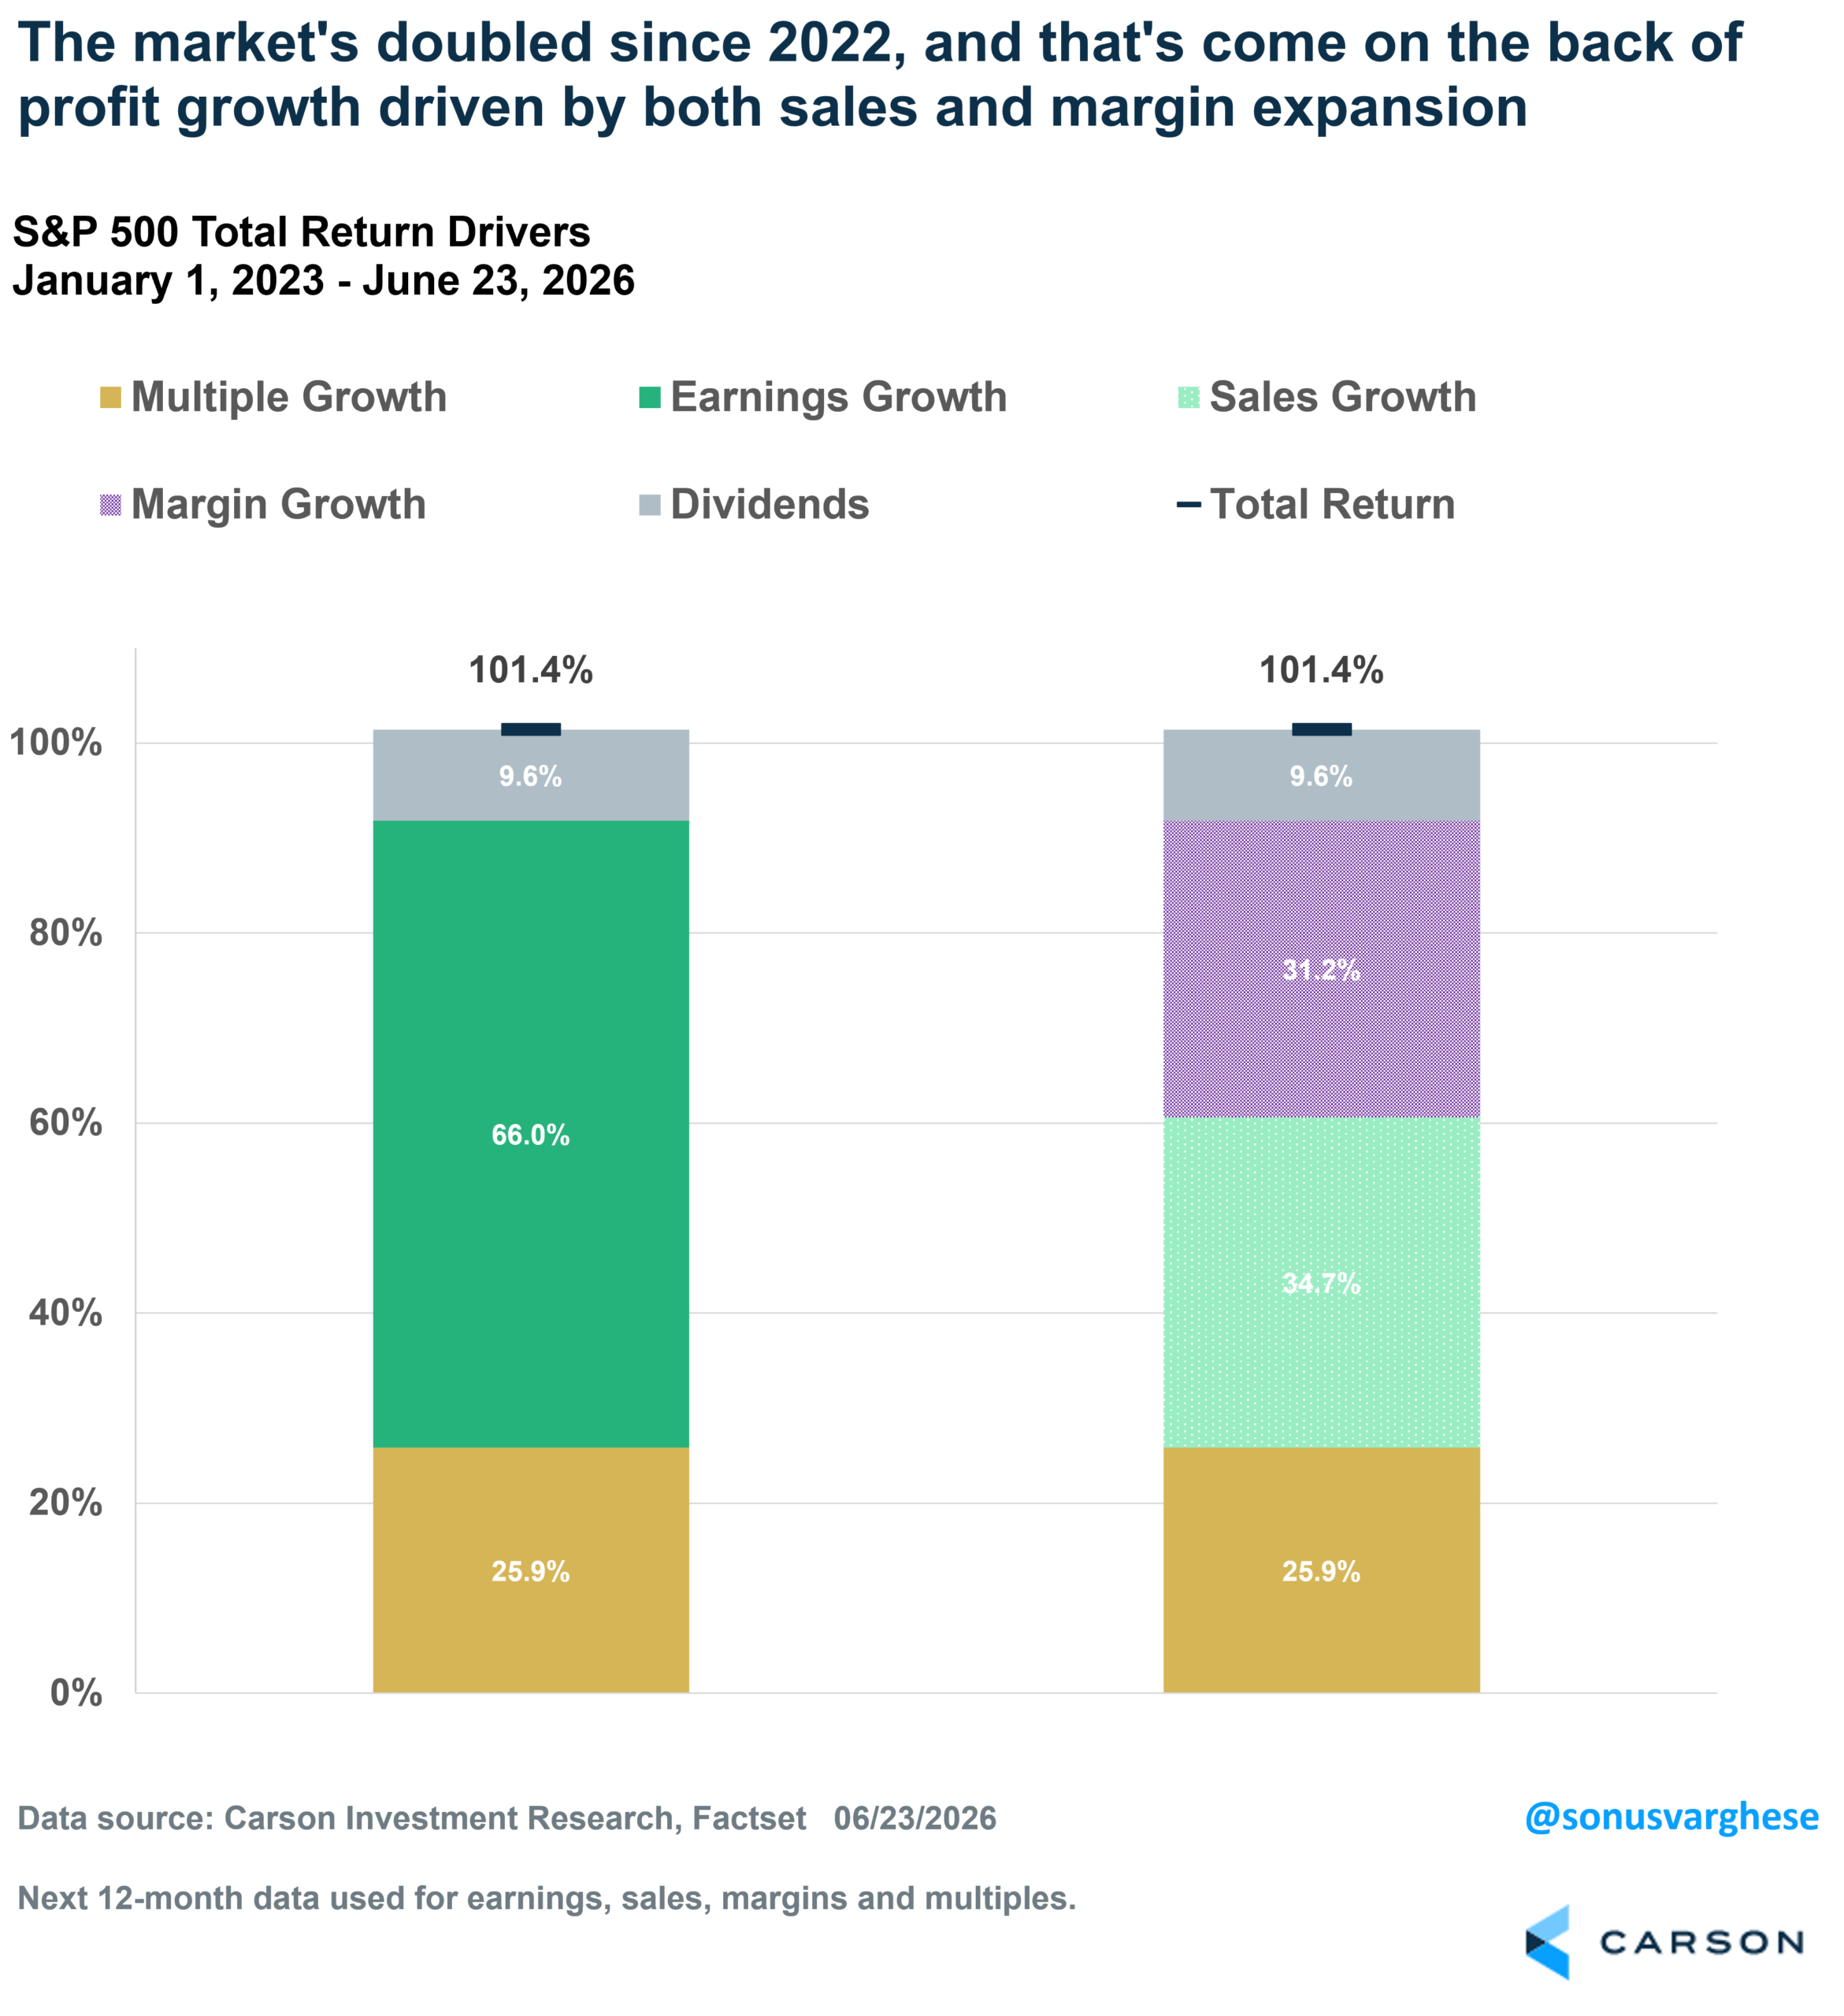
The S&P 500 has doubled since the end of 2022 (+101% return), and only 26%-points of that can be attributed to multiple expansion (valuations becoming more expensive). Profit growth contributed 66%-points, while dividends added almost 10%-points to the total return. Incredibly, this is not just a story of sales growth. Profit growth was almost equally split between sales growth (+35%-points) and margin expansion (+31%-points).
Bubble Watch: Extreme Price Dispersion
Rather than focus on valuations, which depend on the kind of measure you’re looking at, I lean toward looking at price-based measures for potential signs of a bubble. And even economic data. And right now, several numbers look quite stretched.
One thing you see during bubbles is momentum outperforming the broad index by a lot. The S&P 500 Momentum Index is up 30% YTD versus an 8.2% return for the S&P 500 (as of June 23). No surprise, this is on the back of AI-related exposure, with technology making up almost 55% of the momentum basket. The top 5 names have all outperformed the S&P 500 this year, and make up almost 40% of the basket:
- Micron at a 12% weight (+268.7% YTD)
- NVIDIA at an 8% weight (+7.4% YTD)
- Alphabet at an 8% weight (+10.4% YTD)
- Broadcom at a 7% weight (+10.2% YTD)
- Lam Research at a 4% weight (+117% YTD)
Further down the list you have stocks like AMD (+142.7% YTD), Intel (+258% YTD), and Sandisk (+727% YTD).
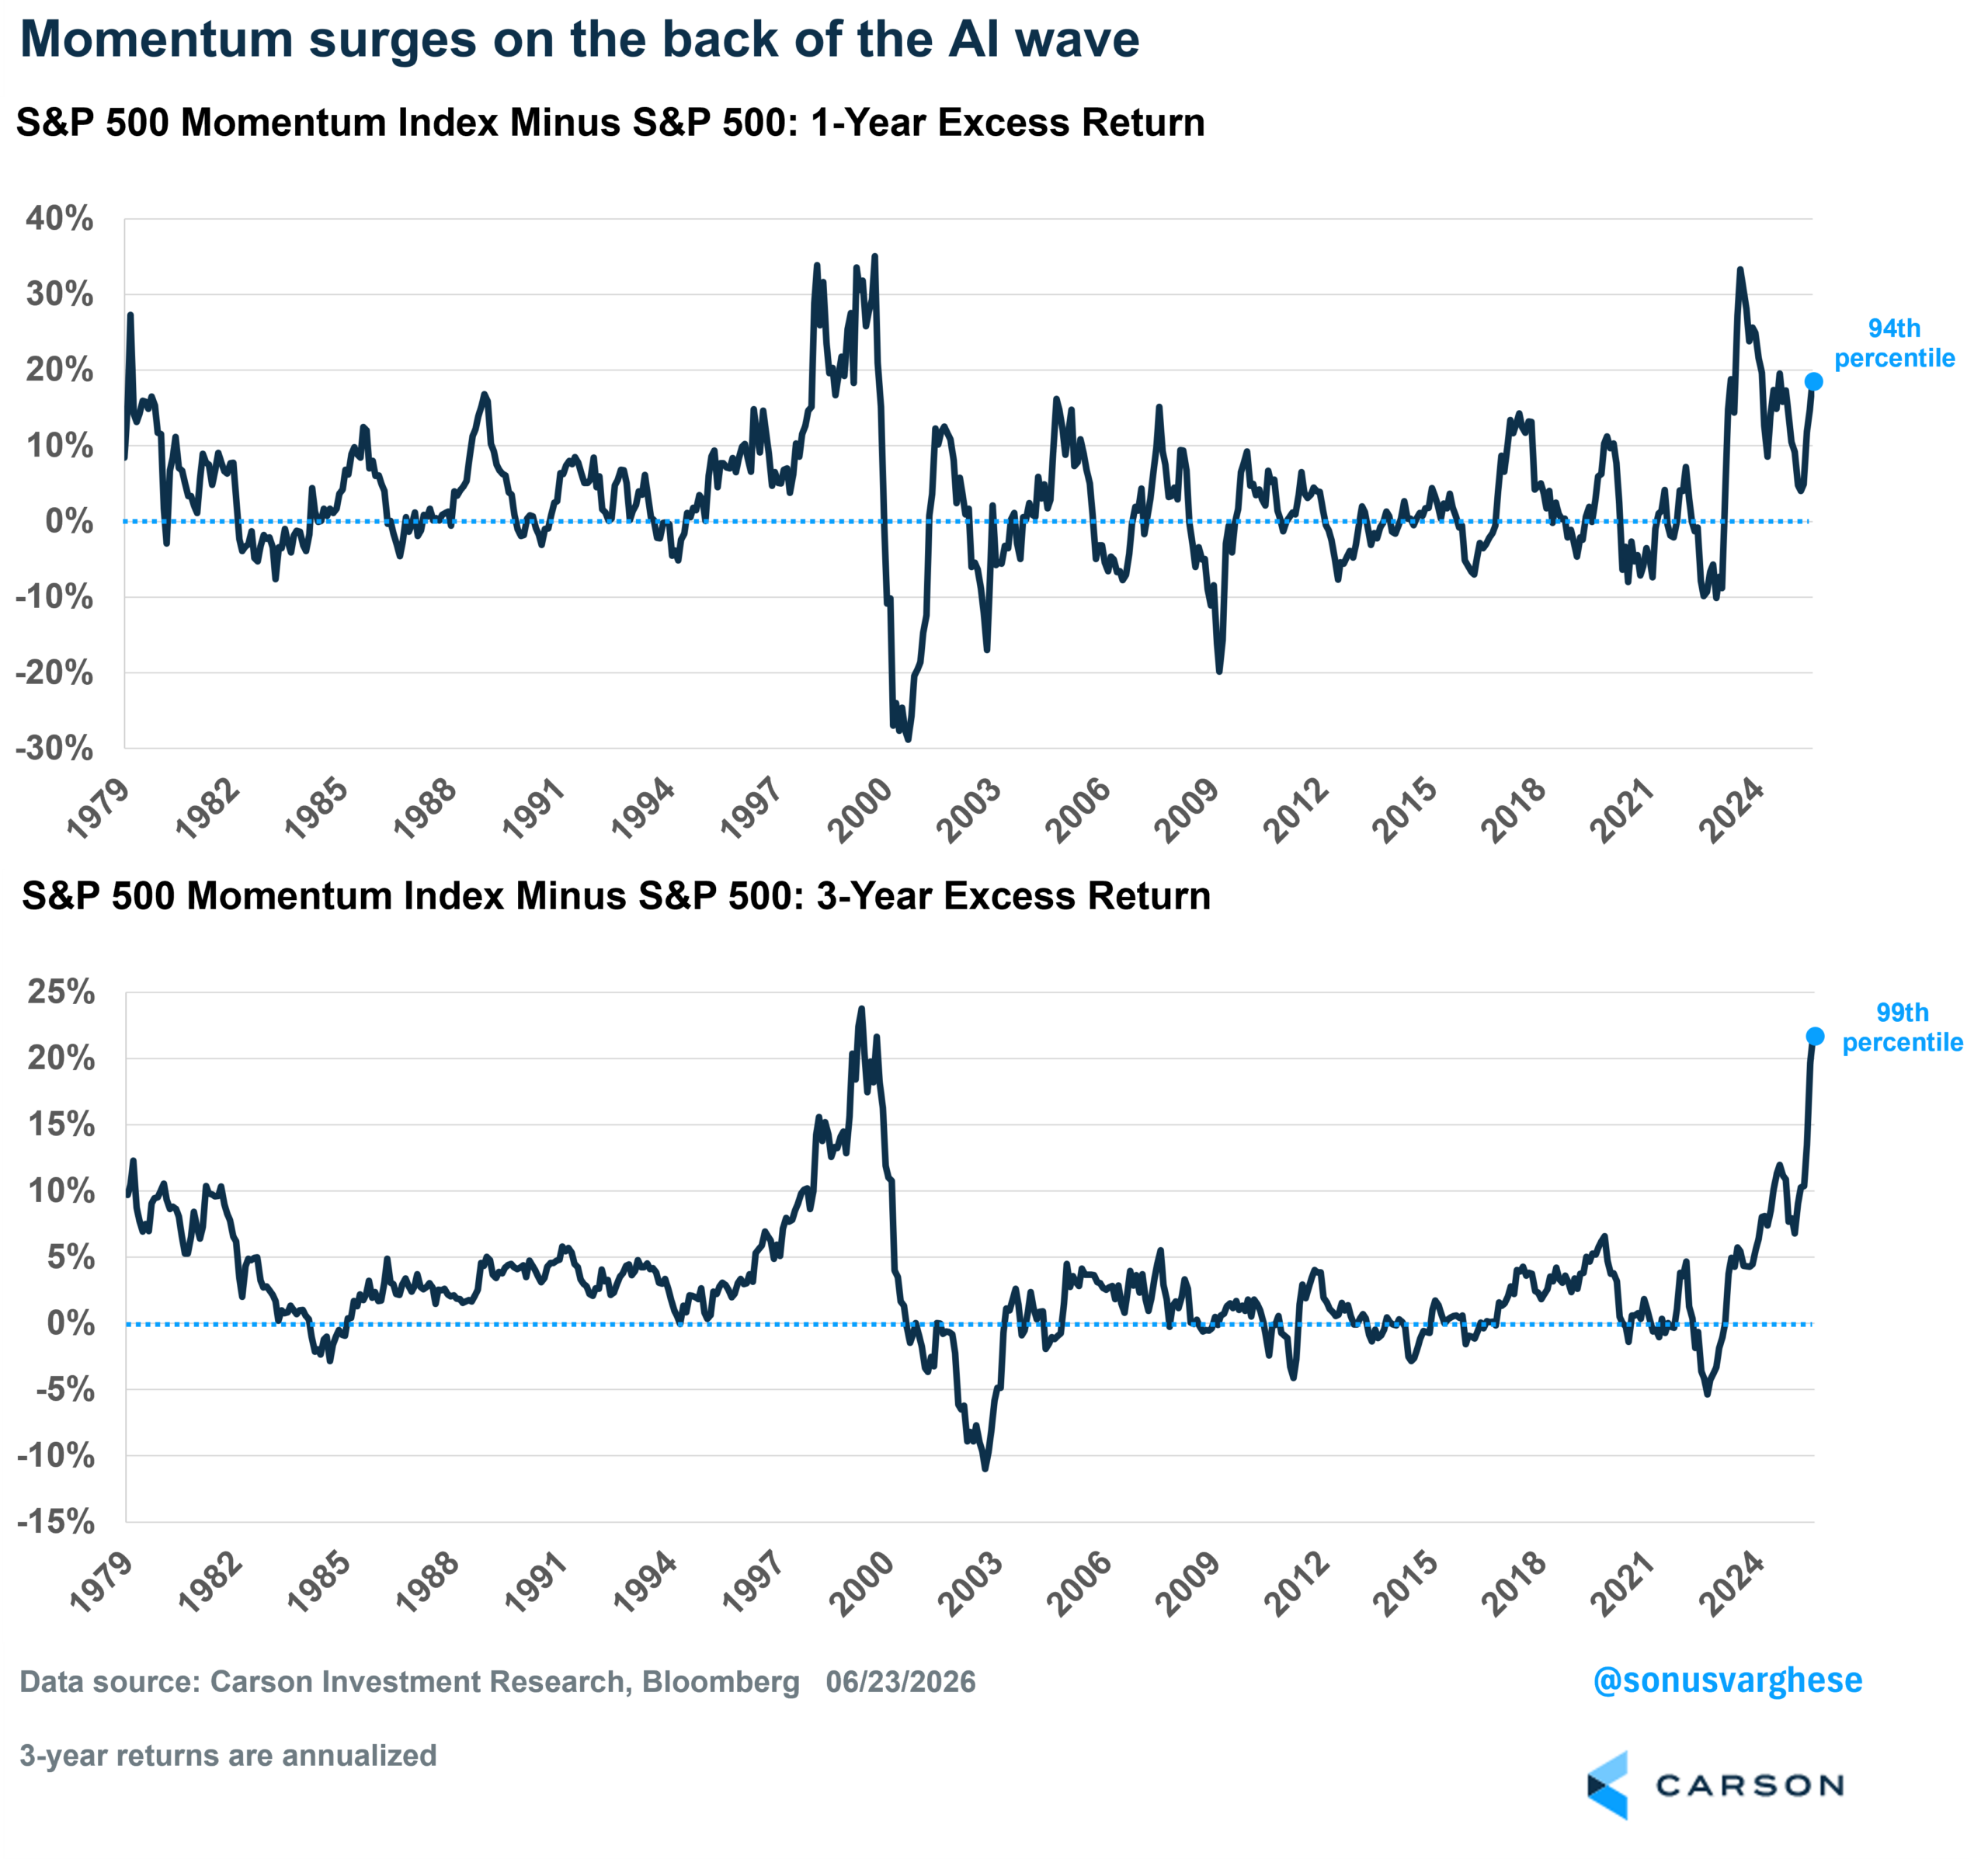
Here’s a historical perspective as to how strong momentum is. I compared the current excess return for the S&P 500 Momentum Index relative to the S&P 500 and looked at the percentile rank relative to the last 40 years, both on a 1-year rolling basis, and 3-years.
Over the last 1-year:
- S&P 500 Momentum: +37.2%
- S&P 500: +19.3%
- Excess return: +17.9%
- Percentile rank: 94th
It’s even more extended if you look at the last three years:
- S&P 500 Momentum: +40.1% (annualized)
- S&P 500: +18.5%
- Excess return: +21.6%
- Percentile rank: 99th
That’s as extreme as it gets, and almost as high as it got back in March 2000 (the peak of the dot com bubble). Of course, it could go further (and remain in the 99th – 100th percentile), but usually a pullback beckons.
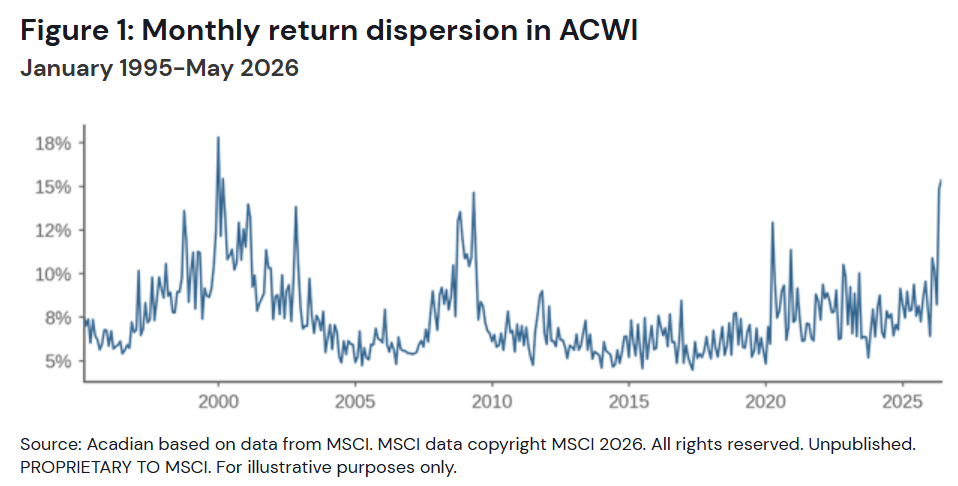
Along these lines, dispersion across stocks has also surged since April. Via Owen Lamont at Acadian, we’re seeing massive levels of return dispersion with AI excitement driving extreme price moves (including some of the stocks noted above). It’s one thing for small-cap stocks to surge 50% to 100% in a month, but highly unusual to see this in the large-cap space. Here’s a chart he shared showing monthly dispersion for the MSCI ACWI Index going back to January 1995. In this case, dispersion is the market cap weighted cross-sectional standard deviation of monthly returns across stocks in the index. As you can see, we’re at the highest levels since 2000 and 2007.
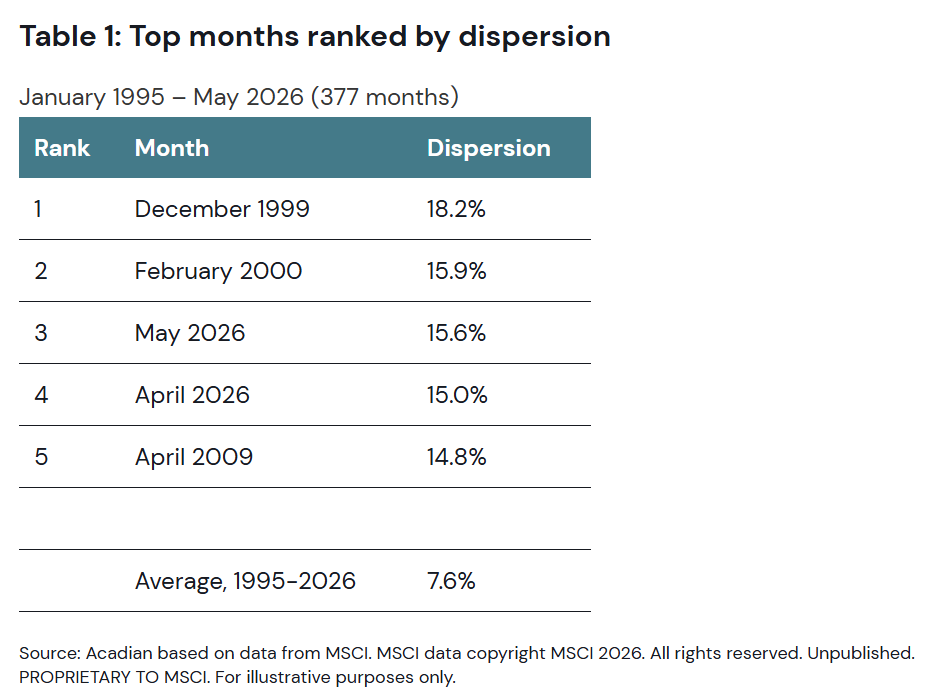
The following table shows the five highest dispersion months from 1995 – 2026 (May). April/May 2026 were extraordinary, ranking below only December 1999 and February 2000. As he points out, today’s high dispersion does not merely reflect the market’s high concentration into a small number of names. We’ve had high concentration for several years now. But the high dispersion is new.
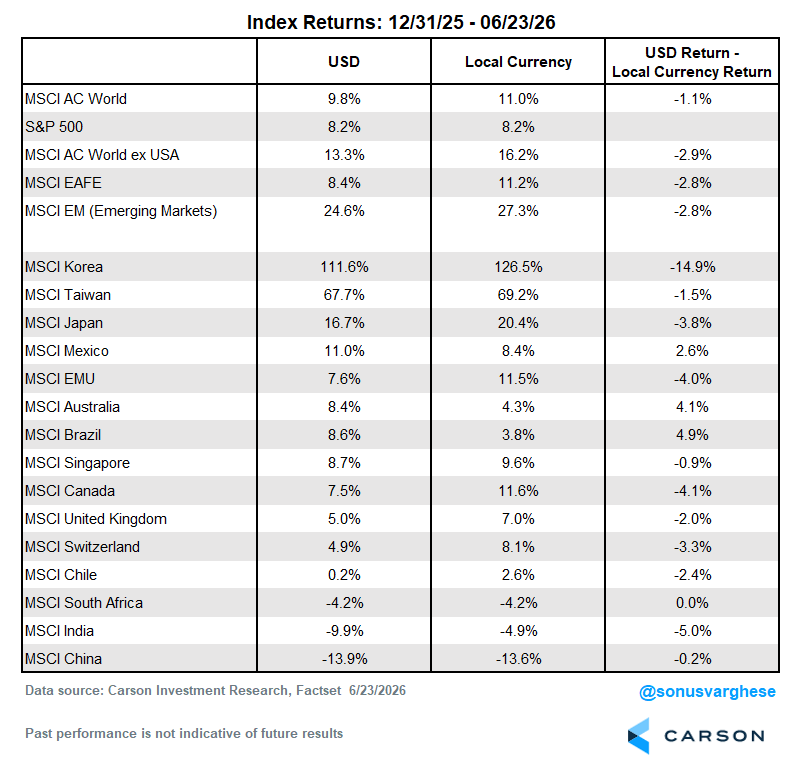
Of course, this is in large part because of the AI story playing out in places like South Korea and Taiwan as well.
- The MSCI South Korea Index is up 112% YTD and up 127% in local currency terms, driven by Samsung (+140.6%) and SK Hynix (+279.6%).
- The MSCI Taiwan Index is up 68% YTD and up 69% in local currency terms, driven by TSMC (+58%).
All this to say, be careful using international stocks to diversify AI exposure.
This high dispersion has an impact on active managers as well. Typically, high dispersion would offer potential for active managers to outperform. However, when you have these extreme levels of dispersion driven by just a few stocks, there’s a big risk of underperformance (and getting fired) if you don’t hold those stocks. As a result, active managers reduce their active bets and more closely track their benchmarks, which means they buy names that may not otherwise buy based on “fundamentals.” This results in more buying pressure for these momentum stocks, as managers who are underweight these names buy them. Momentum begets momentum, and that can continue for a while — we don’t have to see a reversal just because dispersion is really elevated.
Stay on Top of Market Trends
The Carson Investment Research newsletter offers up-to-date market news, analysis and insights. Subscribe today!
"*" indicates required fields
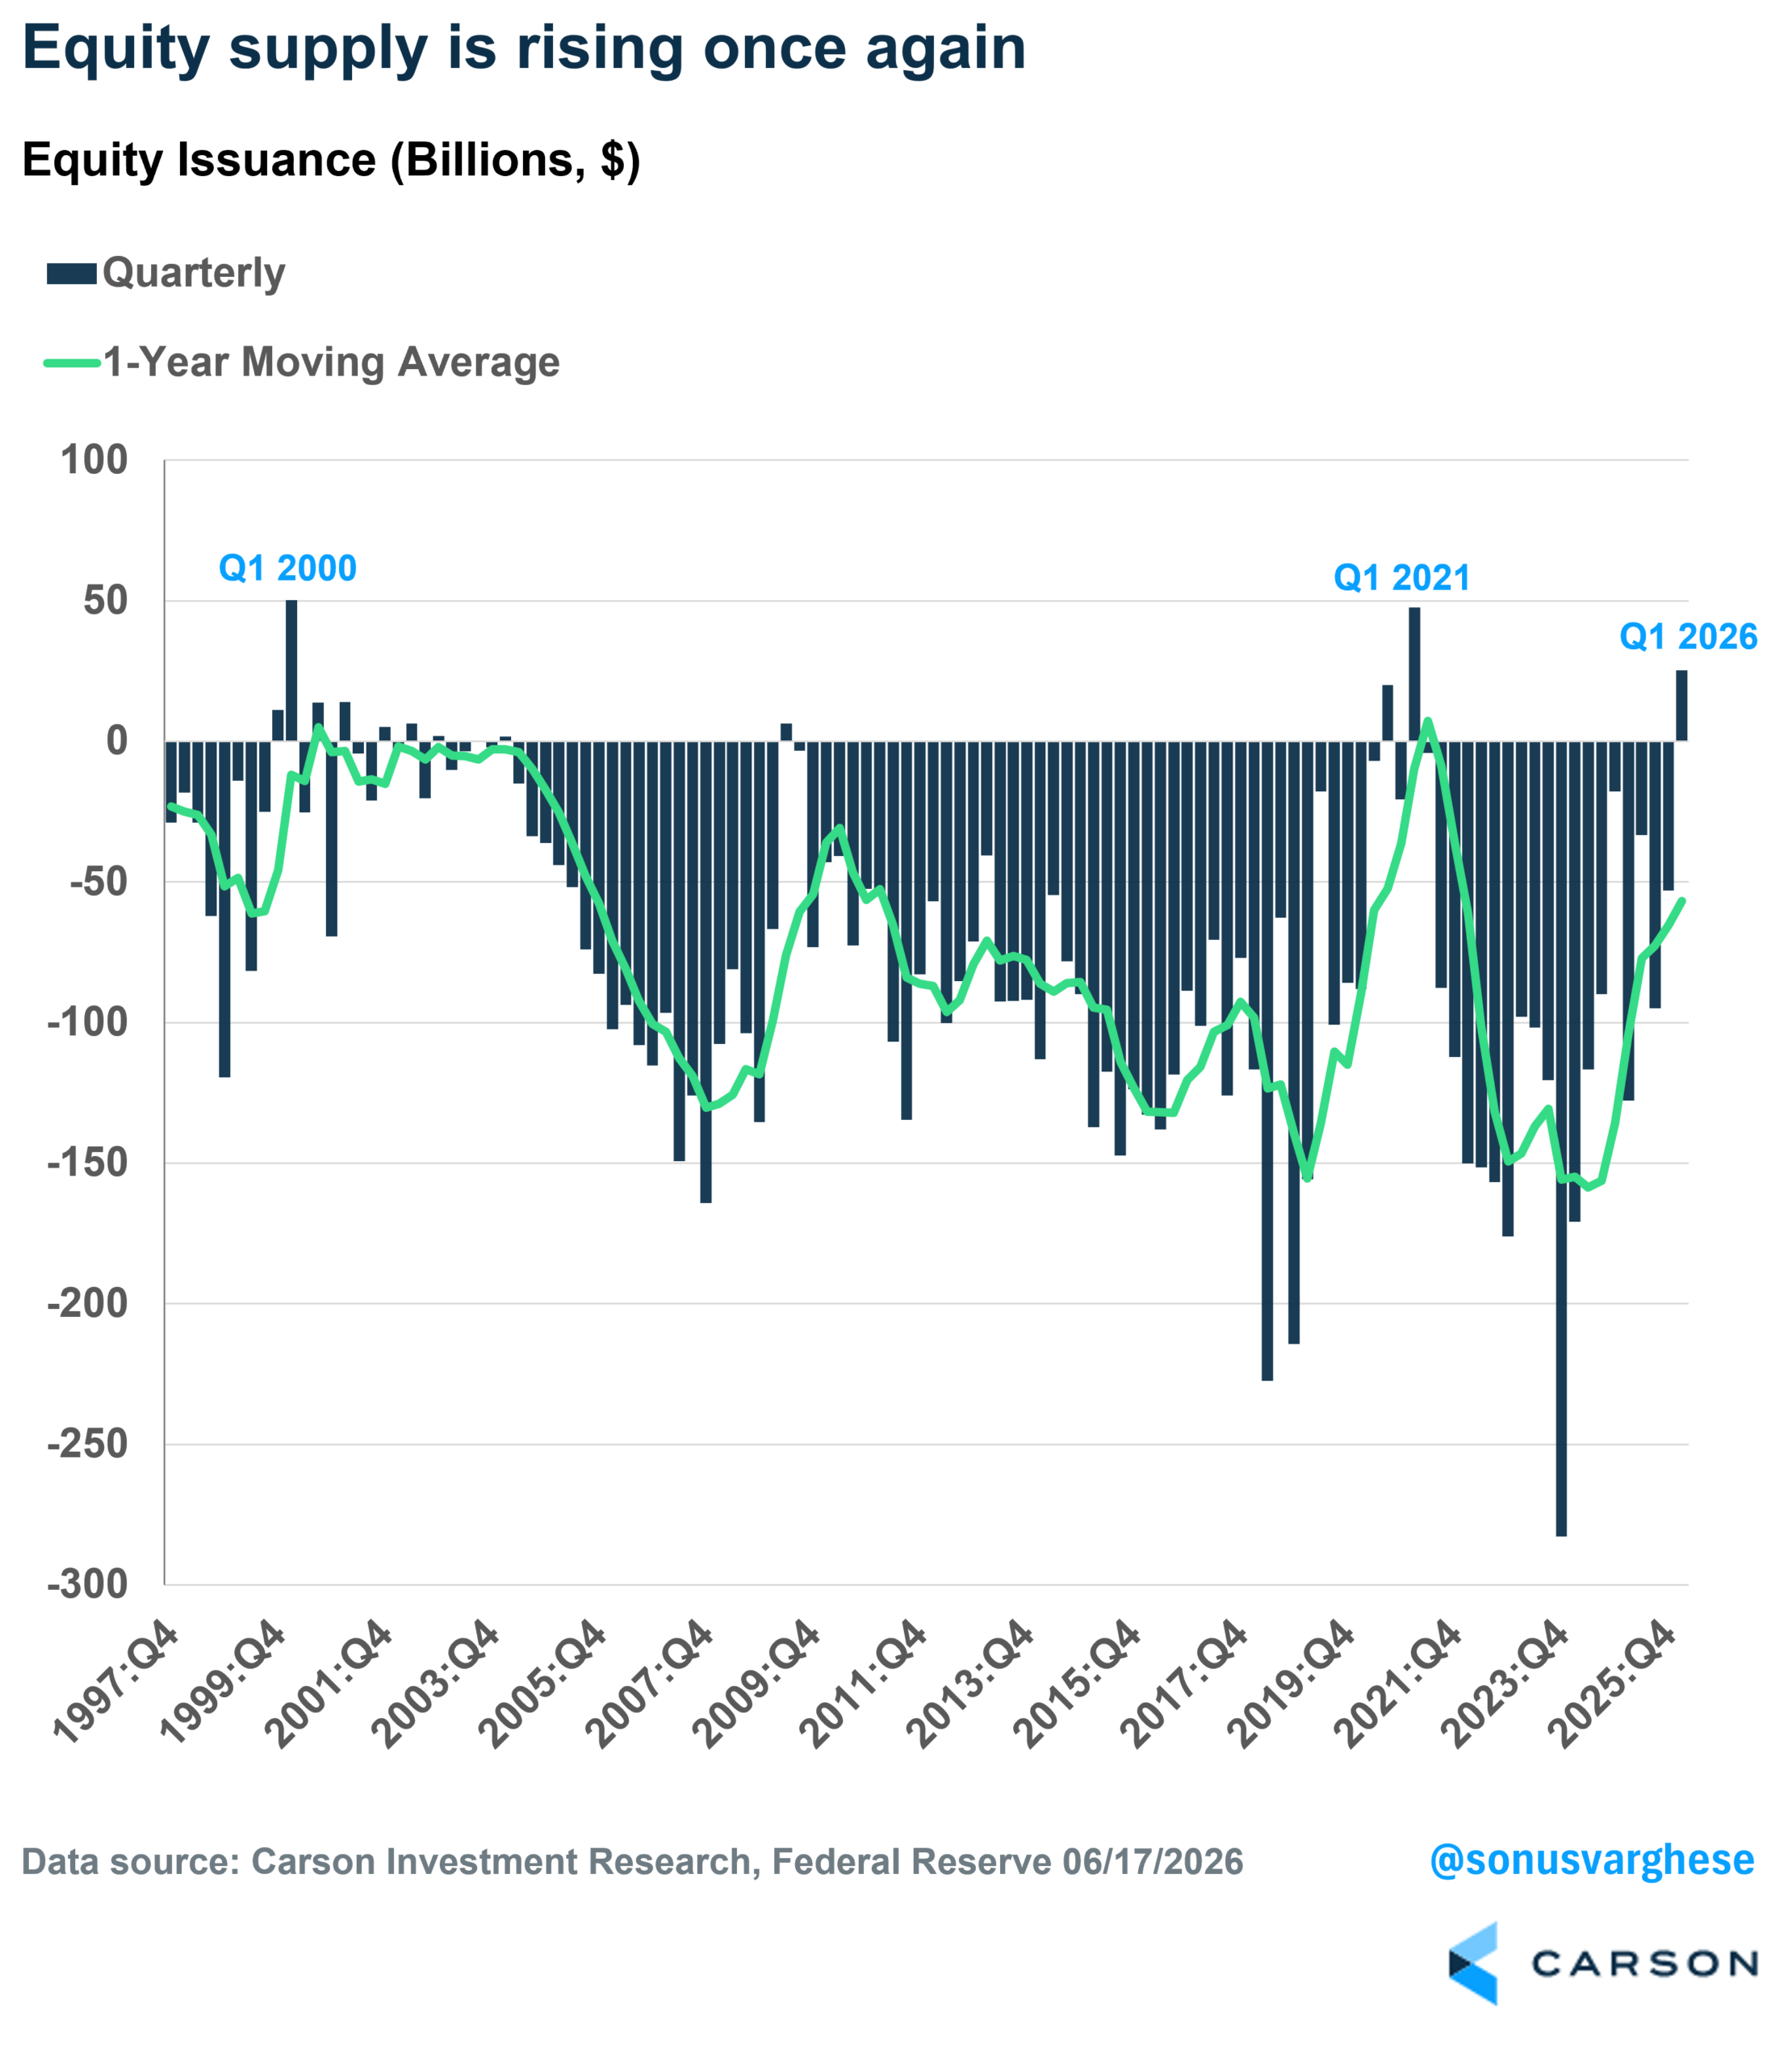
Equity Supply Is Rising
Another thing you see during bubbles is a lot of equity supply. Over the past couple of decades, corporations were mostly reducing the supply of stocks (with stock buybacks). That’s flipped as of Q1 2026, with net issuance turning positive – and that’s likely to continue into Q2 and the rest of the year (especially with huge IPOs like SpaceX, Anthropic , and OpenAI). This is the first time since Q1 2021 that net issuance has turned positive, and we saw a similar net supply increase back in Q1 2000.
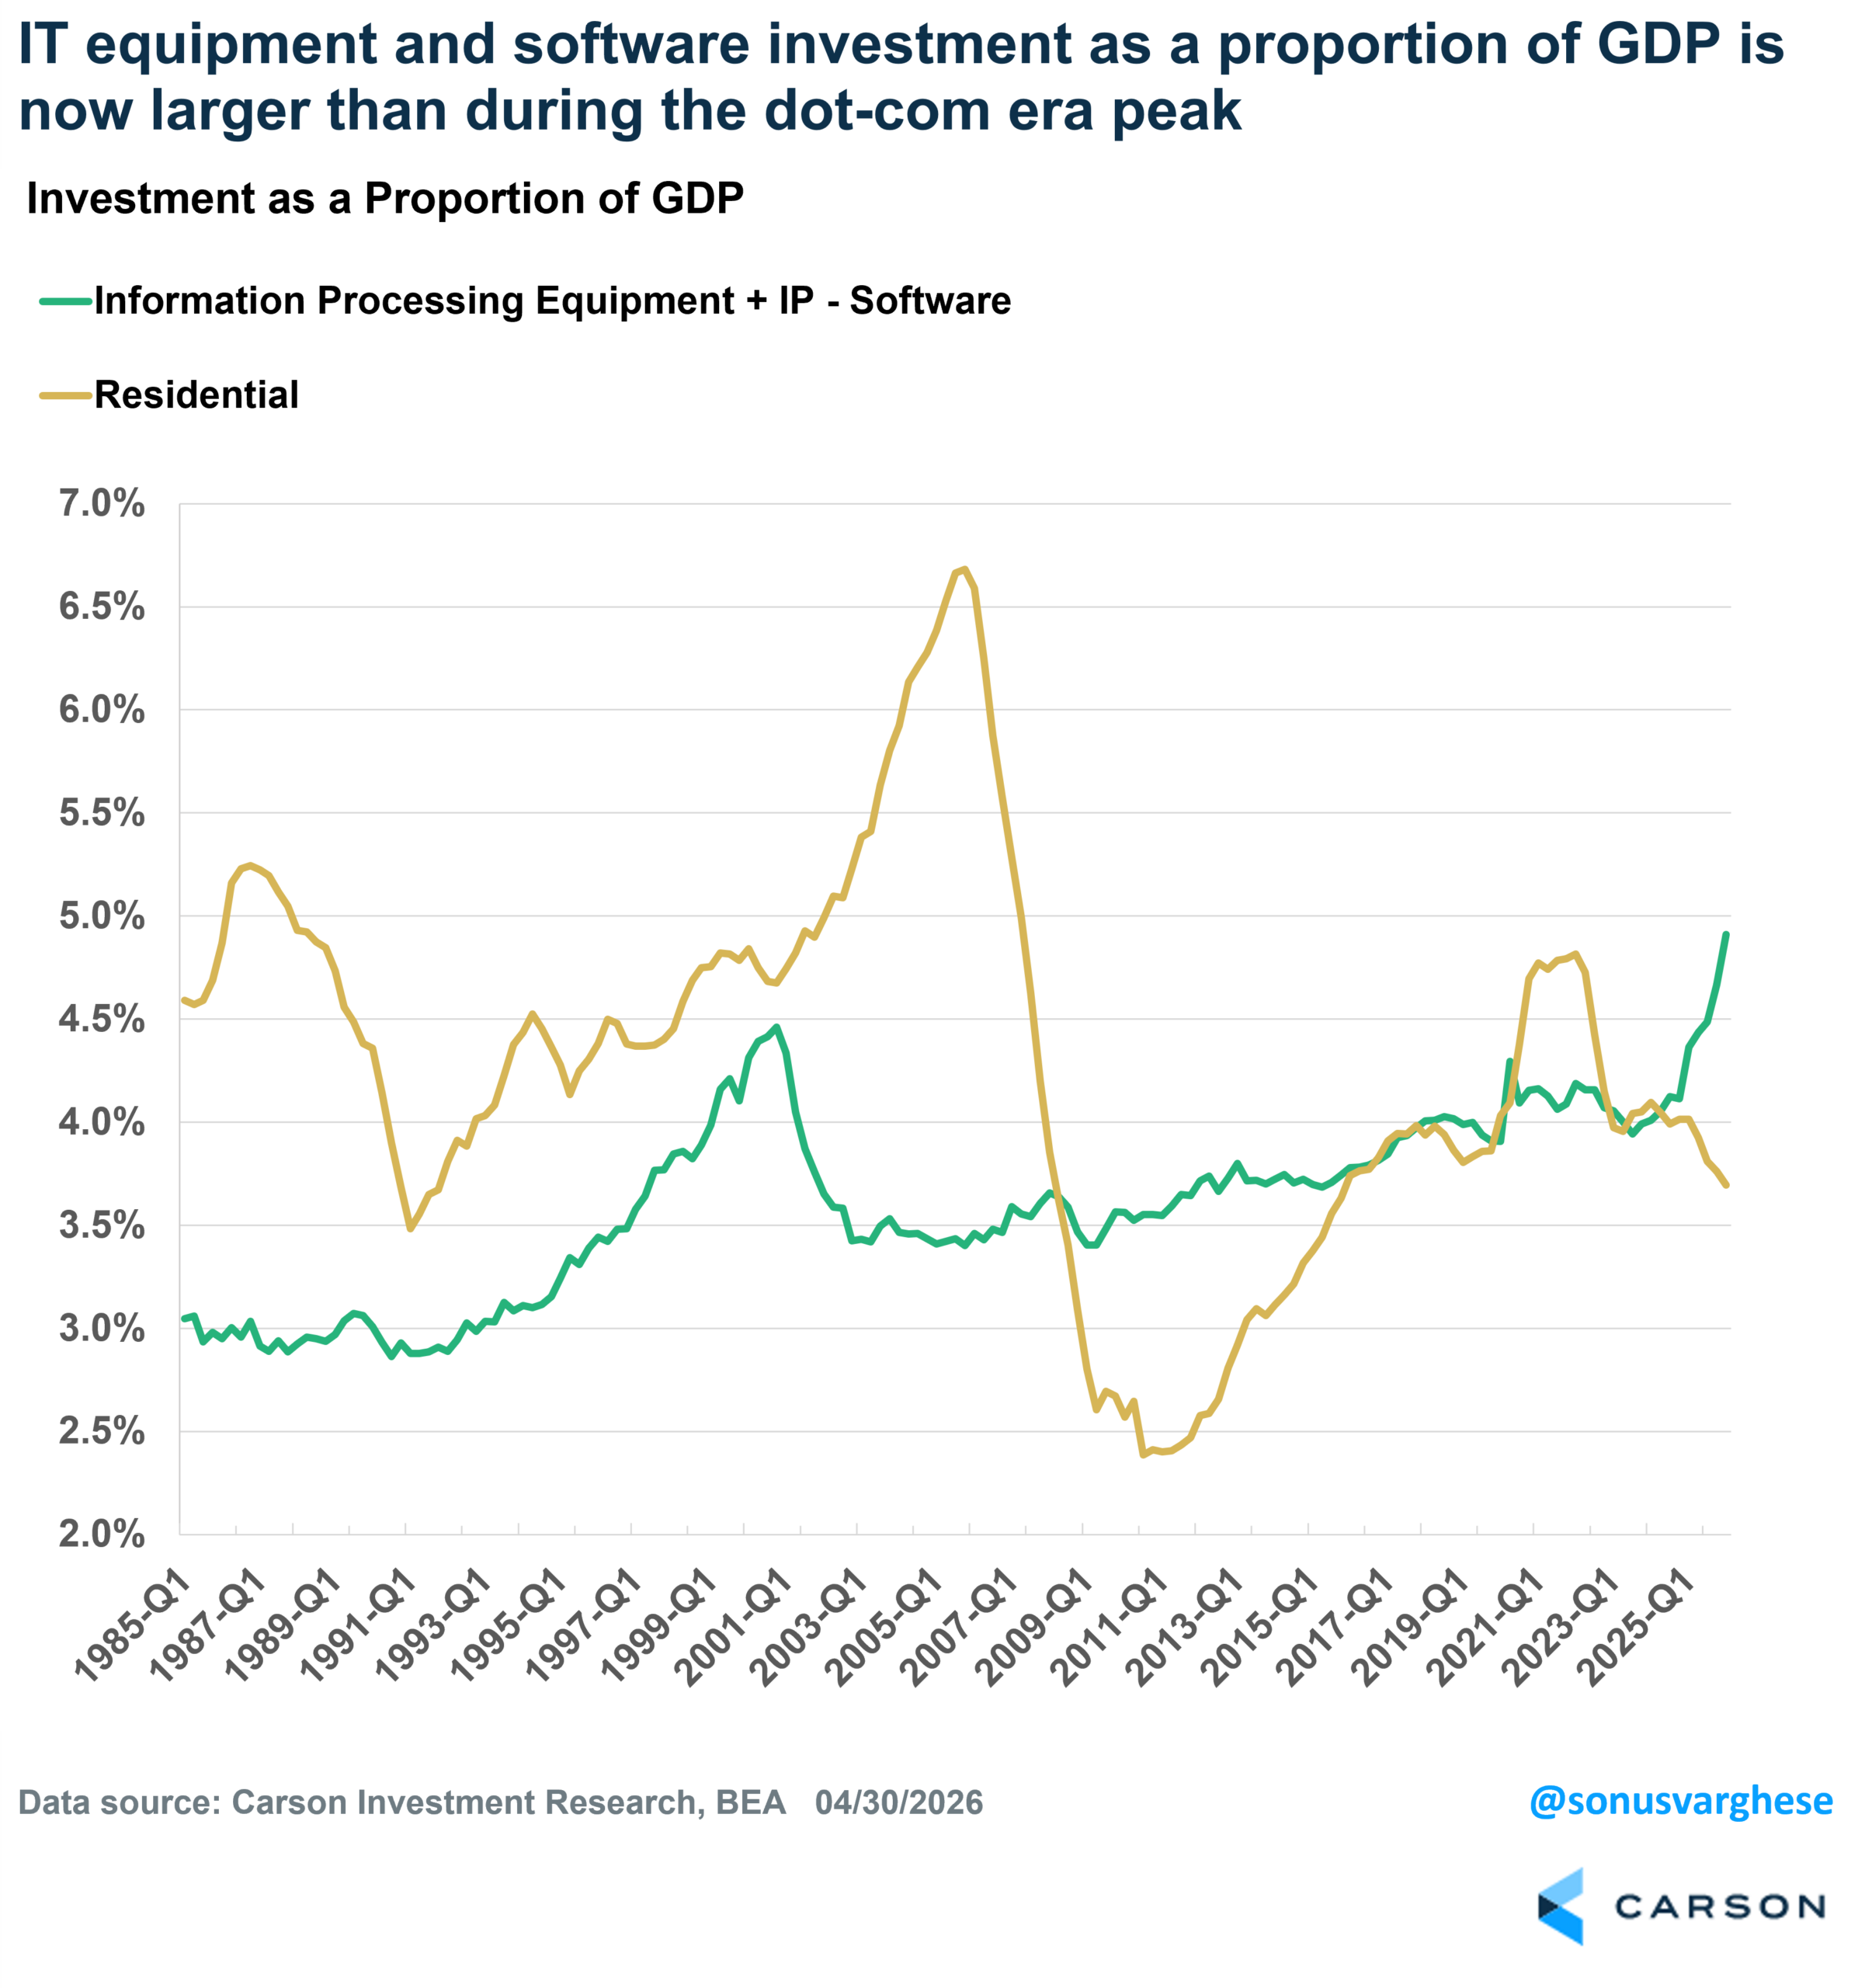
The Real Economy Is Also Feeling the AI Impact
If you look at the economy more broadly, AI is increasingly becoming a large part of it, including hardware and software. Investment in information processing equipment and software now makes up 4.9% of GDP, the highest proportion ever (it maxed at 4.5% in 2000). That’s higher than residential investment right now (housing), though housing-related investment peaked at 6.7% of GDP in 2005 Q4. The profit growth story of AI is essentially an investment story—one company’s investment spending is another company’s revenue and profits. So any reversal of this investment spending will be a sign that optimism has peaked, and that profit growth is also easing. Note that residential investment started pulling back in 2006, well before the bust. (The S&P 500 peaked in October of 2027.)
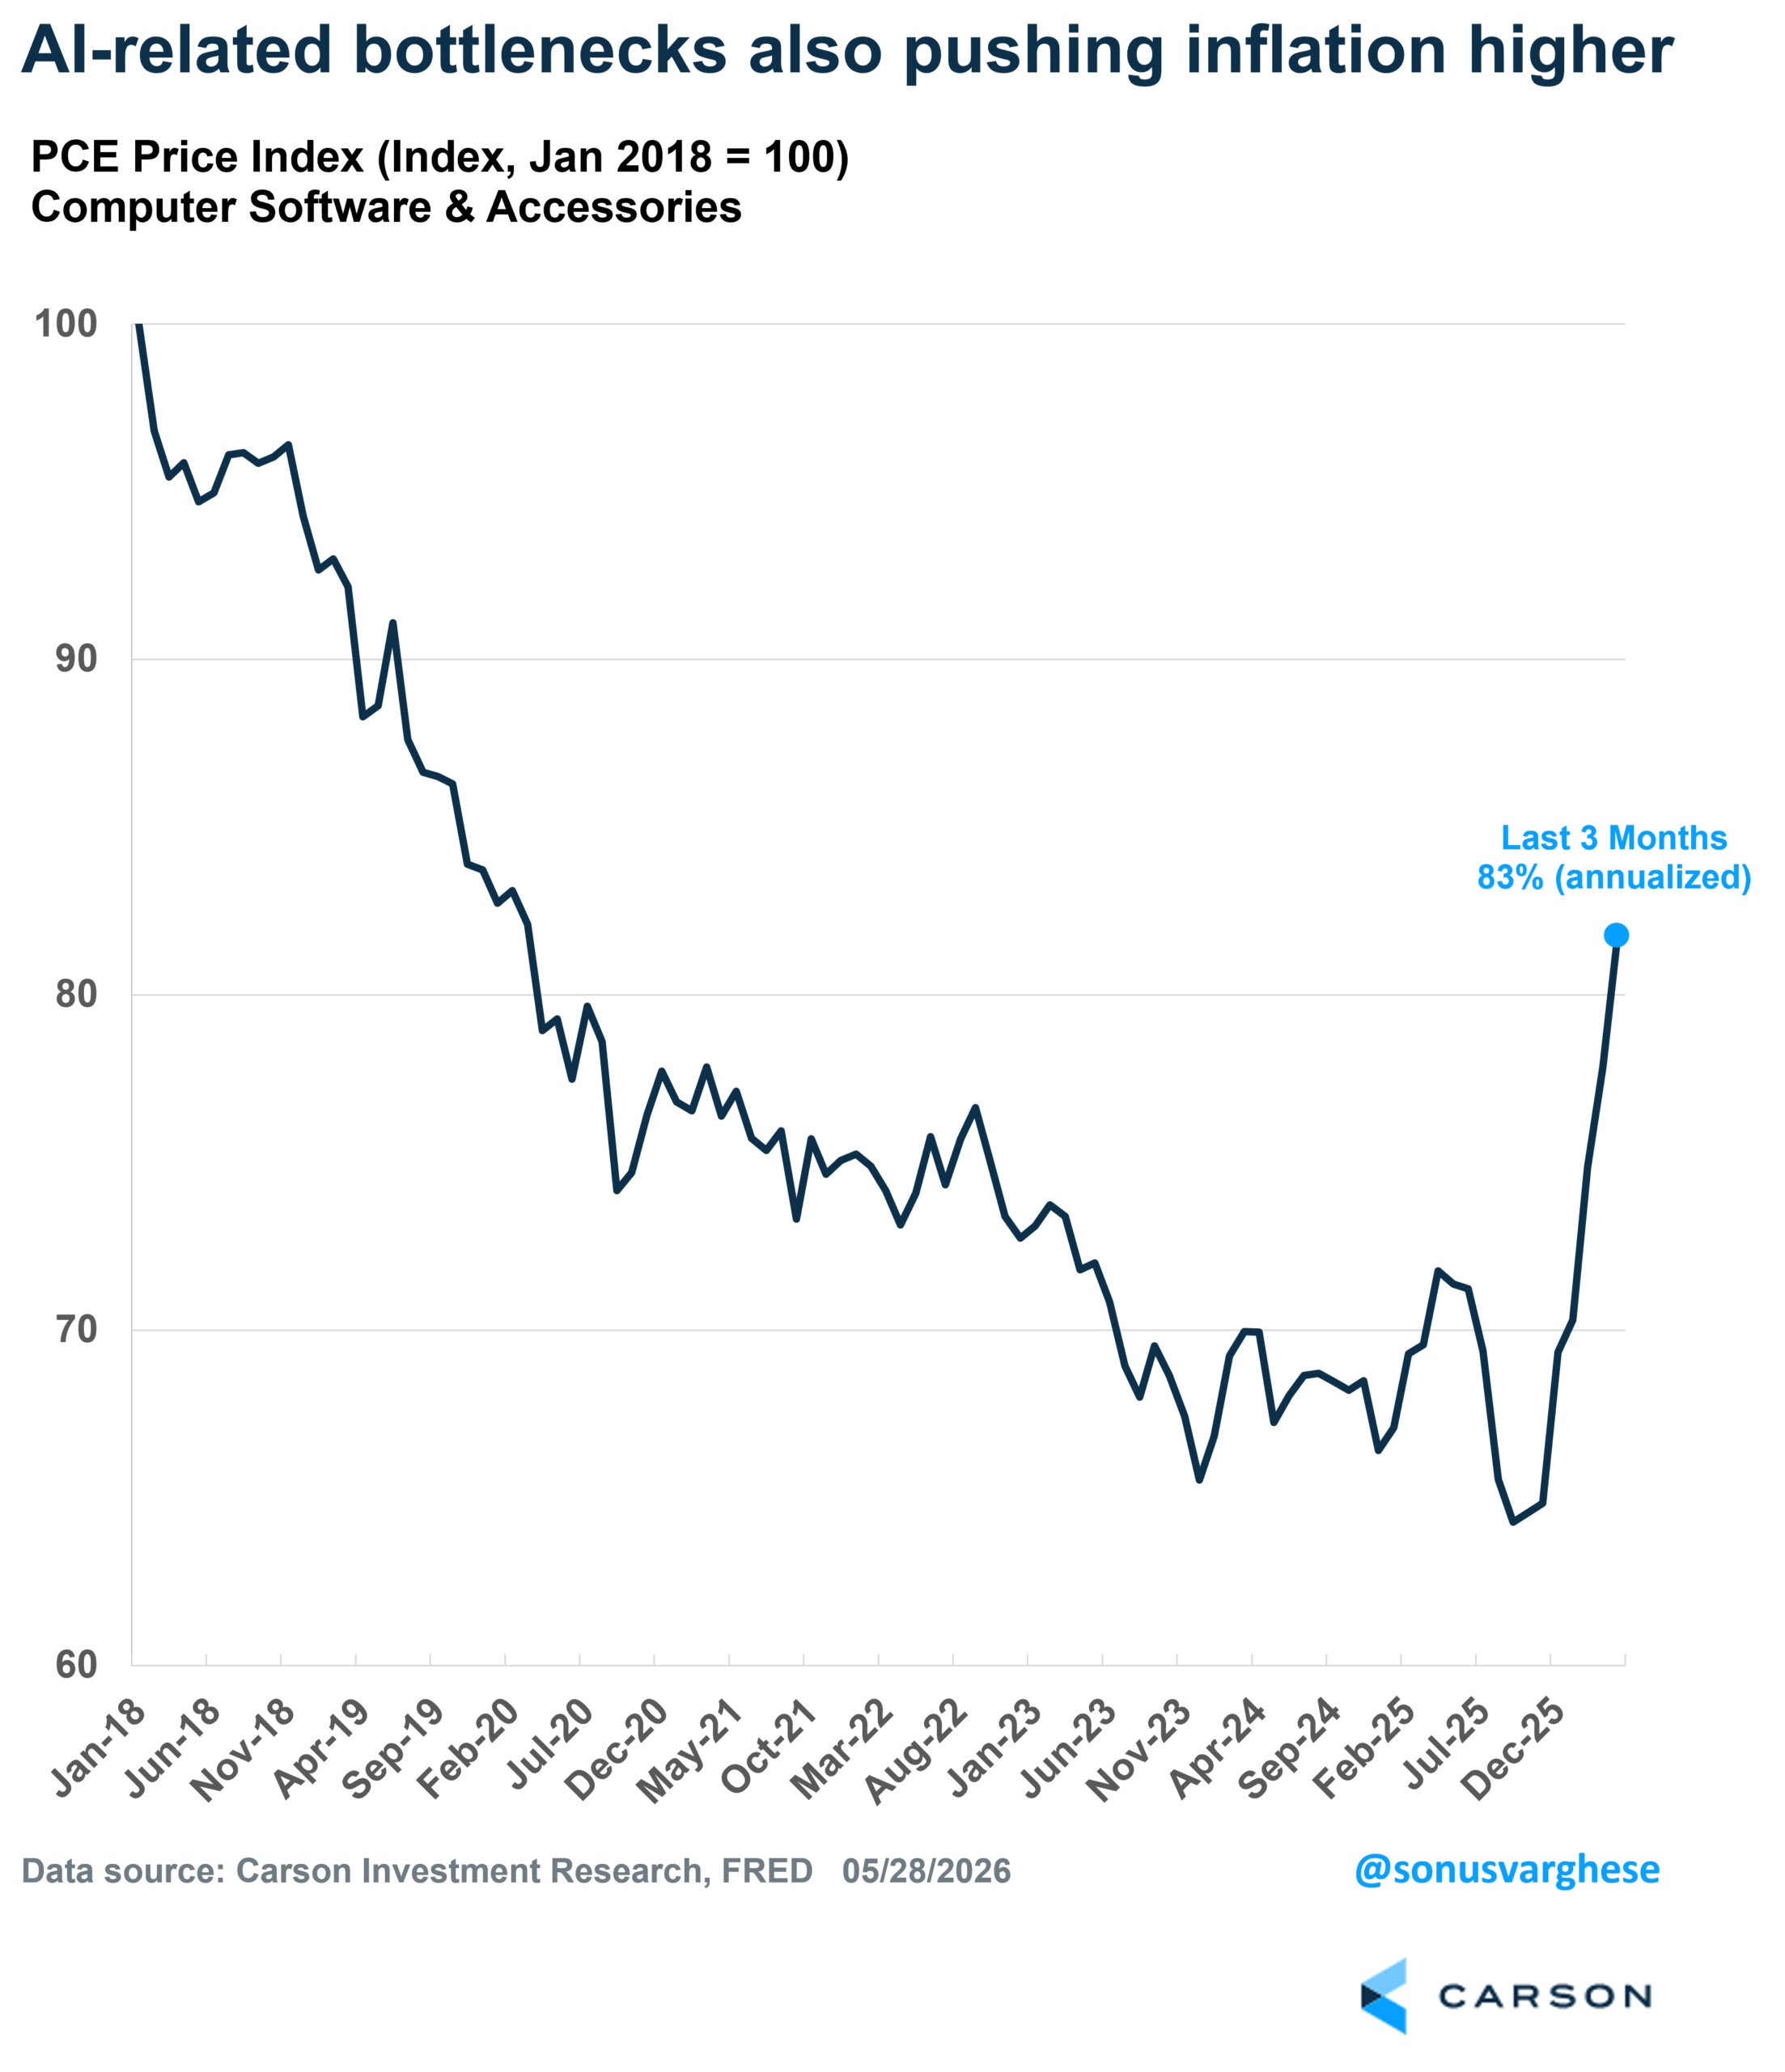
Inflation, in particular inflation for AI-related items, tells a similar story.
- The PCE inflation index for computers and software is up 83% annualized over the last three months (through April) and 14% year over year.
- PPI (Producer Price Index) for printed circuit board assembly manufacturing is up 224% annualized over the last three months (through May) and 155% year over year.
- PPI for semiconductor and other electronic component manufacturing is up 42% annualized over the last three months (through May) and 25% year over year.
These are flaming hot inflation numbers, but one person’s inflation is another company’s profits (and margin expansion). There’s a reason why chip company profits are growing as fast as they are, and it also tells you that demand is outstripping supply right now. A reversal of these enormous price increases, or even a slowdown, will tell us that supply is catching up and overtaking demand even before consumers (and companies making the purchases) are no longer willing to pay up. And that’ll be a sign that we’re on the other side.
The massive increase in prices for technology-related items is also a sharp contrast to what we saw in the late 1990s. Back then, prices were dropping sharply across the board, whether it was hardware (including telecom equipment) or software.
How I Learned To Stop Worrying: The Secret to Investing in AI May Be To Diversify
We wrote about riding the AI wave in our 2026 Outlook, focusing on overweighting equities and taking advantage of momentum. But we also discussed avoiding a wipeout with appropriate diversification. That’s obviously easier said than done right now, as AI is flowing to almost every corner of the market.
Even “Value” is Tied To AI
You would think AI is a “growth” story, but if you look at more popular baskets of “value” stocks, whether the traditional style box definition of value or a factor-based approach, they aren’t really lagging the S&P 500 by a significant amount, and in some cases, they’re doing much better. Hear are some year-to-date total returns as of June 23, 2026:
- S&P 500 Value ETF (SPYV): +7.5%
- iShares Russell 1000 Value ETF (IWD): +15.4%
- iShares MSCI USA Value Factor (VLUE): +45.3%
- S&P 500: +8.2%
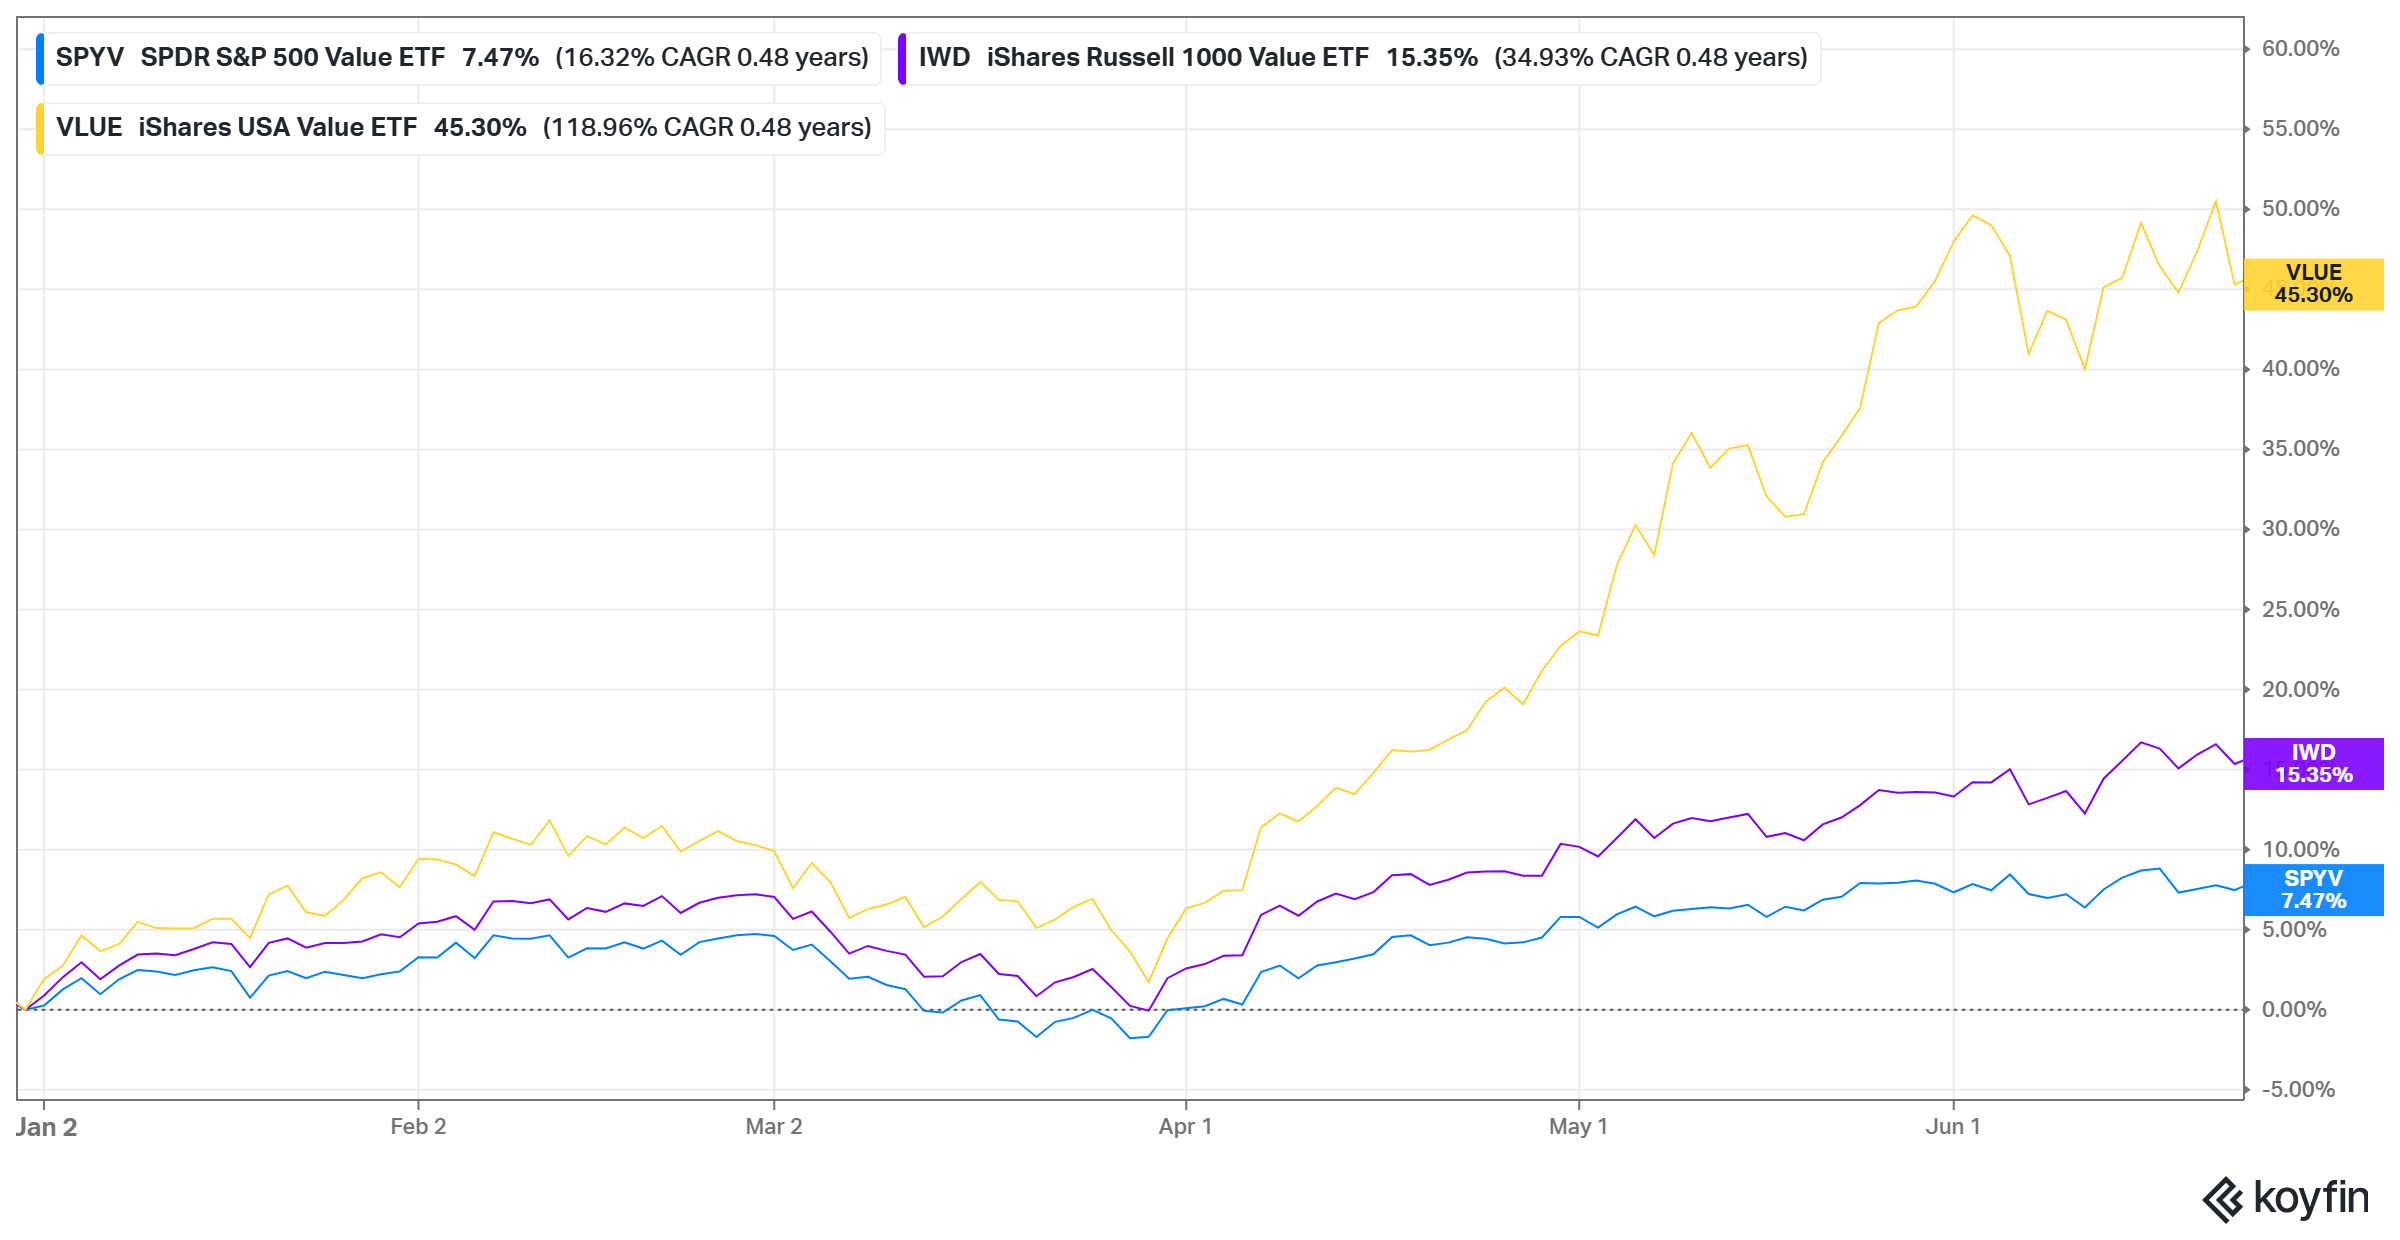
Well, a big reason for this is that these baskets also have significant exposure to AI-related stocks.
- The largest sector within the S&P 500 Value ETF (SPYV) is technology (21%), with Apple making up over 7% of the basket (+8.5% YTD) and Intel making up over 2% (the stock is up 258% YTD).
- Amongst the largest names in the Russell 1000 Value ETF (IWD) are Alphabet at a 4% weight (+10% YTD), Micron at a 3.7% weight (+269% YTD), Intel at a 1.7% weight (+258% YTD), and Cisco at a 1.4% weight (+59% YTD).
- Meanwhile, the factor-based value ETF (VLUE) has a 25% weight in Micron and another 4.6% in Intel.
Maybe value is still “value,” but to be clear it’s also become an AI play. Or rather, your traditional “growth” baskets are not the only place to find AI-related exposure, which also means the traditional “value” baskets are not quite as diversifying to AI-related stocks as one may think.
Prepare for Rotation, but Rotation Could Mean the End Is Here
Another way to think about diversifying away from AI is to look at areas of the market that are not correlated with AI. For a couple of years now we’ve discussed barbelling some of our momentum exposure with low volatility. Yes, that’s done worse than just solely betting on momentum, but the more momentum keeps rising, the more comfortable we are with low volatility. If everything in your portfolio is outperforming, that probably means you’re not diversified enough.
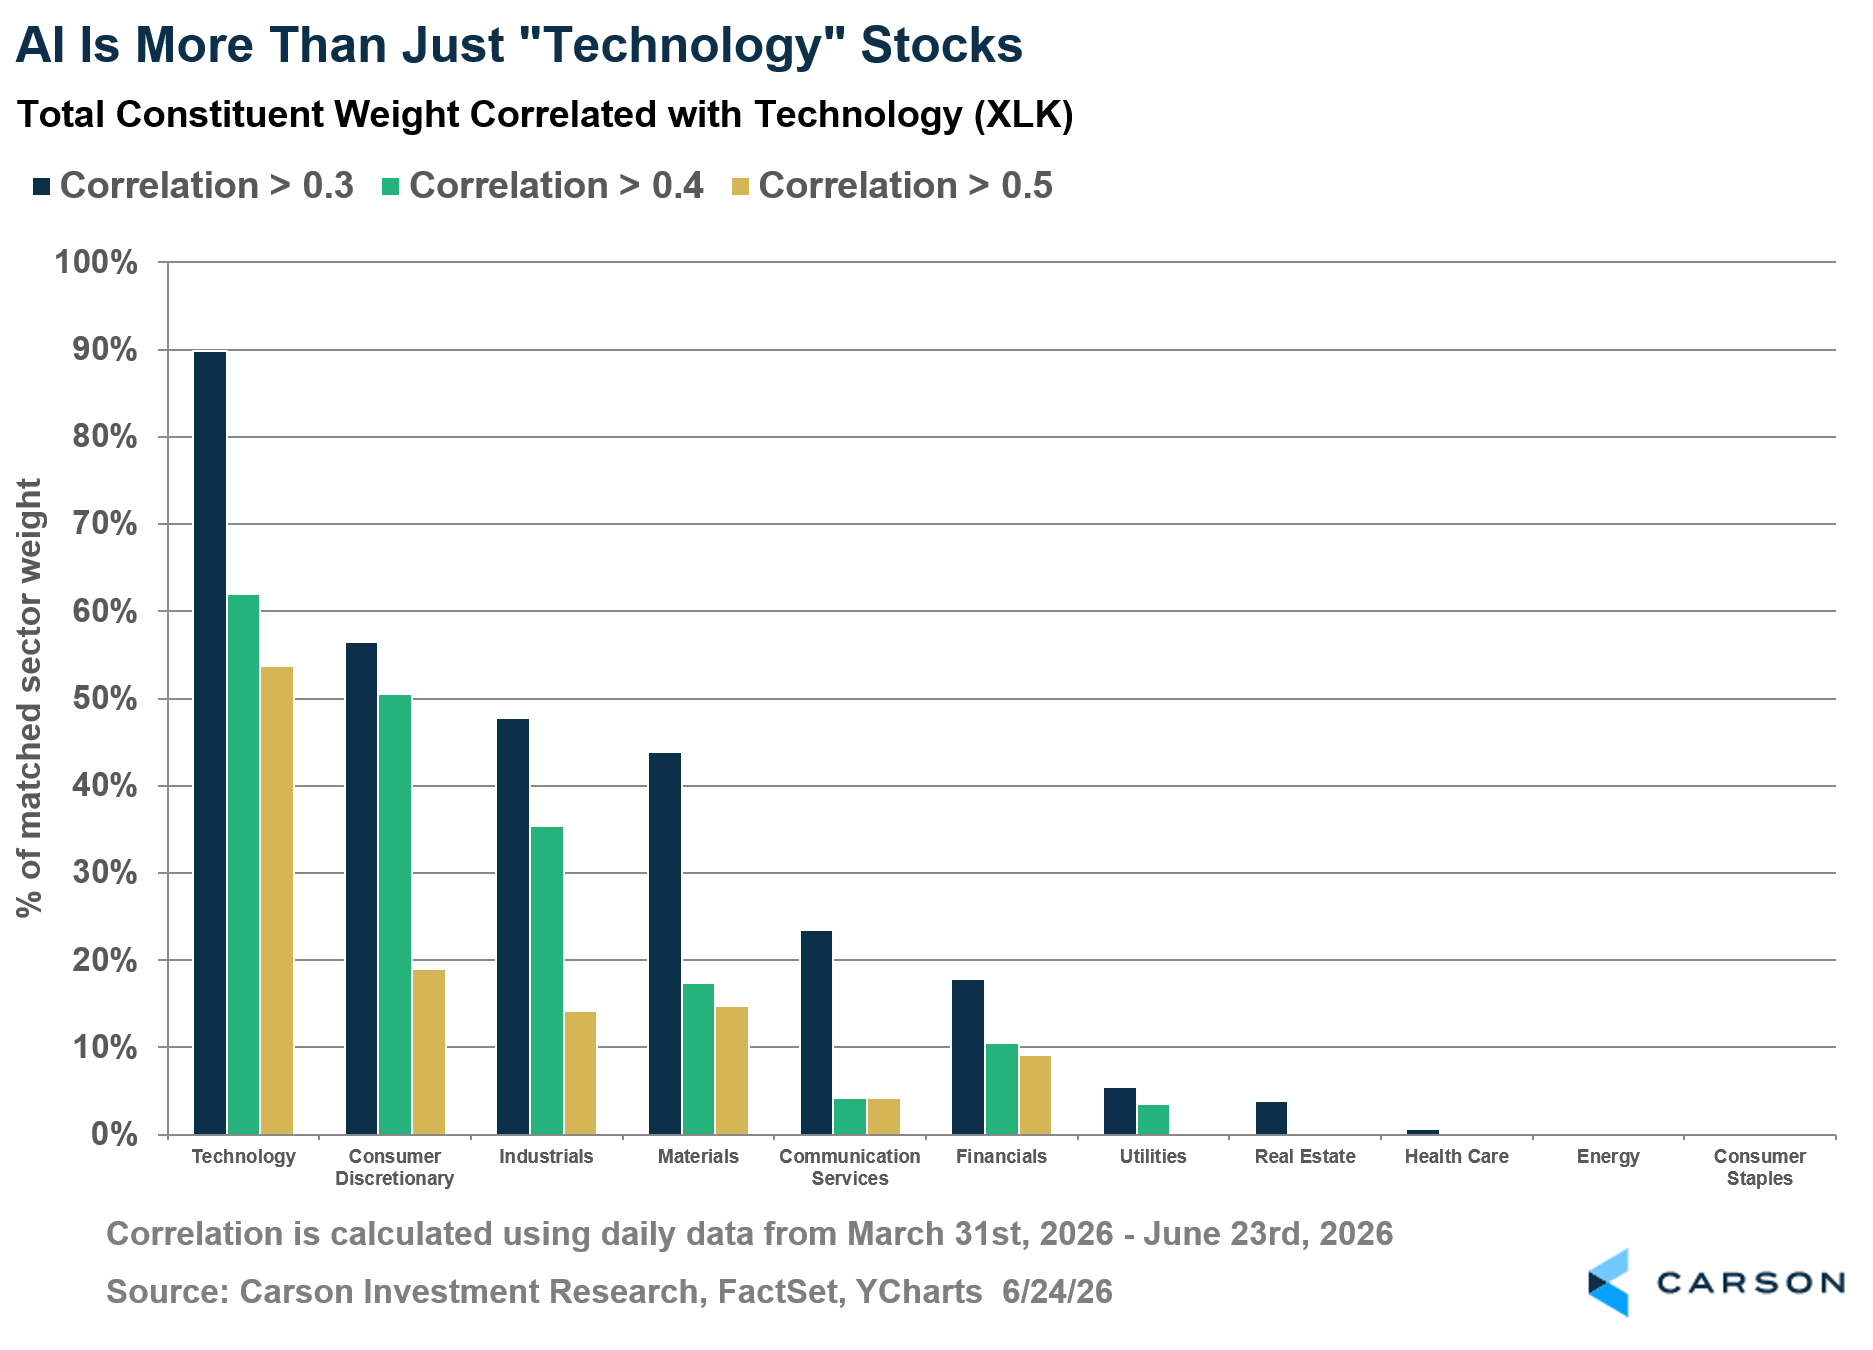
Another approach is to look at sectors, but you have to be careful here as several sectors have closer ties to AI than you would think. We looked at the correlation of constituent names within all 11 sectors with the technology sector since March 31 (when technology stocks surged) and added up the total weight of individual names within each sector that had a significant correlation to tech (over 0.3).
Beyond the obvious suspects like consumer discretionary and communication services, sectors like industrials and materials also have a significant proportion of companies that have a relatively high correlation with technology. For example: for industrials, over 40% of the sector has a 0.3 correlation with technology and over 30% have a 0.4 correlation. On the other hand, sectors like healthcare and consumer staples have barely any weight with a significant correlation with technology.
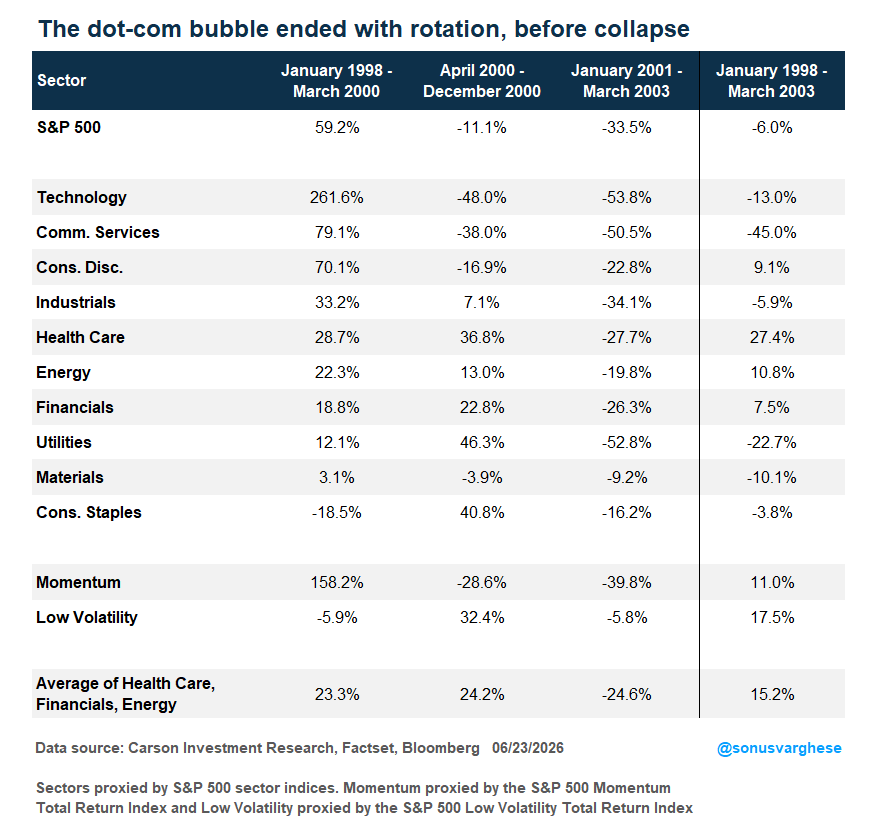
At the same time, if we do see sustained rotation from AI-related companies (and sectors) to other parts of the market, say for over 6-12 months, that probably means the AI trade is over. The bubble has likely been pricked. This is essentially what happened in 2000, after the dot-com bubble bust.
I looked at returns from the end of 1997 through March 2003 (the bottom) for all the sectors, as well as the momentum and low volatility factors (long only). I separated this into three periods:
- January 1998 – March 2003 (the bubble)
- April 2003 – December 2000 (rotation)
- January 2001 – March 2003 (the crash)
Some highlights:
- No surprise, technology and momentum saw huge returns during the bubble and then collapsed after that. Tech-adjacent sectors like communication services (which includes telecom) and consumer discretionary also gained a lot.
- Sectors outside of the top 3 tech-adjacent sectors had reasonably solid returns during the “bubble,” so there was breadth. Staples was the only sector with a negative return. The low volatility factor was also negative.
- April 2000 through December 2000 saw a lot of rotation, with the 3 tech-adjacent sectors and momentum collapsing, while most other sectors and low volatility gained.
- The crash (January 2001 – March 2003) saw every sector hit quite hard, with tech and momentum taking the hardest blow.
- Over the full period, what’s interesting is that health care, energy, financials, and even consumer discretionary had positive returns. Momentum was also positive despite steep drawdowns, though low volatility outperformed over the 5+ years as did a simple average of health care, financials, and energy sectors.
As I noted at the top, I have no idea what stage of the bubble we are in, nor when it will pop. But instead of worrying about it, I feel increasingly comfortable judiciously diversifying outside of AI, despite the opportunity cost of missing out on large gains by going all in. In a way, it’s an admission that we can’t perfectly (or even near perfectly) time the top, and “get out in time, before everyone else.” Good luck with that. Instead, the more we see momentum run, the more diversified we’ll try to get, which is our way of riding the way, but trying to avoid a wipeout on the other side of it all.
For more content by Sonu Varghese, Chief Macro Strategist, click here.
8992863.1. – 24JUNE26A
