As I wrote earlier this week, Fed Chair Jerome Powell opened the door to a September interest rate cut at the Jackson Hole Symposium. Powell argued that risks to inflation are tilted to the upside and risks to the labor market are tilted to the downside. But since policy rates are already in restrictive territory, the balance of risks means a cut may be warranted.
In my opinion that is a completely fair argument. At the same time, it looks like the Fed has a big inflation problem on its hands. We just got the latest (July) reading on the Personal Consumption Expenditures Price Index (PCE), which is the Fed’s preferred inflation metric.
- Headline PCE rose 0.2% in July. It’s running at a 2.6% annualized pace over the last three months and is up the same amount over the past year.
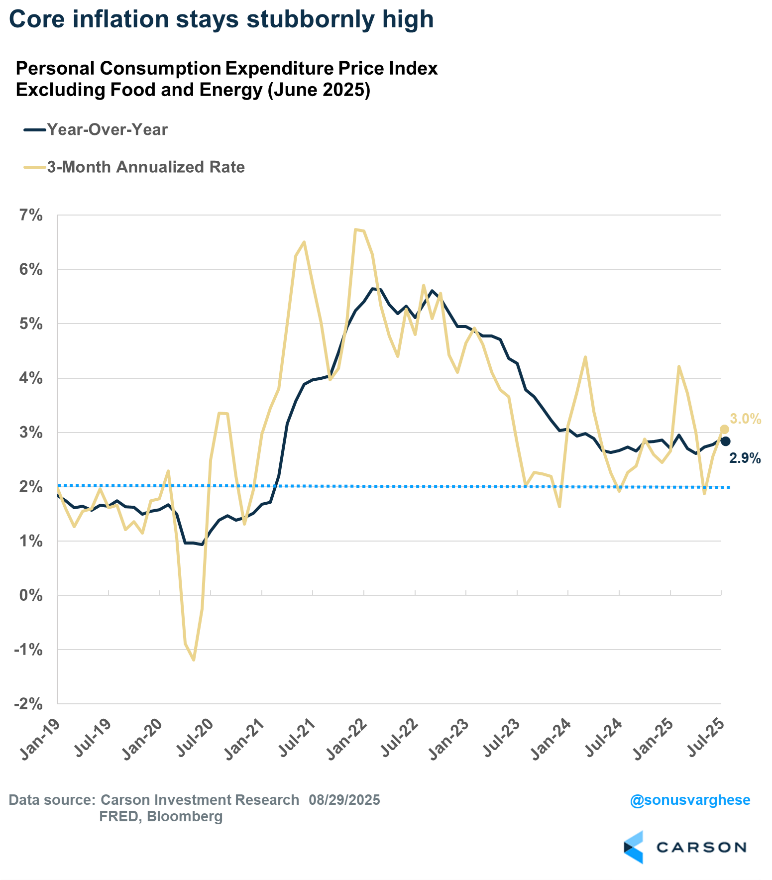
- Core PCE (ex food and energy) rose 0.26% in July—equivalent to 3.3% annualized. It’s running at a 3% annualized pace over the last three months and is up 2.9% over the past year (the fastest pace since April 2024).
In short, core inflation, which is what the Fed looks at, remains stubbornly high. And it looks to be moving in the wrong direction.
Now, a chunk of this is coming from the tariff-related impact on durable core goods like furnishings, appliances, and recreational goods. PCE for durable goods is now up 1.1% since last year and running at a 1.5% annualized pace over the last three months. These numbers don’t look too “hot” but the counter-factual (in the absence of tariffs) is that core goods prices would be falling, exerting a downward force on inflation, rather than pushing it higher.
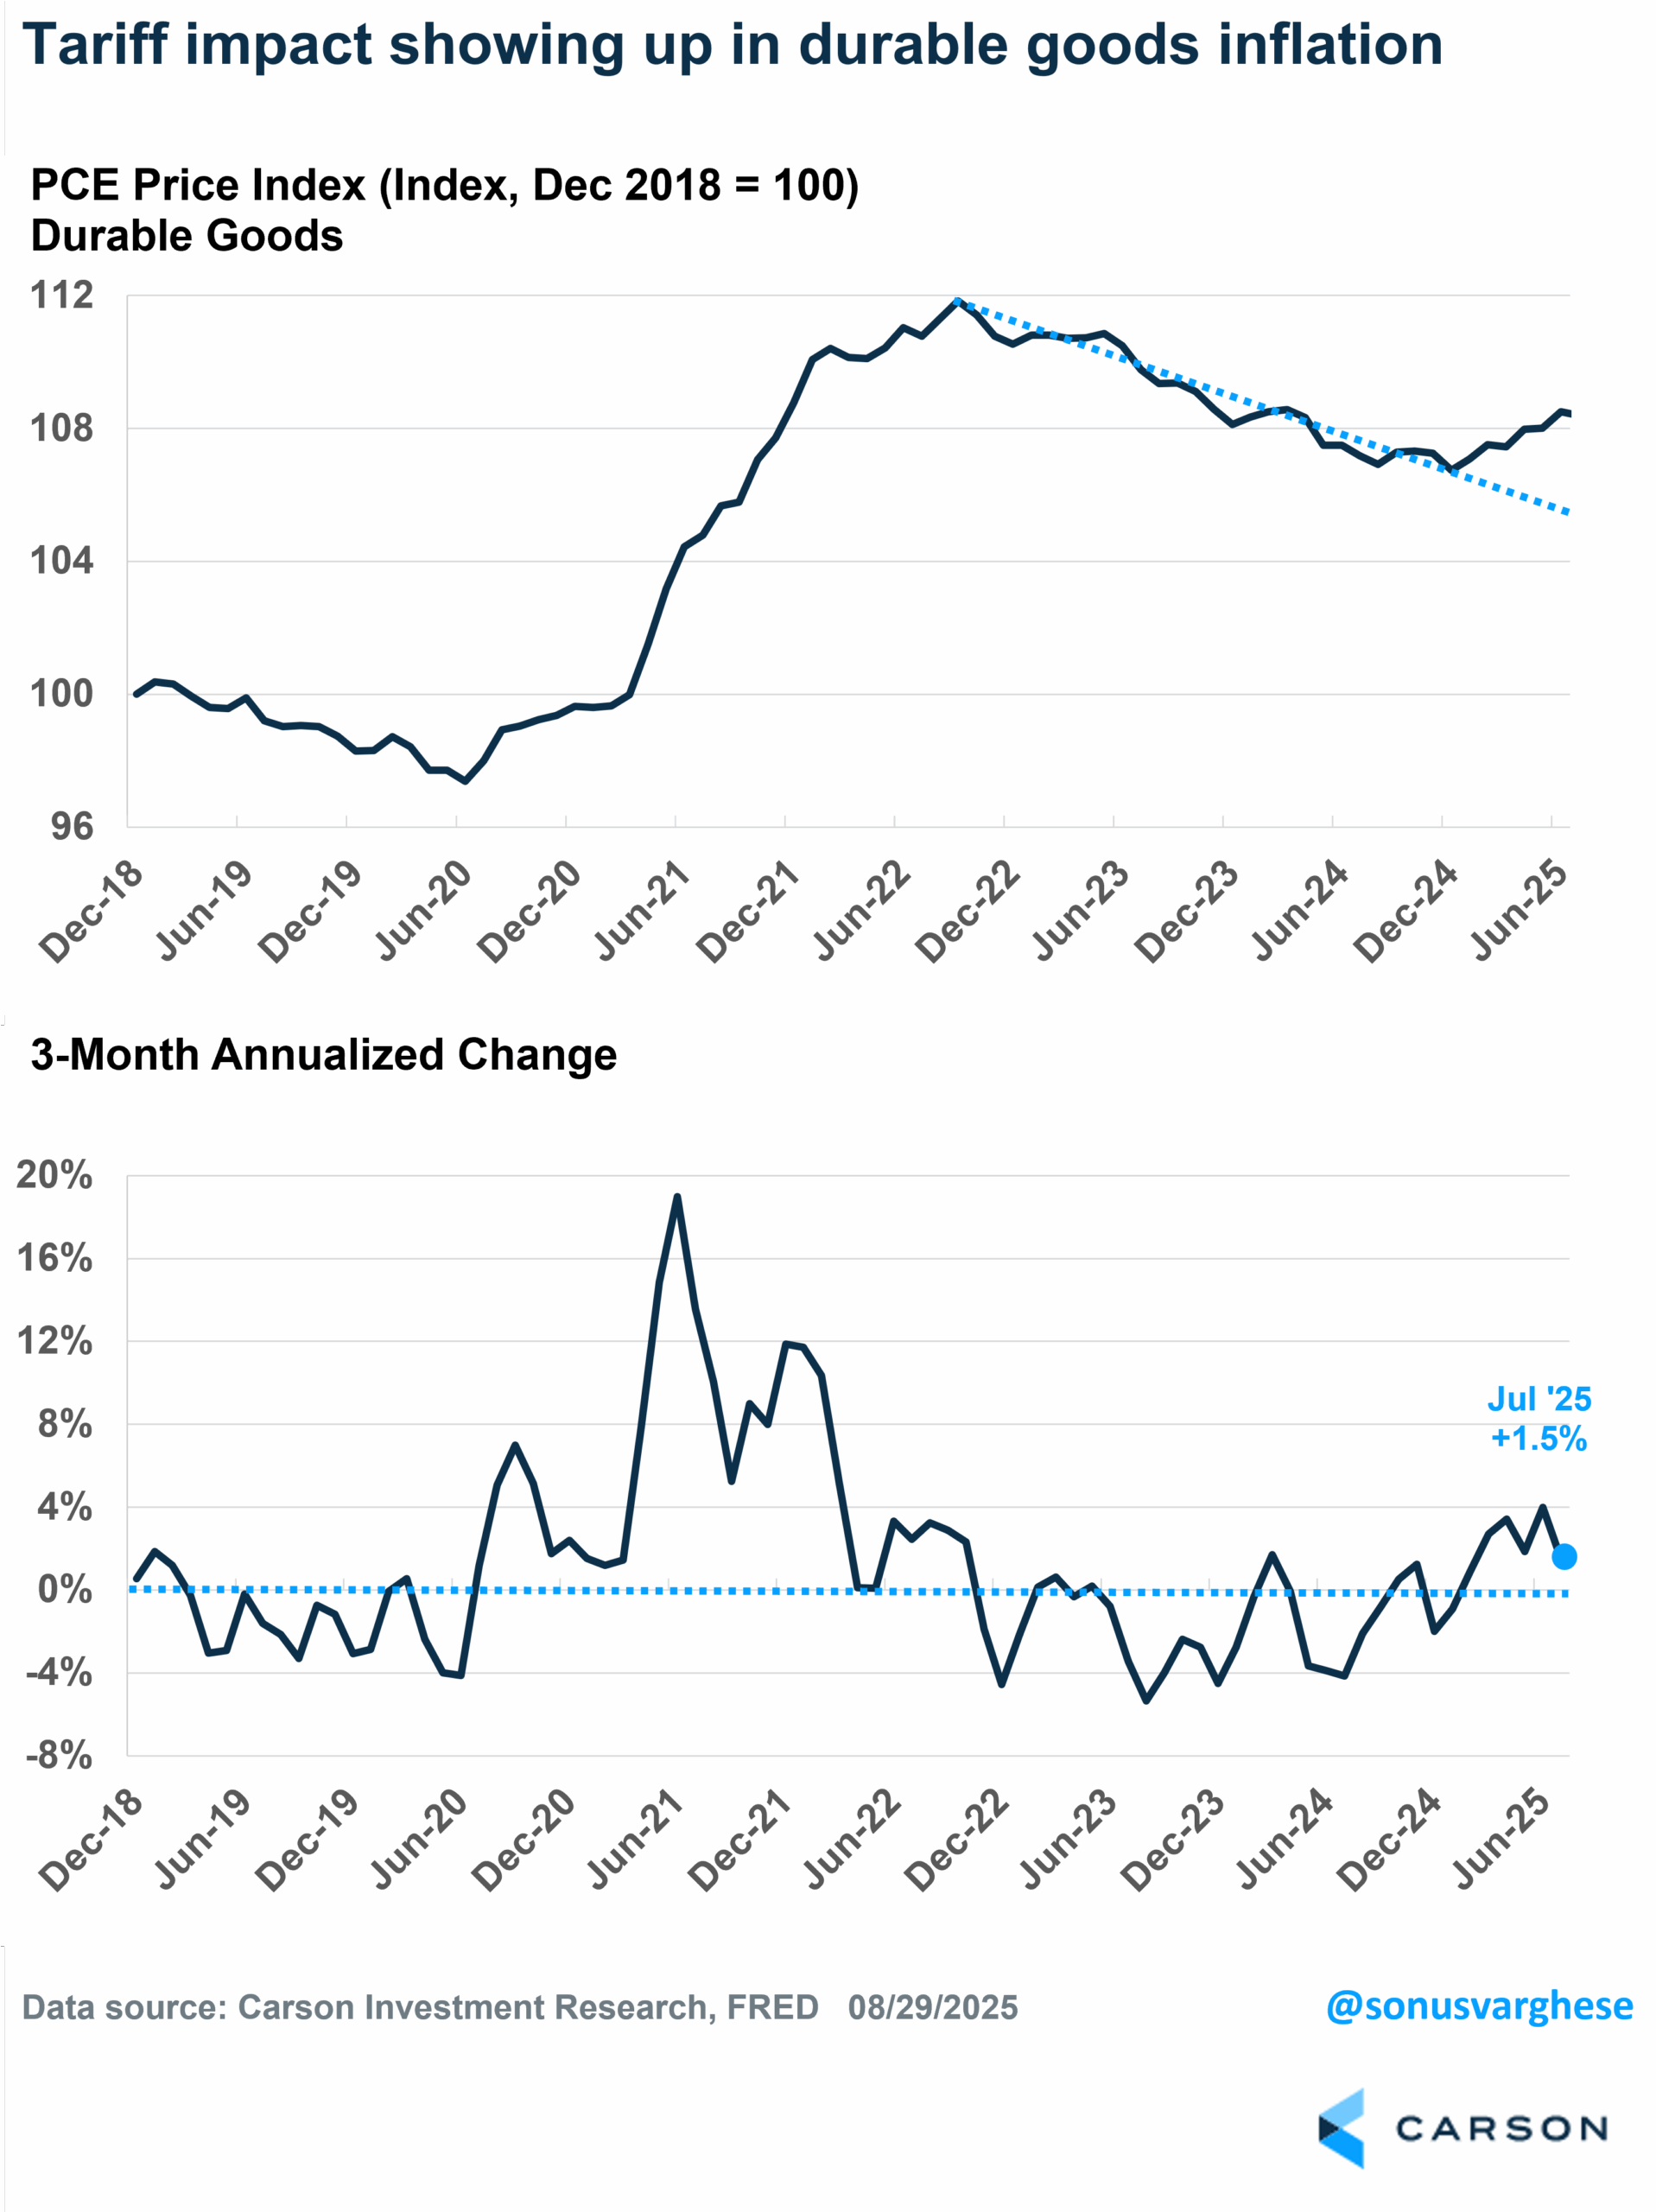
Now you can argue that tariffs impacts are a one-off effect. It may not show up all at once (especially since tariff policy hasn’t settled to its final place yet), but any impact should pass sooner rather than later. In fact, Powell made this case in his Jackson Hole comments, and just this week, Fed governor Chris Waller (who is the current favorite to replace Powell as Chair next year) said he is “back on Team Transitory.” He thinks the recent upward move in inflation is temporary.
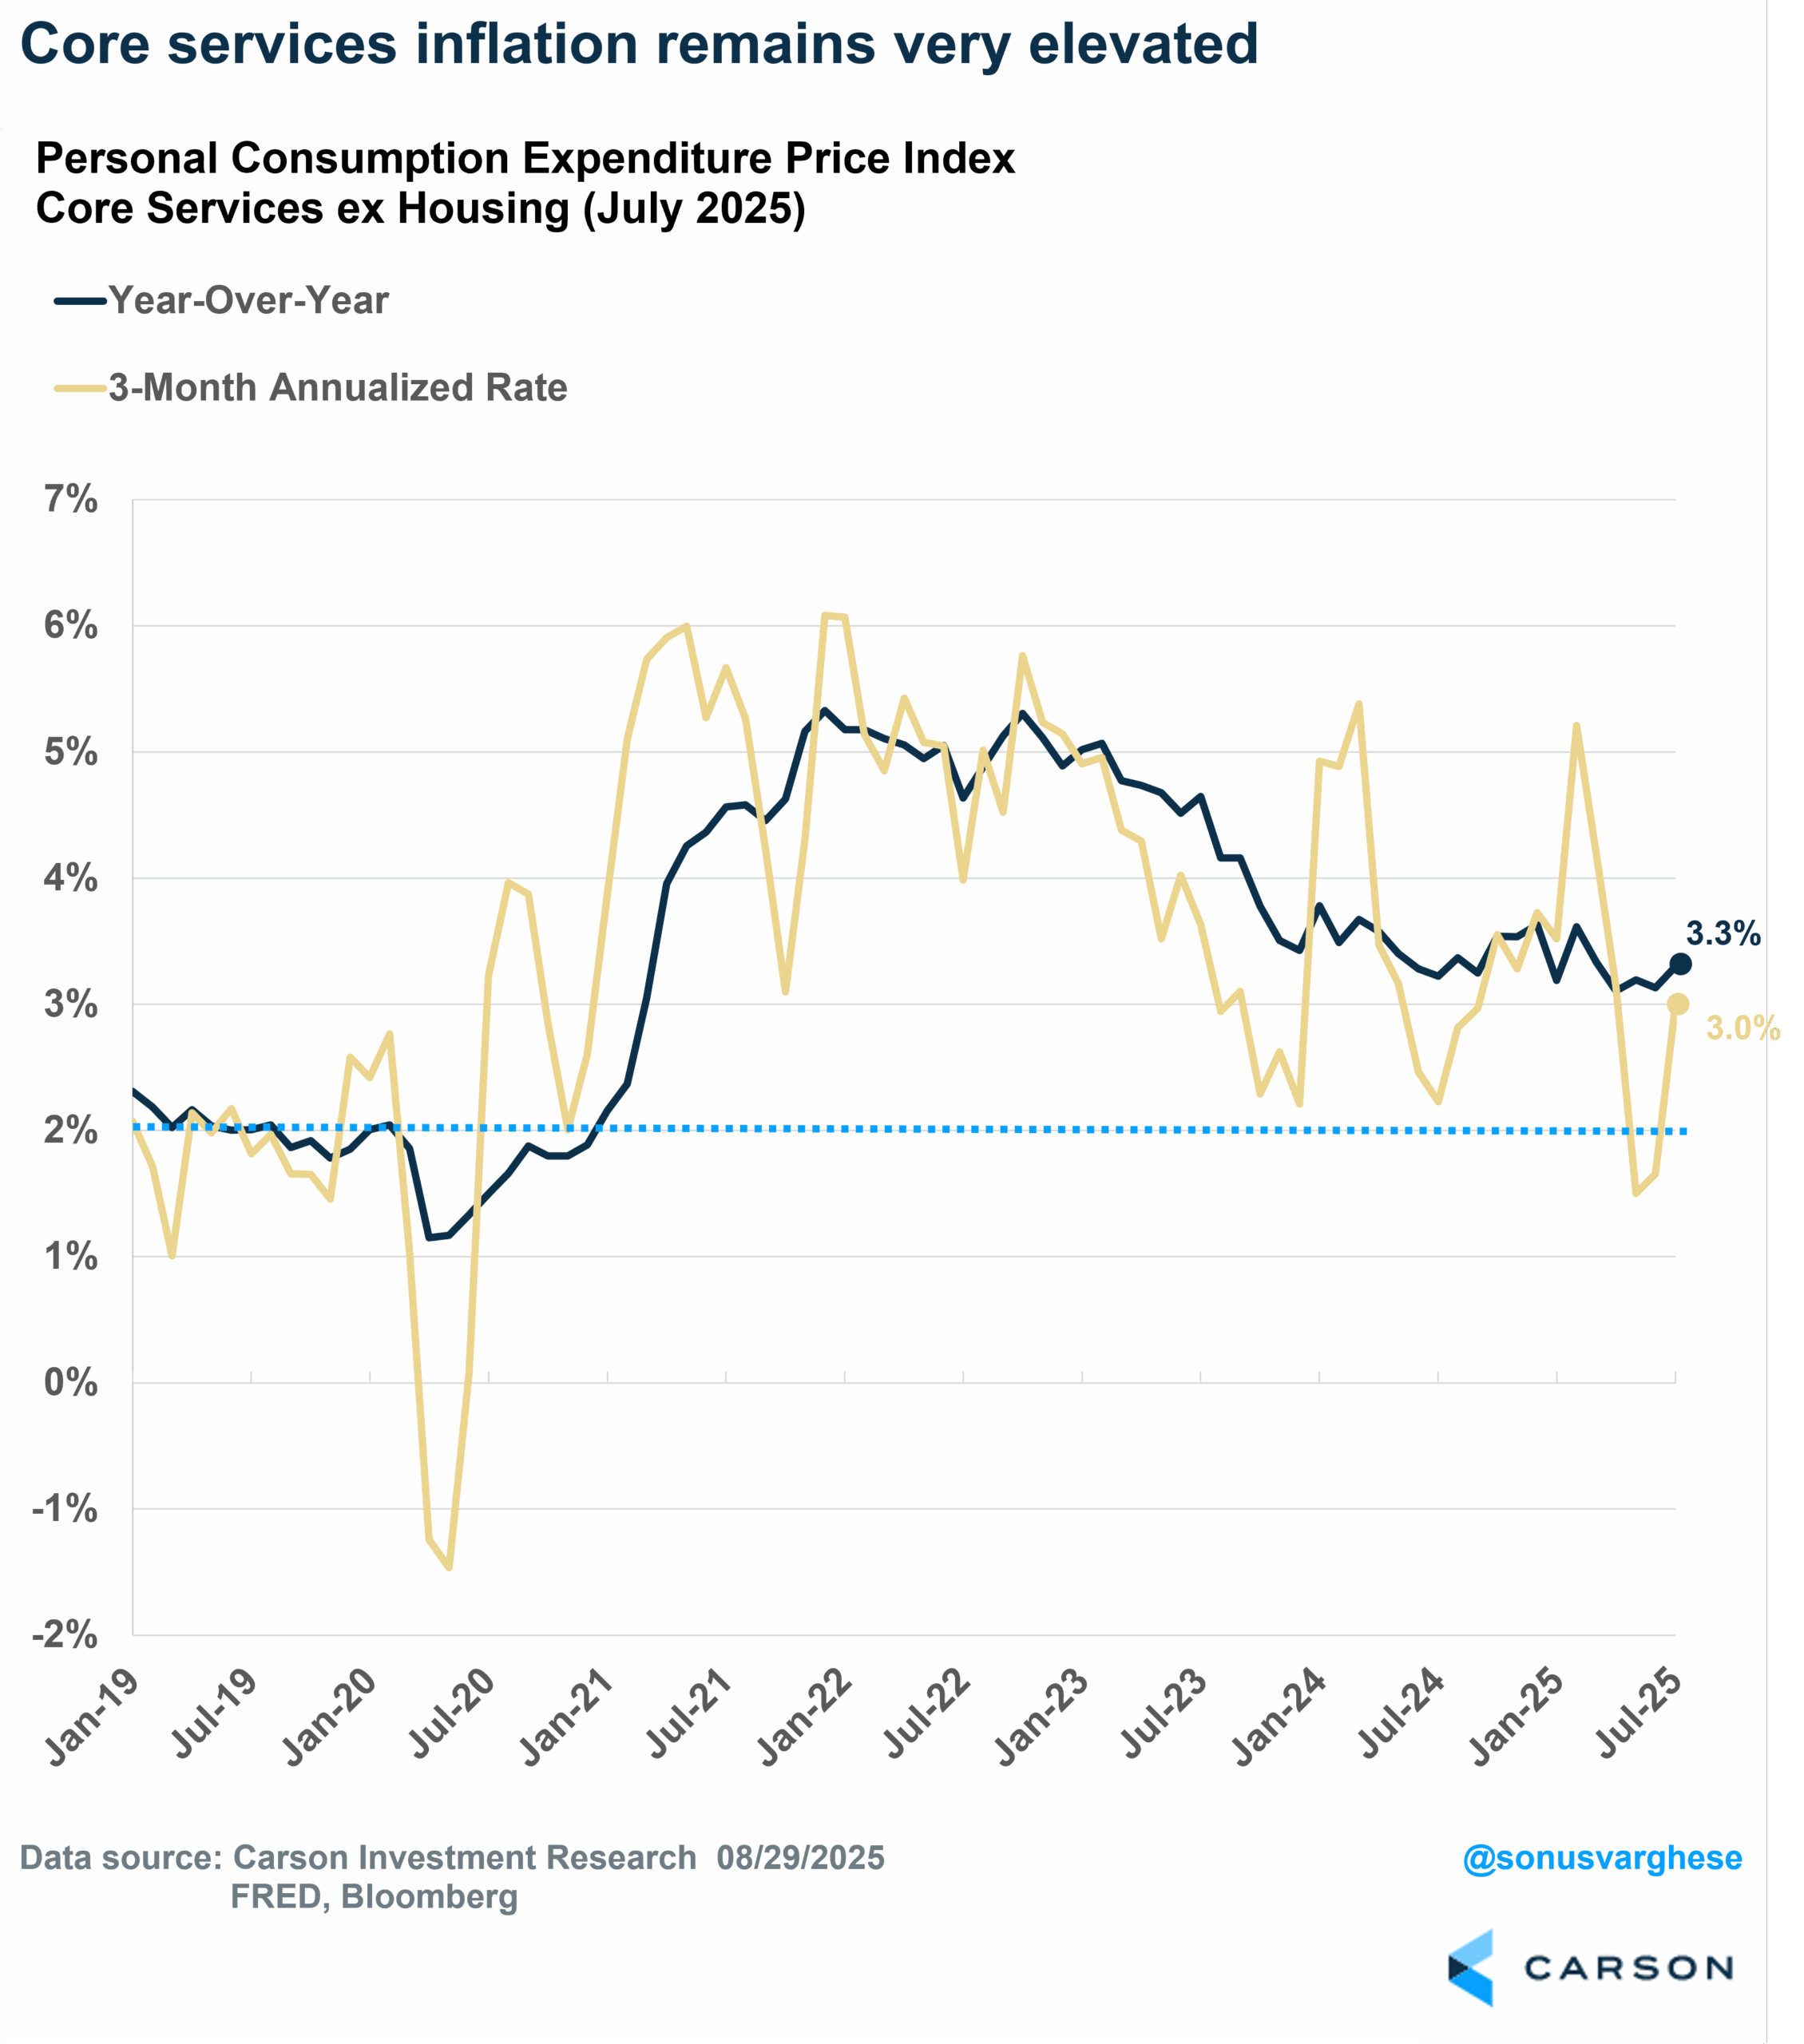
I’m in agreement that core goods inflation, as much as it’s coming from tariffs, is temporary. But the problem is that it’s not the only driver of elevated inflation right now. Case in point: In July the PCE index for durable goods actually fell 0.1%, and yet core PCE was up 0.26% (3.3% annualized). In other words, the inflation problem goes beyond goods. Services inflation is a problem, and that’s a harder one to solve. Up until last year, you could say that lagged housing inflation numbers were pushing up core services, but shelter inflation has normalized now. It also makes up a smaller portion of PCE than it does in the Consumer Price Index (CPI). PCE for core services excluding housing has been showing quite a bit of heat recently, and as you can see in the chart below, it’s running well above where it was pre-pandemic
- Core services ex housing inflation rose 0.39% in July (equivalent to 4.7% annualized)
- Last 3 months (annualized): 3.0%
- Last 12 months: 3.3%
- 2018-2019 (annualized): 2.2%
Note that core services ex housing makes up over 50% of the PCE inflation basket—so it matters.
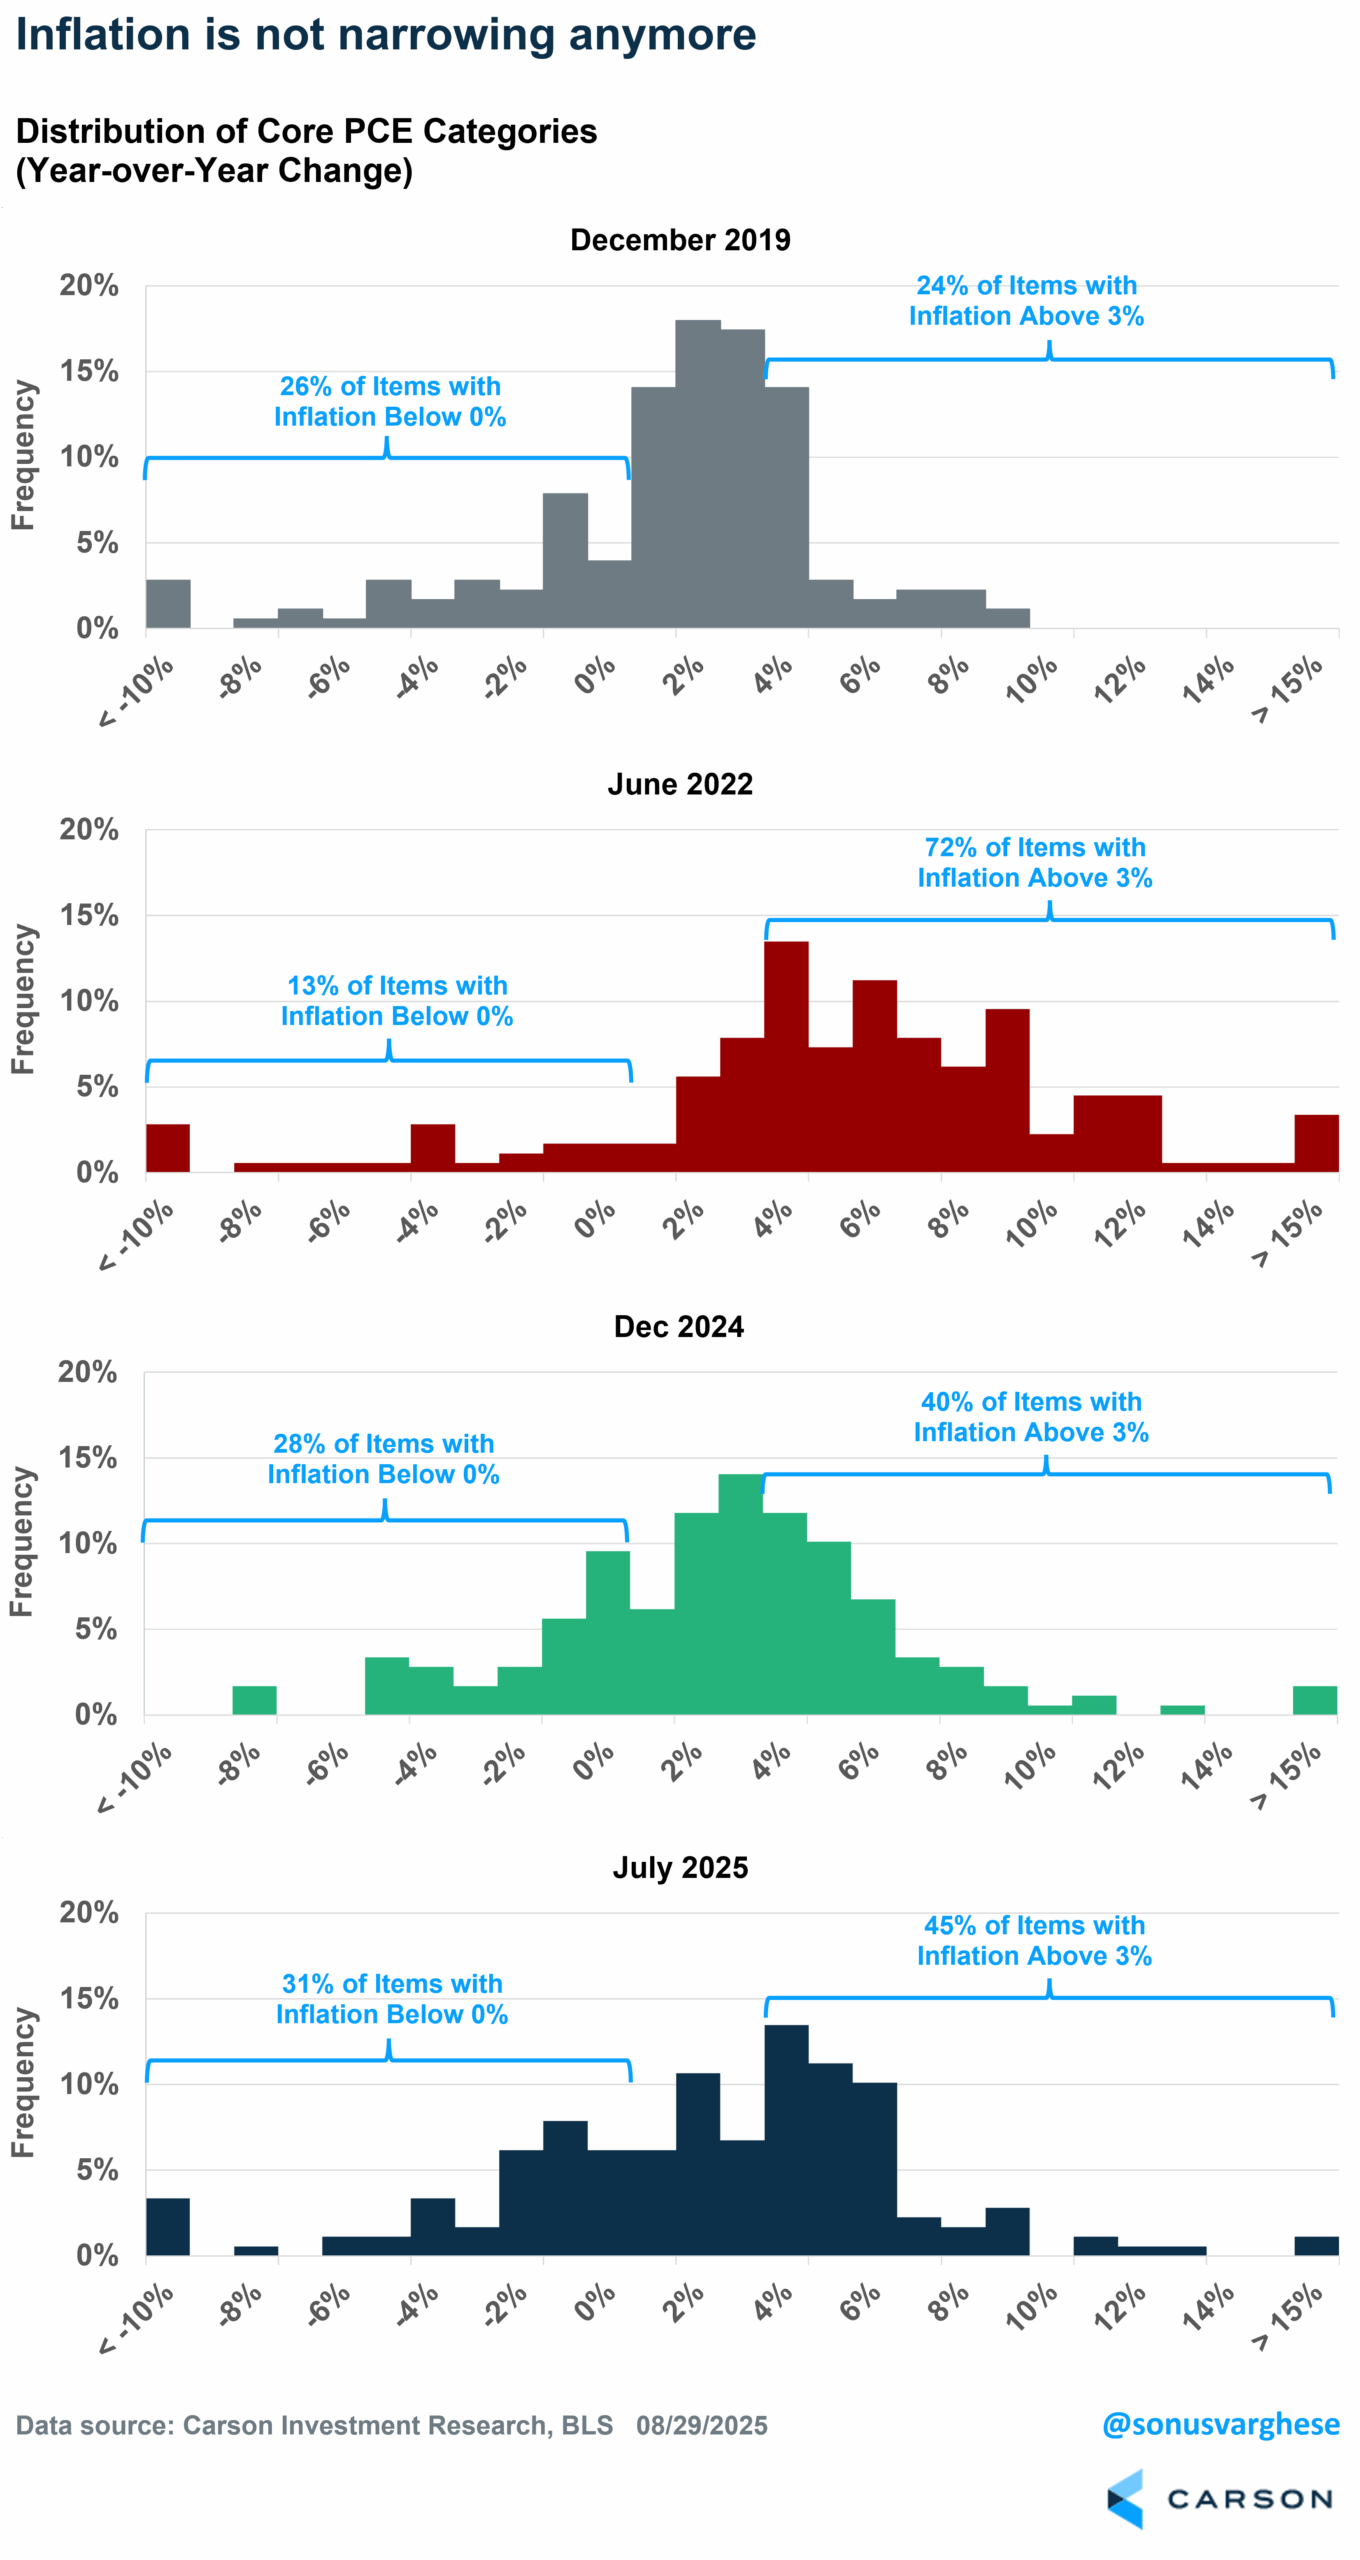
Here’s another way to look at it. I looked at 178 items that make up the core PCE basket and calculated the distribution of year-over-year inflation at four different times. You can see how inflation really broadened out in June 2022 relative to December 2019. Then it started narrowing again through to the end of last year. But things haven’t progressed since then, and in fact, looks to be going in the wrong direction.
- In December 2019, 24% of items had inflation rates above 3%.
- In June 2022 (when inflation peaked), 72% of items had inflation rates above 3%.
- In December 2024, 40% of items had inflation rates above 3%.
- In July 2025, 45% of items had inflation rates above 3%.
We’re still a long way from where things were in 2019, and not moving in the right direction.
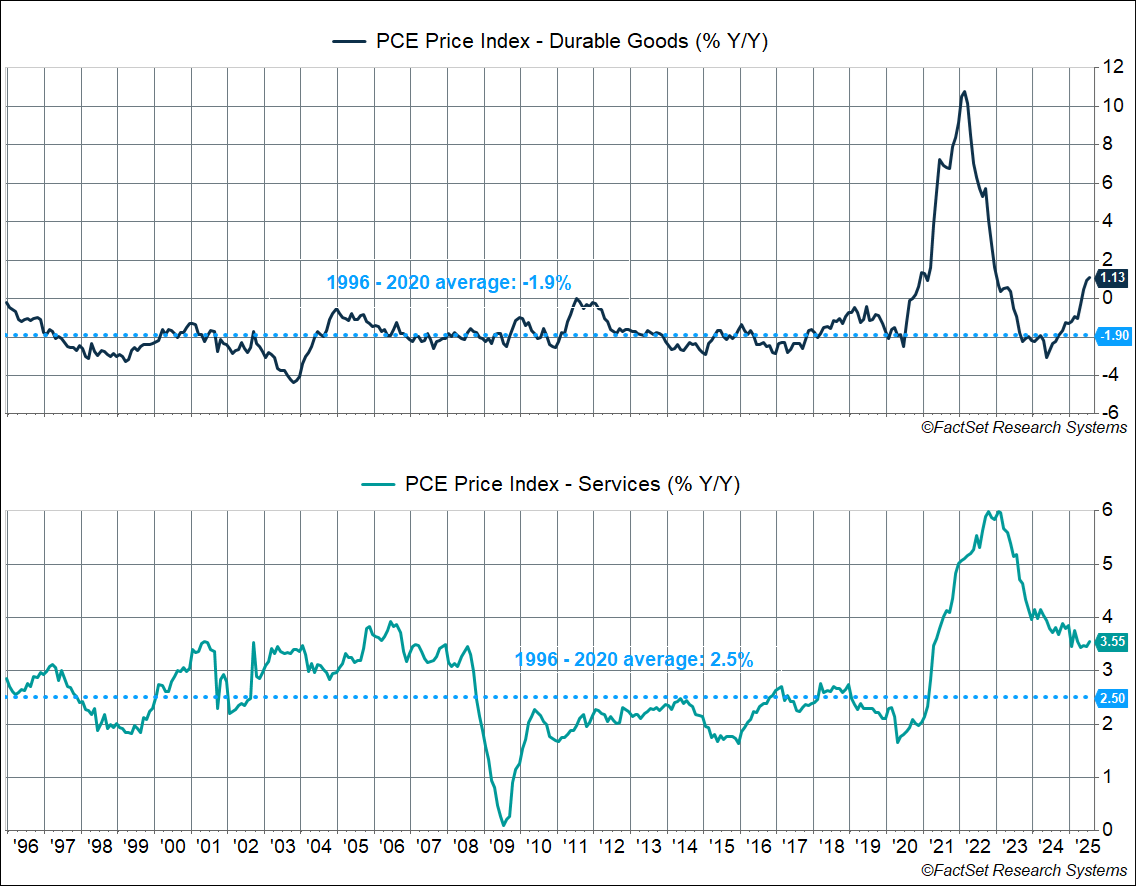
The big picture is that the Fed’s got an inflation problem and it’s coming from two sources, one not so worrying (and perhaps “transitory”) and one more worrying.
- PCE for durable goods is up 1.1% year over year (as of July), which is higher than anything we saw from 1996–2020. In fact, the average inflation rate for durable goods was -1.9%, i.e. prices headed lower and lower for 25 years.
- PCE for services is running at 3.6% year over year and is stuck at that elevated level, especially relative to the average of 2.5% from 1996–2020. (It averaged 2.9% from 1996–2008 and 2.1% from 2009–2020.)
Stay on Top of Market Trends
The Carson Investment Research newsletter offers up-to-date market news, analysis and insights. Subscribe today!
"*" indicates required fields
A Lot of Cuts Are Being Priced In by Markets
As I noted at the top, the downside risks to employment may warrant an insurance cut in September, if not another one in December. But here’s the thing: markets are pricing in a lot more cuts into 2026. The chart below plots expected short-term rates at the end of each year from 2025 to 2031 on three dates: end of last year (Dec 31st, 2024), Liberation Day (April 2nd, 2025), and the current level.
Markets are currently pricing in a policy rate of under 3% by the end of 2026. Given the current policy rate of 4.4%, that implies six cuts (each worth 0.25%-points) over the next 16 months. That’s a lot more than what was expected at the end of last year, when markets expected the policy rate to land close to 4% at the end of 2026, implying just 2 cuts over the two years (2025–2026). Granted, we’ve seen the economy weaken since then, and expectations have fallen a lot. But even on Liberation Day, when recession odds were higher than they are now, markets expected the policy rate at the end of 2026 to be 3.4%, about 1%-point below where it is now (equivalent to 4 cuts).
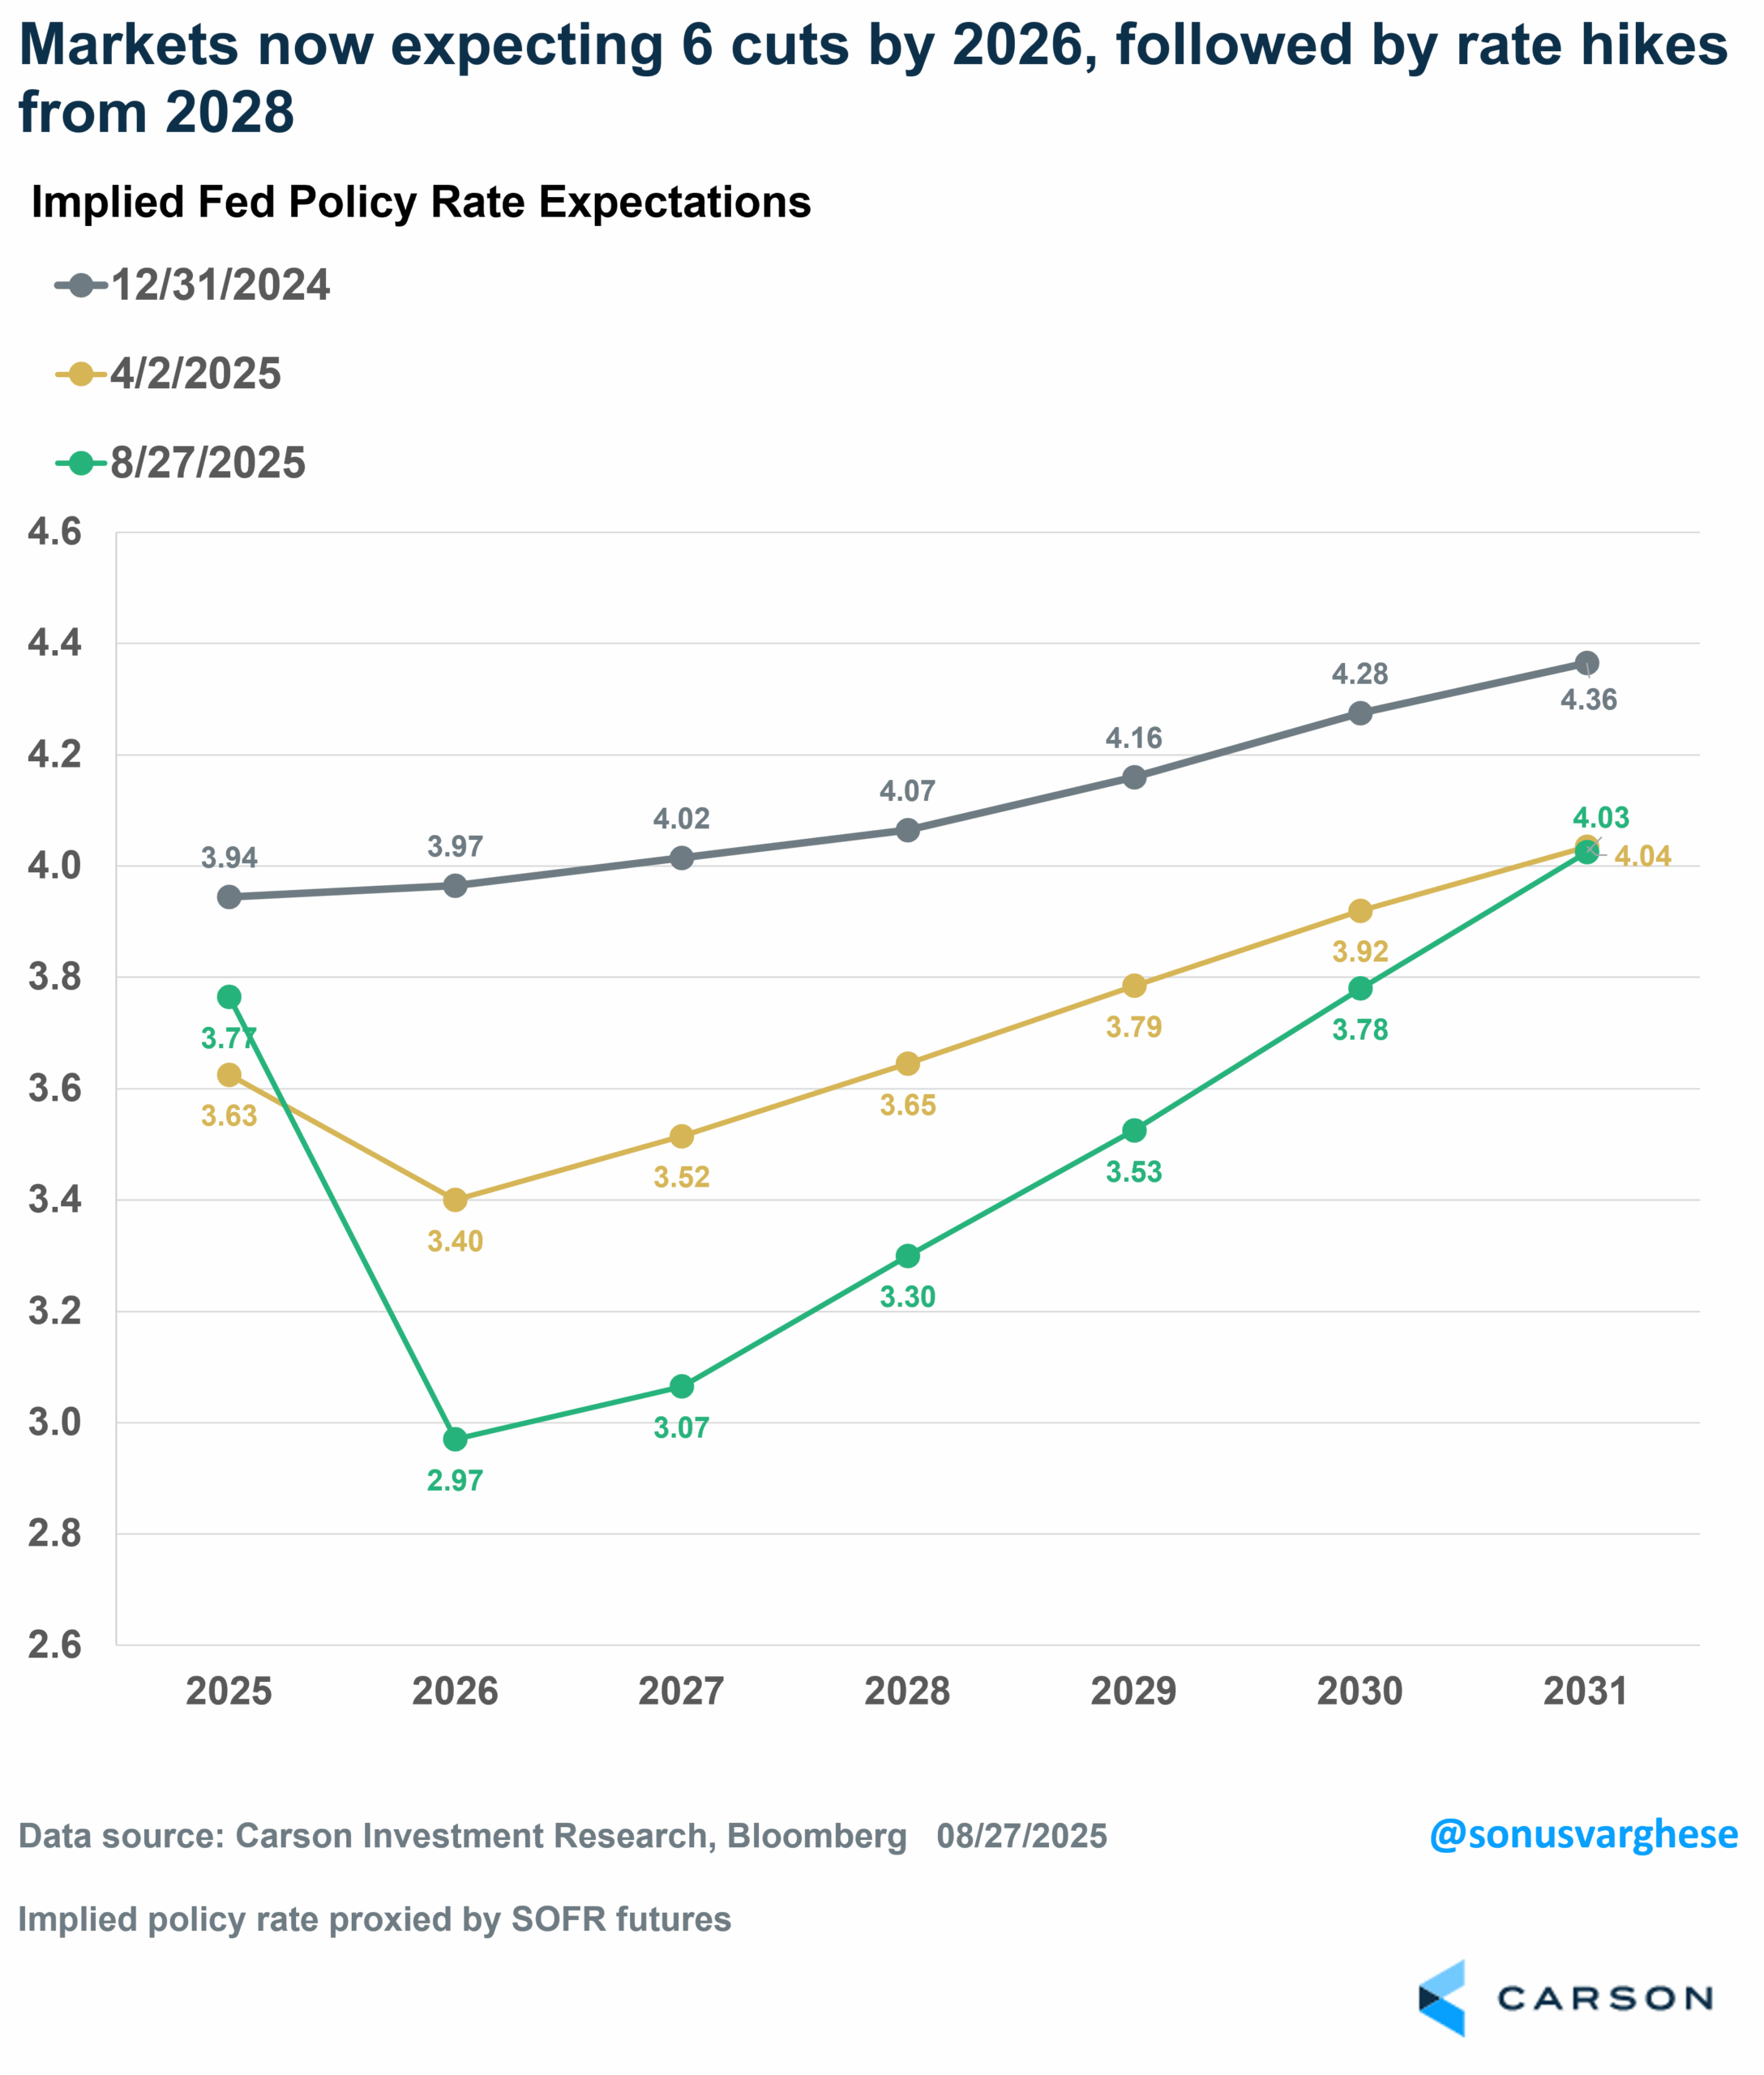
All this to say, markets are now expecting a slew of rate cuts ahead, especially in 2026, even as recession odds have fallen (relative to April) and inflation remains a problem (and as I discussed above, not just because of tariffs). Now, part of this may be because the market is pricing in a Fed that goes along with President Trump’s desire to lower interest rates – he wants to see them near 1% (implying a 3%-point cut from where the policy rate is now), which is extreme given the current environment, but even if you get half of that, it lands you at a policy rate of about 3%. And that’s exactly what markets are pricing in now. The green line in the chart does show that markets expect the Fed to start tightening policy again from 2028 onwards, but that’s well out in the future.
All this is pretty bullish for equities, as we’re seeing several things that markets tend to like:: the likelihood of a very dovish Fed that is looking past elevated inflation; lower recession odds (just by way of lower rates, which may bring a boost in cyclical activity like housing); and deficits heading to about 7%-8% of GDP, which is good for profit growth.
8341768.1.-08.29.25A
For more content by Sonu Varghese, VP, Global Macro Strategist click here
