
“There was a statistician and he put his feet in a bucket of ice and head in the oven. When asked how he felt he answered ‘pretty good on average’.” Old statistics joke
Yes, 2025 isn’t over yet, but that doesn’t mean we shouldn’t start thinking about 2026. In fact, we are actively writing and thinking about our 2026 Outlook currently and in today’s blog I wanted to explore some concepts for next year.
The Big Picture Is Important
As a market strategist, I like to think big picture (macro) and work my way down to more micro. For example, if we don’t see a recession next year (we don’t), that likely means returns would be better.
Let’s just start with any one random year and what to expect. Thanks to Sonu Varghese, VP Global Macro Strategist, for these next two charts.
Here’s what happens over any 1-year return.
- In 62% of years (46 out of 75), annual returns are above 10%.
- In 17% of years, annual returns are positive but “below average.”
- That means almost 80% of the time returns are positive!
- In 12% of years, annual returns are negative but not worse than -10%.
- In 9% of years, annual returns are just terrible (worse than -10%).
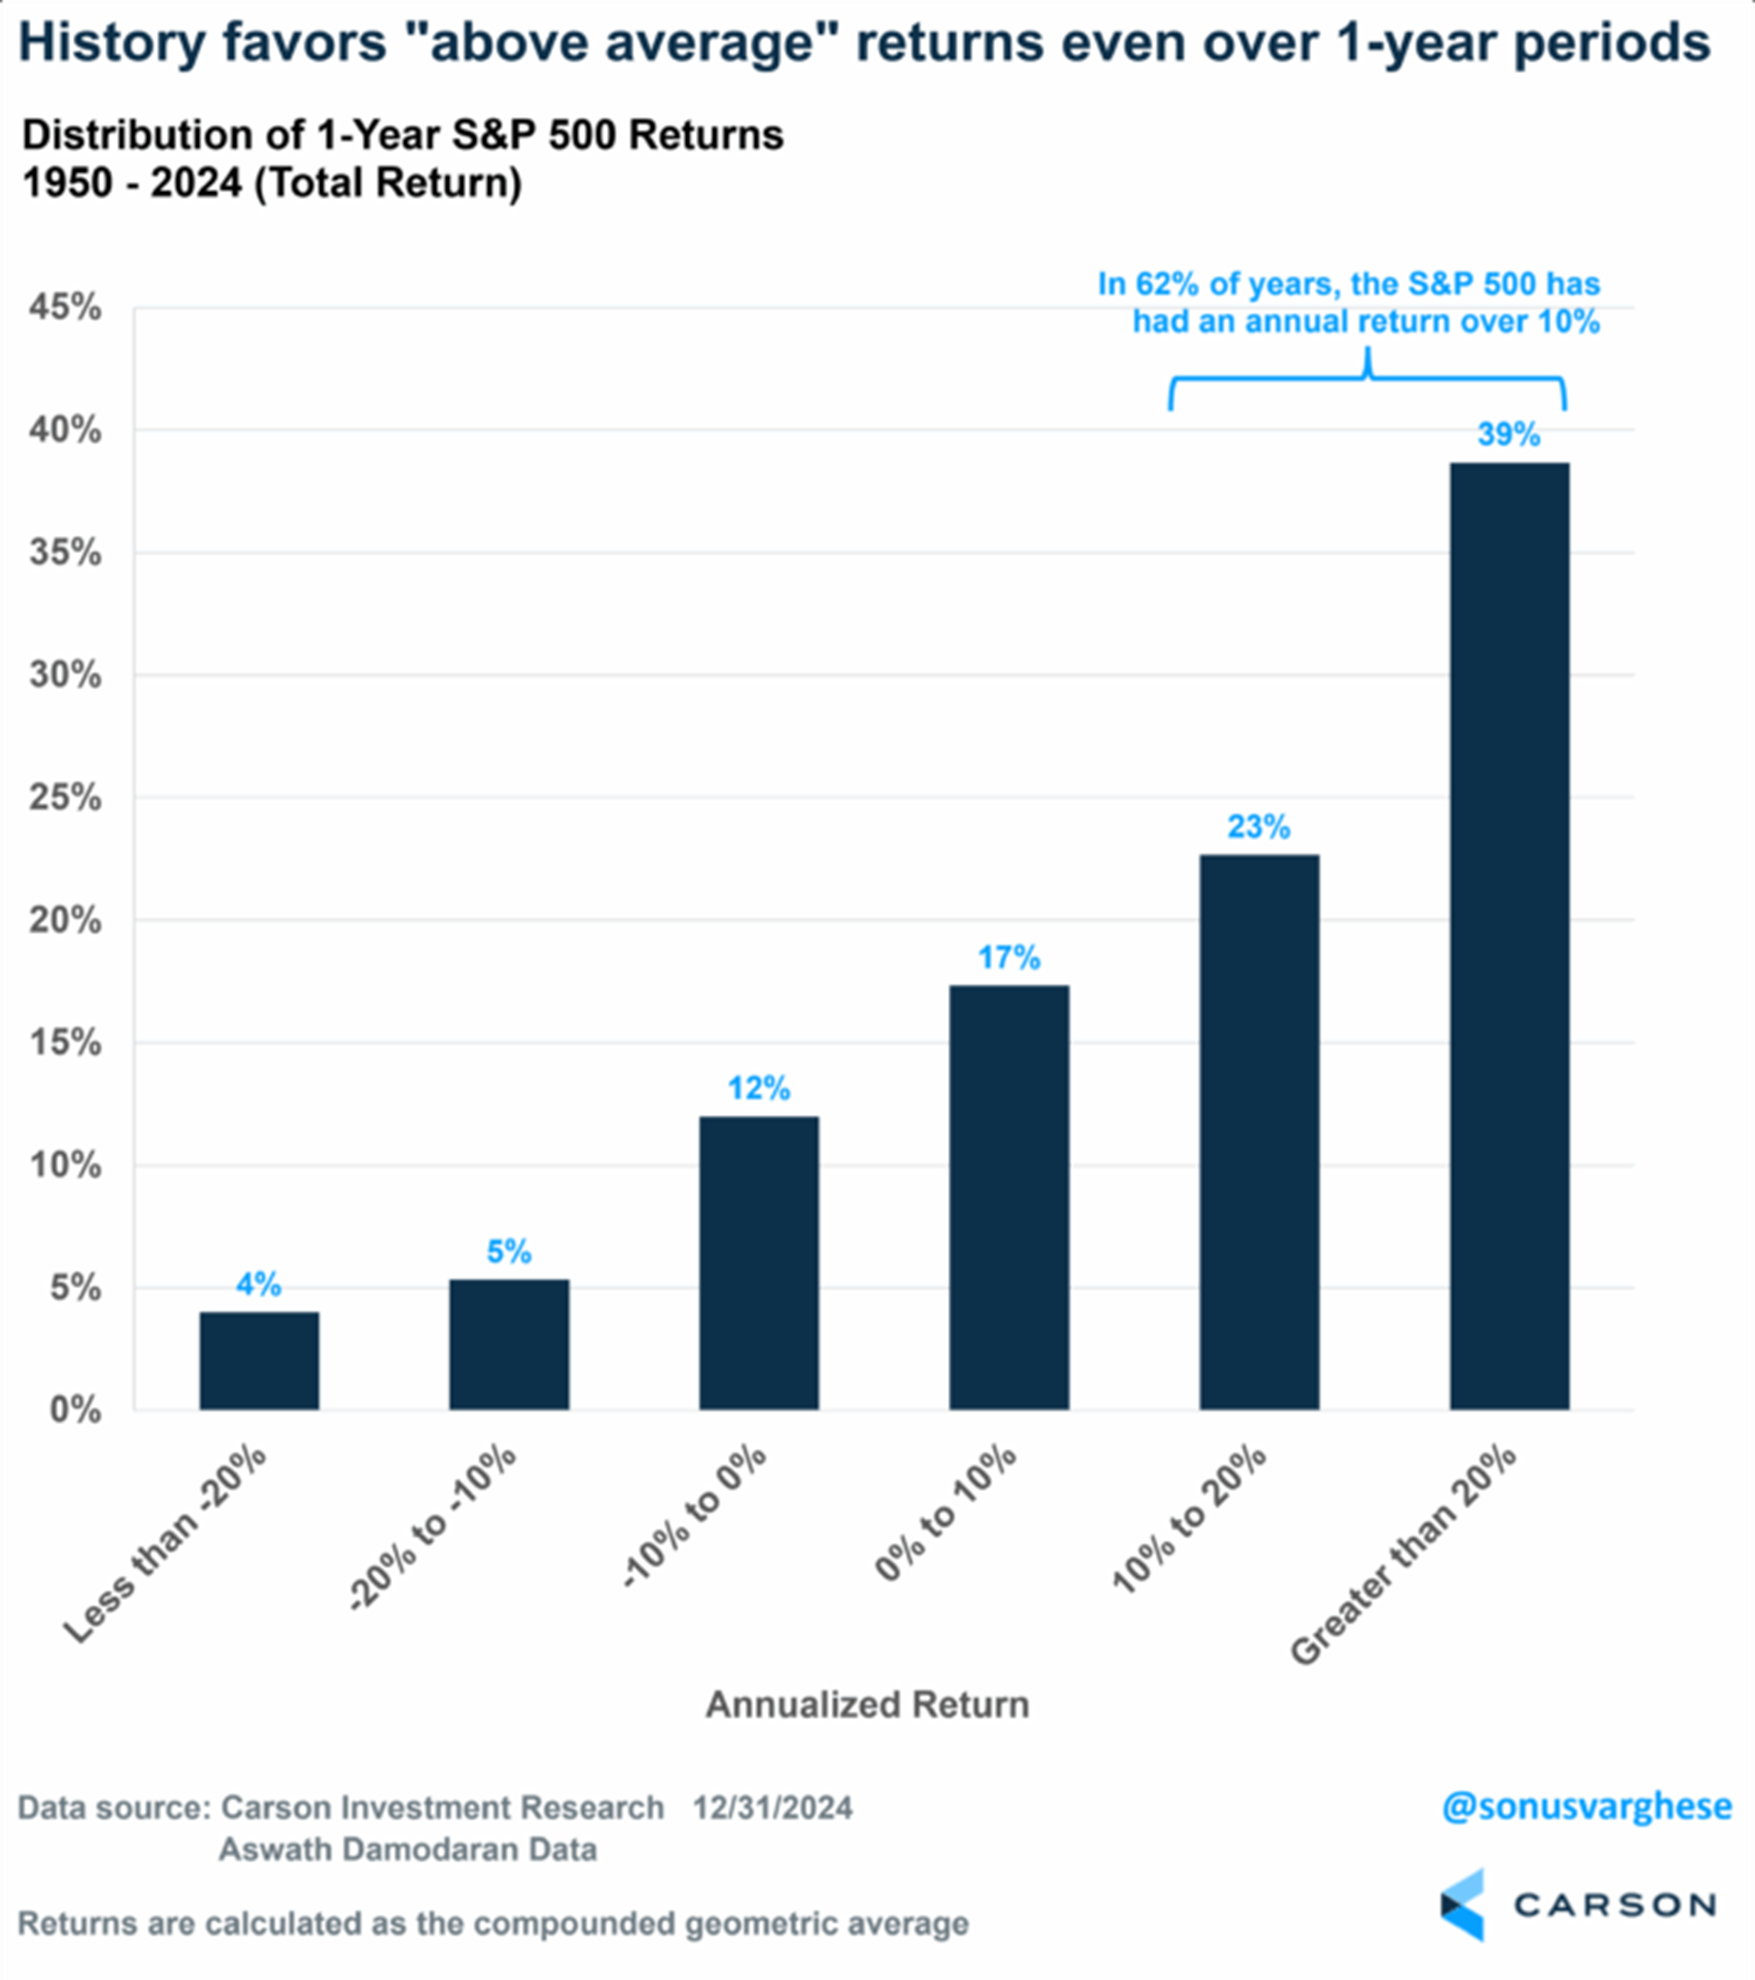
The big takeaway to me is more than 60% of the time stocks have been up double digits, not bad, not bad. Now what about if you avoid a recession during the year? Remember, this is still our base case for 2026.
- In 68% of years (42 out of 62), annual returns are above 10%, up from 62% “unconditional”
- In 18% of years, annual returns are positive but “below average.”
- So, in 86% of years, annual returns are positive, up from 79% “unconditional”
- In 10% of years, annual returns are negative but not worse than -10%, down from 12% “unconditional.”
- In 5% of years, annual returns are just terrible (worse than -10%), down from 9% “unconditional.”

So things get even better if there isn’t a recession, not a big surprise, but important to note.
Larger Gains and Losses Are Common
The average year for the S&P 500 gains about 9%, so you’d think a return between 8% and 10% would happen all the time, but in fact, it is pretty darn rare. This is why the joke about the statistician at the top is so important. There is no such thing as average when it comes to investing.
I’ve shared this chart a lot over the years, but it is just as important now as it was decades ago. We found only four times the past 75 years that the S&P 500 gained between 8% and 10% (or about average). This tells us as investors that returns outside that range are more normal than not.
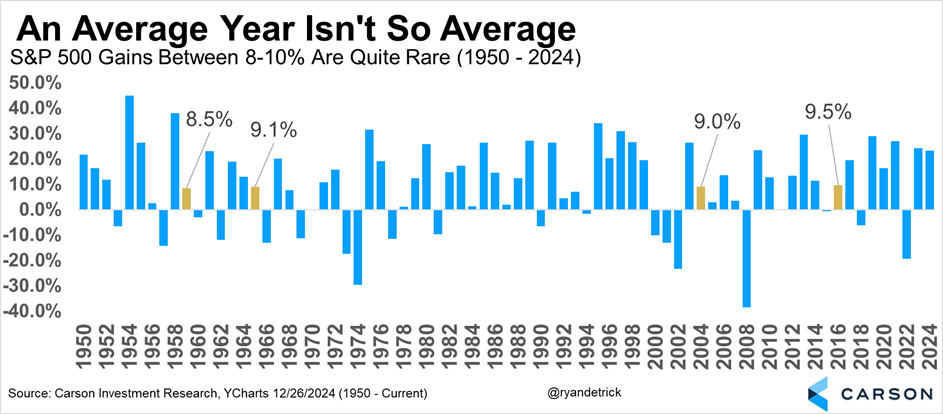
Digging into the data above, 22 times the S&P 500 has gained more than 20% and 21 times it was lower for the year. So the odds of a 20% year are actually greater than a down year, something that always surprises most investors.
Taking this a step further, when stocks are up on average they gain 19% for the year, but they fall nearly 14% when they are down on the year. Once again showing that larger gains are quite common.

What About Midterm Years?
Get ready to hear this a lot, but historically midterm years are indeed the weakest during the four-year presidential cycle. In fact, think back to 2018 and 2022—both saw vicious stock declines and negative returns for the year.
Midterm years gain less than 5% on average, by far the worst out of the four-year presidential cycle, that is what you’ll hear a lot about as we head into 2026. But when you peel back the onion, it turns out under a second term President the returns do much better, so there’s something for everyone here.

But what midterms are really known for is their intra-year volatility. As we show here, midterm years see a 17.5% peak-to-trough max correction on average during the year, far and away the most. Now that’s the bad news; the good news is one year off the midterm-year lows stocks have never been lower and are up an extremely impressive nearly 32% on average.
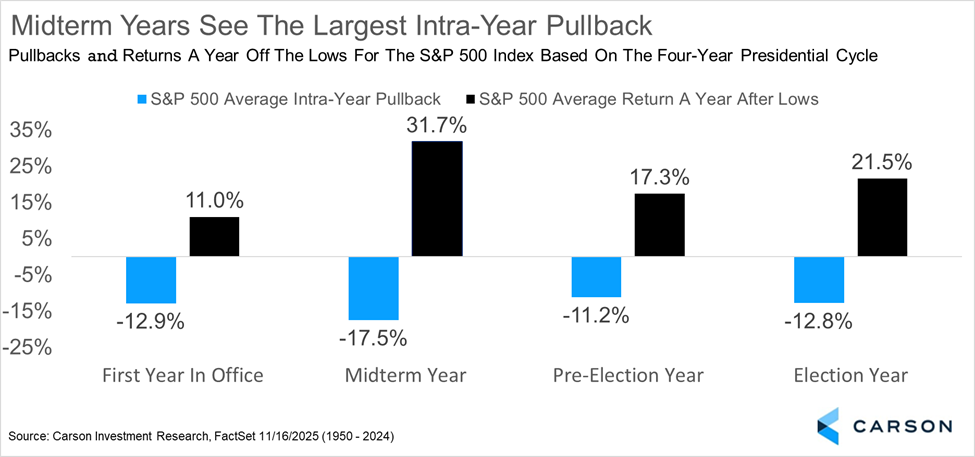
Here’s each midterm year broken down. What stands out to me is they don’t tend to bottom until later in the year (August 18 on average and a median September 29). Still, look at those returns a year later. Should we see some typical midyear volatility, it could be very important to stay the course and not panic.

Let’s Wrap It Up
I won’t give away our overall views for next year (we’ll do that in early January), but these are some things I’m thinking about as we formulate how we see next year playing out.
Thanks as always for reading and for more of our thoughts on next year, be sure to watch our latest Take Five video where Sonu and I discuss 2026.
For more content by Ryan Detrick, Chief Market Strategist click here.
8625505.1.-21NOV25A
