
What a year it has been! The economy surprised, the consumer remained resilient, stocks soared to new highs, and even bonds are looking at a nice year thanks to a late innings rally. Just like everyone called it 😉
As you are reading this I’m hopefully enjoying a nice break the final week of the year. As we wind down 2023 and look ahead to 2024, we want to share with you some of our team’s favorite charts on the year.
We’ll kick it off with two of my favorites followed by some picks from across the team.
The Year Played Out as Expected
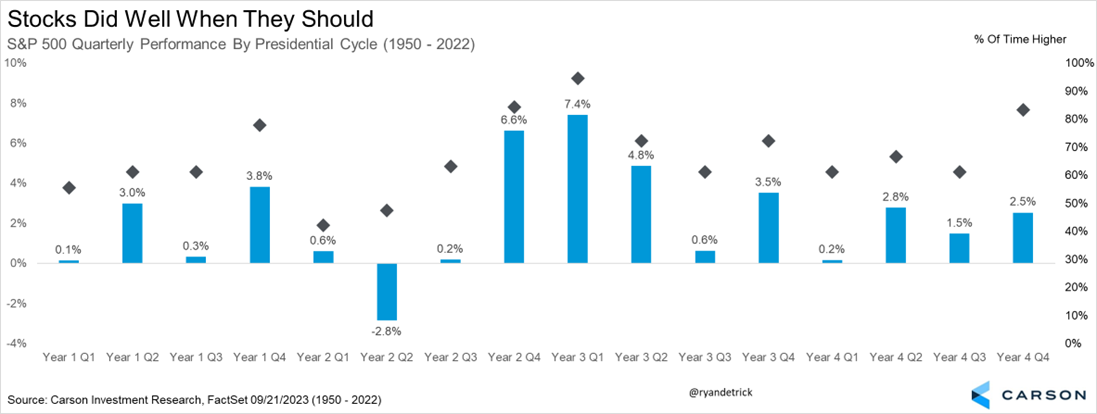
You might not believe it, but this year actually played out just like it was expected to. Pre-election years are usually strong, but they are even better under a first-term President, up more than 20% on average (something we should hit this year).
Breaking the four-year presidential cycle down by quarters, stocks tend to do quite well the first half of a pre-election year (like 2023), catch their breath in Q3, and then gain into year end. Does that sound familiar? Below is a chart I’ve probably shared 100 times this year, but I’m still amazed how well it all played out.
Inflation Was Expected to Come Back to Earth
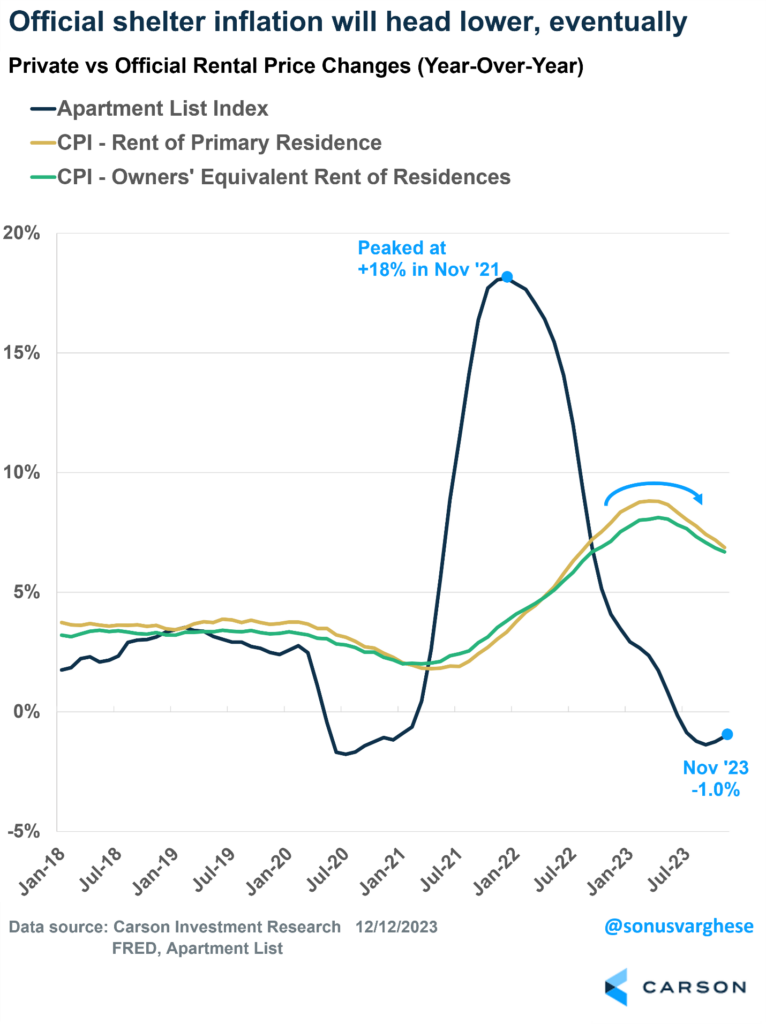
Here’s my other favorite chart of the year. We started sharing this chart late last year and it was one of the main reasons we expected to see inflation come back down, likely opening the door for a Fed pivot away from their hawkish stance.
In the chart below we look at private data from Apartment List showing that rent prices collapsed well ahead of the government’s data. I won’t get into all the reasons why now, but the government’s data lags by many, many months and this was a subtle clue that shelter (40% of the core Consumer Price Index) was likely going to crack eventually. Sure enough, late this year we started to see shelter inflation slow and this opened the door for the Fed to pivot (exactly what they did on December 13).
The Manufacturing Renaissance is Here
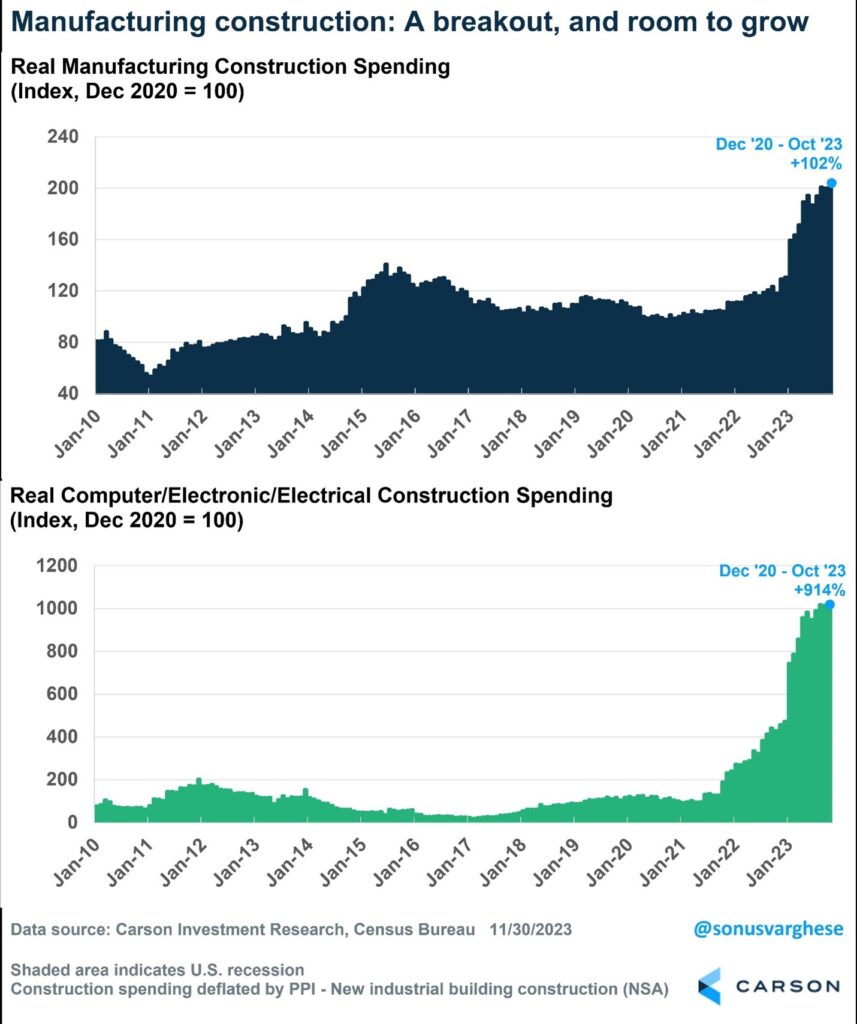
Below is Sonu Varghese, VP, Global Macro Strategist’s favorite chart of ’23:
I’ve never seen an economic chart like this, especially one related to factory construction of all things. This is a massively underrated story of what’s happening in America right now, and brings together several key themes that center around a renaissance for American manufacturing:
- Reshoring
- Business investment into high-tech equipment like semiconductors (a lot of it driven by AI hardware needs) and EV batteries
- Significant incentives from the Federal government to spur private investment in transformational technology
The good news is that this is not just a 2023 story. There’s going to be more coming, and the “fruits” of these investments will be seen over the next decade in America.
AI YAI YAI!
And from Jake Bleicher, Portfolio Manager, a stock chart candidate for top chart of the year:
To me, the narrative of 2023 is captured by a chart of NVIDIA, the maker of high-end computer chips that have become the bedrock of artificial intelligence. Emerging from the depths of the 2022 bear market, the introduction of ChatGPT illuminated the potential of AI for the layman, igniting a remarkable surge in related tech stocks. Despite higher interest rates, mega-cap technology companies roared higher. As we approach 2024, the AI theme appears enduring, but investors are now recognizing its broader implications as this transformative technology permeates businesses of all shapes and sizes, not just mega cap tech.
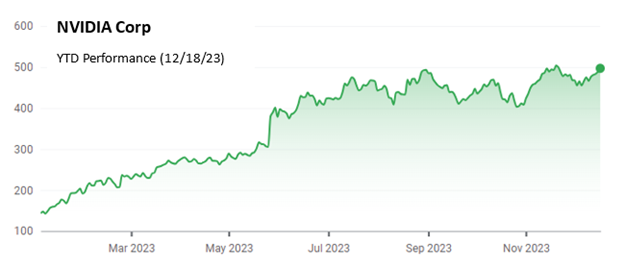
Source: FactSet 12/18/2023
Yields Back Where They Started
And here is Barry Gilbert, VP, Asset Allocation Strategist’s top chart from ’23.
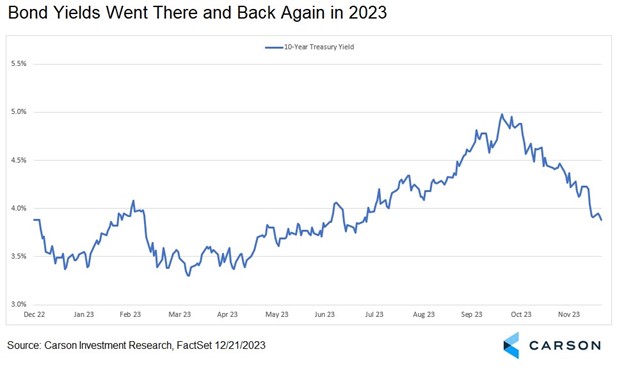
For me, nothing tells the story of markets in 2023 like yields, and the 10-year Treasury yield is a great reference point. We can read off its movements all the big stories of 2023: accelerating disinflation; an aggressive Fed; and a thriving U.S. economy despite all the skeptics.
The 10-year Treasury yield entered the year at 3.88% and it looked like rates might be starting to stabilize after peaking near 4.2% in October 2022 and causing a heap of pain going back to the summer of 2020. But the Fed was determined in its fight against inflation as the economy continued to defy expectations. By mid-October, the 10-year Treasury yield was just short of 5% and at a level not seen since before the Great Financial Crisis.
But then a funny thing happened. The disinflation expected by many accelerated, economic growth went from great to just pretty good with a few downside economic surprises, and a tough-talking Fed began to use more balanced language. The flood gates of bond demand opened and we saw the 10-year Treasury yield plummet more than a full percentage point in about two months, taking it back to just a little higher than where it started the year.
With the yield curve flat, no movement in the 10-year yield for the year left returns for short-term Treasuries and intermediate bonds about the same. But if you were willing to still shy away from rate-sensitive bonds early in the year and add rate sensitivity aggressively late (consistent with Carson Investment Team recommendations), it was a pretty good round trip.
We often connect our “no recession in 2023” call to our equity overweight, but where it may have had a more profound impact, especially in bond-heavy allocations, was on the fixed income side, another reason why the 10-year Treasury yield is my candidate for 2023 Chart of the Year.
Value and Growth Also Back Where They Started
And here is Grant Engelbart, VP, Investment Strategist’s top chart from ’23:
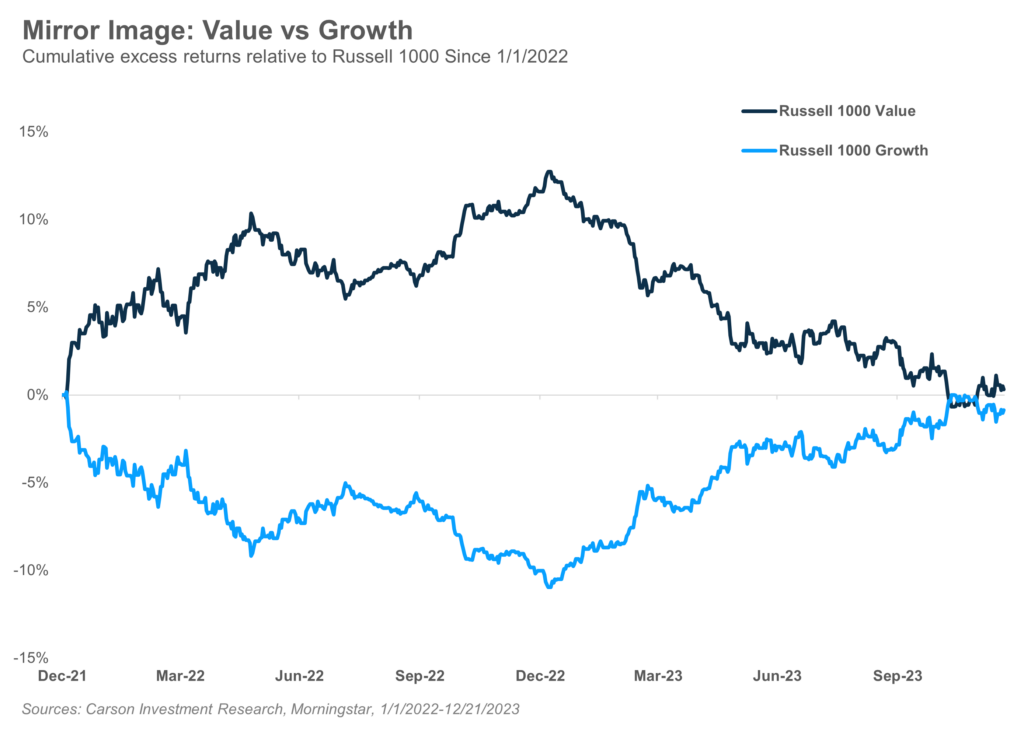
The decision to invest in value stocks or growth stocks is one of the most impactful an equity investor or manager can make, and something I keep a close eye on. 2022 was a painful year across asset classes (sorry to bring it up!), but on a relative basis, value investors did quite well. Now relative performance doesn’t pay the bills in a down year, but value did provide some help in 2022 by outperforming growth stocks by the most since the tech bubble burst in 2000!
As we know, the stock market has a tendency to react in ways that go against the expectations of the crowd. And sure enough, in 2023 growth stocks began to outperform value stocks, and did so in dramatic fashion. Thus far in 2023, growth is outperforming value by the second most since the inception of the widely followed Russell style indices (1979).
My chart of the year is the returns of value and growth stocks relative to the broad Russell 1000, which encompasses both. When you look at the picture from the beginning of 2022, all of the outperformance of value stocks has now been washed away by the growth rebound in 2023. The game is tied 0-0, right back where we started! If these massive divergences don’t beg for a balanced investing approach with highly research-driven decisions around portfolio adjustments, I don’t know what does.
What a year is has been. We are honored you’ve been with us on this ride and we will continue to do all we can to be the most trusted and transparent research shop out there.
Stay on Top of Market Trends
The Carson Investment Research newsletter offers up-to-date market news, analysis and insights. Subscribe today!
"*" indicates required fields
Here’s to a safe New Year’s Eve for everyone and we’ll see next year!
For more of Ryan’s thoughts click here.
2038741-1223-A