
Monday, June 30, concluded an extraordinary first half for markets. The end of the half is always a good time to look at what’s been happening in markets and think about implications for the second half of the year. Here are some highlights from the first half of the year and what they might tell us about what we may see over the rest of 2025.
An Ordinary Year So Far If You Only Saw the Beginning and End
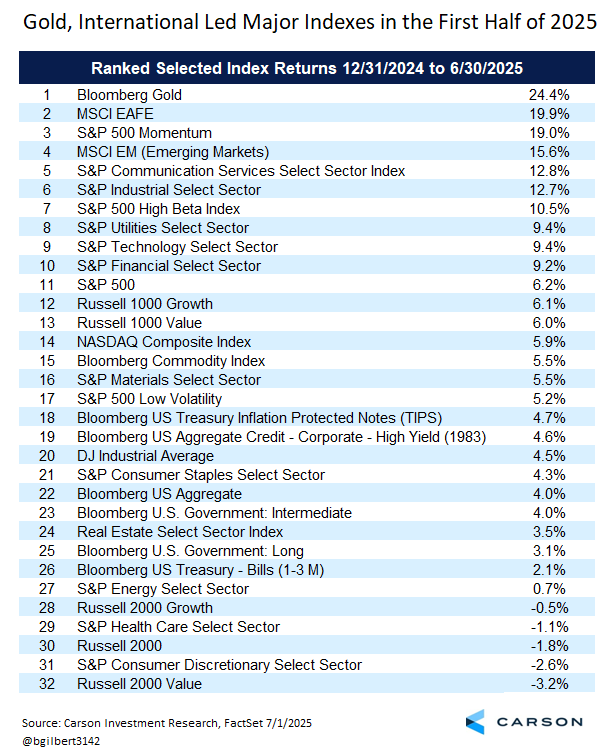
If you just looked at the endpoint, the first half of 2025 looked rather ordinary. The S&P 500 Index had a total return of 6.2% over the first half. That annualizes out to 12.4%, which is within the 12–15% forecast range of our Outlook 2025. The Bloomberg US Aggregate returned 4.0%, ahead of the pace for our forecasted return. There were surprises (the continued strength of gold; a historical six months for international stocks), but there always will be. But stated simply, markets did about what you would expect them to do in an expansion.
But those numbers cover up a lot of volatility. The S&P 500 plunged to a near-bear market between February 19 and April 9 on a botched initial rollout of the most extreme tariff policy in over 100 years, followed by an equally dramatic rebound. Even if the rollout were only a negotiating position, which we think is likely, it still was probably miscalculated. There is a big difference between negotiating when running a family business and when running the largest economy in the world. The knock-on effects for a small business are trivial or can even be positive, but for a large economy, the cost of uncertainty can be high, even if the policy that’s being negotiated may provide a good outcome. President Trump’s acumen running a business may end up benefitting the country, but only where he can effectively translate his business experience to a larger theater. This can be difficult for an older president who has become set in his ways, a lesson we also learned from Joe Biden.
Stay on Top of Market Trends
The Carson Investment Research newsletter offers up-to-date market news, analysis and insights. Subscribe today!
"*" indicates required fields
Of course, despite the failed rollout of tariffs to date (with little benefit so far to offset the costs), the initial position has been rolled back and markets did respond positively to the change. In our Outlook 2025, we highlighted what we saw as the main opportunities and risks for the economy for 2025. The primary risk (tariffs) came in much more strongly than expected, but as the position has been moderated the opportunities (fiscal stimulus and lower rates) have received increasing attention. That shift has put markets back on course with our expectations.
Takeaway: It would be hard to call the economy fragile with heavily deficit-financed stimulus coming our way. Nevertheless, we are still later cycle with the typical vulnerabilities that come with a later cycle economy. But later cycle can last a long time and is never on a clock. Fiscal stimulus, a potentially improving rate cut outlook, healthy household and corporate balance sheets, and a continued build-out of AI infrastructure may all contribute to a more extended cycle. We did not change our outlook the S&P 500 during all the market volatility and with opportunities potentially starting to outweigh risks, we see little reason to change course now.
International Stocks Provide Diversification
We looked at the spread between the MSCI EAFE Index (“EAFE”) of developed market international stocks for every half year going back the last 25 years, and it won’t be a complete surprise to learn that H1 2025 had the largest outperformance for EAFE of any of the last 50 half-year periods. EAFE returned 19.9% in the first half of 2025 versus 6.2% for the S&P 500 for a 13.7% spread. (For those wondering, the second best period has the first half of 2002 when the spread was 11.8%.) Let’s not get overexcited. The first and second half of 2024 were ranked 47th and 48th out of the 50 half-year periods, with the S&P 500 outperforming the EAFE Index by 9.5% and 9.8% respectively. But maybe that should have told us negative sentiment around international had become overextended?
In fact, following the 10 worst half years of EAFE underperformance, EAFE has averaged slight outperformance to the S&P 500 over the next six months and next year. But EAFE has underperformed the S&P 500 over the next six months and year following its 10 best half years of outperformance, although by less than the average for the whole period.
Takeaway: We are currently neutral on international relative to the U.S. We still see the U.S. as having a meaningful edge when it comes to technology and a broadly pro-business policy environment, although we believe the current administration’s tariff and immigration policies (the latter restricting the labor force) are weighing on businesses, offsetting a boost from a more balanced approached to regulation. The U.S. is also engaging in a bit of experiment in letting the rest of the world operate closer to a free trade zone while the U.S. isolates itself with more protectionist policies. While this may not be much of a negative for the U.S. given its large negative trade balance, it may make companies outside of the U.S. more competitive. These factors along with dollar expectations contribute to our balanced view.
Gold Shines Again
Gold’s 24.4% return was its second best half year in the last 25 years. (The best year was the first half of 2007 when it returned 28%.) Returns were more muted following the other top four periods, with a 2.9% average return over the next six months and a 5.9% over the year, not bad returns but below the historical average for the whole period.
Takeaway: We do hold some exposure to gold in our models, a position we’ve had since March 2023, highlighting that the decision was driven by portfolio considerations rather than return chasing. We view gold as part of a general portfolio strategy to “diversify diversifiers” due to inflation uncertainty and above-historical stock/bond correlations and not simply as a return play. Gold prices have found some support in central bank buying, Chinese demand as real estate falters, geopolitical risk, inflation uncertainty, concerns about the U.S. fiscal situation, and the weakening dollar. There is also the sentiment-driven speculative buying that builds on top of these more fundamental drivers. We did take a little out of our gold position in early May, but believe its role as a diversifier still has value.
The Dollar in Decline?
The first half of 2025 was the weakest half year for the dollar in the last 25 years and the weakest first half since 1973. The dollar as measured by the ICE US Dollar Index declined 10.7%, returning the index to the 90-100 range it held for most of 2015–2021.
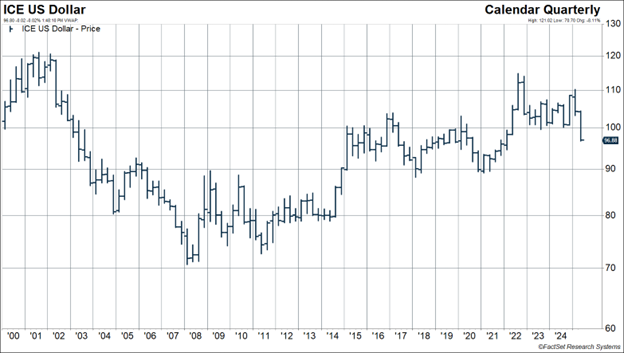
The dollars decline is part of what helped support international stock returns for U.S.-based investors, who get the foreign currency return relative to the dollar on top of the foreign index return in its local currency. Historically, those currency changes account for about 40% of the relative performance between the S&P 500 and the MSCI EAFE Indexes.
Takeaway: It is notoriously difficult to forecast currency returns because of all the factors that go into determining exchange rates. To a first approximation, we can look at changes in interest rate expectations and there was a fair amount of compression in US policy rate expectations for the end of 2025 compared to the ECB’s policy rate, despite the Fed slow walking rate cuts. U.S. policy uncertainty may also be contributing, leading foreign central banks to further diversify reserves (including gold purchases), although this is a slow-moving force and we believe the odds the dollar will lose its status as the world’s reserve currency any time soon are low to negligible. The currency world is always relative and the U.S. remains the cleanest dirty shirt in the laundry. That said, the forces pushing the dollar lower are likely to remain at least partially in play, making a base case of a sideways-to-lower dollar the path of least resistance. We wouldn’t bet on there being a continued major currency tailwind for international stocks, but we don’t think there will be a shift to the dollar becoming a headwind, and that would be good enough to continue to make a benchmark-like allocation to international equities reasonable as an added diversifier.
Thinking About the Big Picture
While not a conversation about the last half year, let’s also take a look at the big picture. Below is the 25-year annualized return for the indexes listed in the earlier chart for which we have a full 25 years of data, and here the numbers might be surprising.
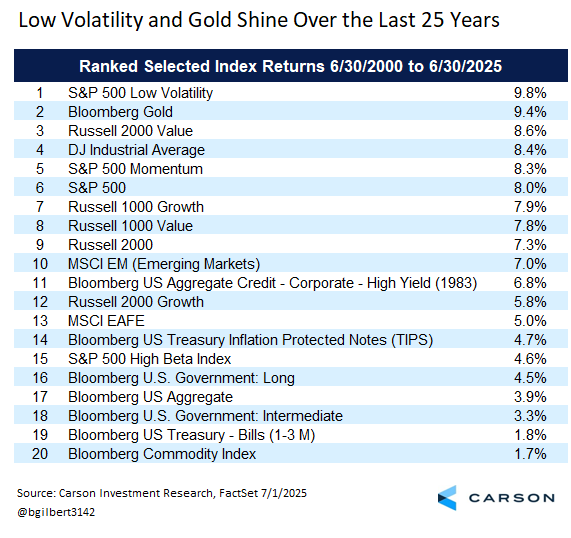
The total return for the S&P 500 hasn’t been outstanding over the last 25 years, in part because the timing of the starting point. Over first 2½ years for the period, the S&P 500 sold off 37%, losing ground in every six-month period. Nevertheless, an 8% annualized return for 25 years isn’t too shabby and the 6.2% premium to T-bills is actually attractive. The Bloomberg US Aggregate has returned a respectable 3.9% annualized and over such a long period that basically reflects the average yield over the period.
A few items do stand out though
The spread between the S&P 500 Low Volatility Index (lower risk stocks) and the S&P 500 High Beta Index (higher risk stocks) is extraordinarily wide (9.8% versus 4.6%). Again, the starting point plays a role. In the two years starting in the second half of 2000, the S&P 500 High Beta Index returned -65%, losing almost 2/3 of its value. The S&P 500 Low Volatility Index gained 35% over the same period. Over the next 23 years, the High Beta Index gained an annualized 9.8% while the Low Volatility Index gained an annualized 9.2%. (But over that period the standard deviation (a measure of risk) was 25% for High Beta and 11% for Low Volatility.) Our strategic takeaway would be that we would expect this effect to persist, especially on a risk-adjusted basis, but not to the extreme experienced over the full 25 years. Simply put, lower risk stocks might not outperform, although they’ll likely hang in there, but they are much more risk efficient.
Also standing out is the second item on the chart, the Bloomberg Gold Index. It’s been a heck of a run for the yellow metal over the last 25 years, highlighted by the back half of the 2000s. In the five years ending in 2010, gold returned an annualized 21%. (Fair warning that the next five years it returned an annualized -6%.) The 12% returned over the last five years is not nearly as extreme by comparison, but as noted above we just had the second best half year for gold in the last 25 years and that means we should probably temper expectations looking to the end of the year, although we believe it still retains value as a diversifier.
Takeaway: The big question is whether any of these patterns are structural and may persist, at least from a strategic perspective. We do not expect low volatility stocks to perform as well as they did over the last 25 years, even on a relative basis, but they have exhibited the value they can have in a portfolio and we continue to incorporate a barbell of exposure to lower volatility stocks and momentum stocks in our portfolios and we think the broad structural benefits of the combination are likely to persist. Gold expectations need to be lowered, but we believe it may continue to have value as a diversifier, but view that as more a tactical than a strategic play. It’s also worth noting that emerging markets are in a different place than they were 25 years ago, with China’s economy, which is now entering a more challenging growth phase, just starting to show its potential back then.
While backwards looking, we learned a lot in the first half of the year, but there are no crystal balls in investing. Key themes for us remain reasonable confidence that market opportunities will outpace risks for equities, something the first half rebound highlighted; the need to diversify diversifiers and not simply rely on fixed income; and a willingness to have benchmark-like exposure to international. In general, we’re in a period of elevated uncertainty, but that doesn’t at all mean abandoning riskier assets. In fact, sometimes it presents opportunities. But it does mean being more selectively aggressive while staying broadly diversified, especially given continued inflation uncertainty.
We discuss all this and more in the week’s Facts versus Feelings podcast. Take a listen!
8137870.1.-07.03.25A
For more content by Barry Gilbert, VP, Asset Allocation Strategist click here
