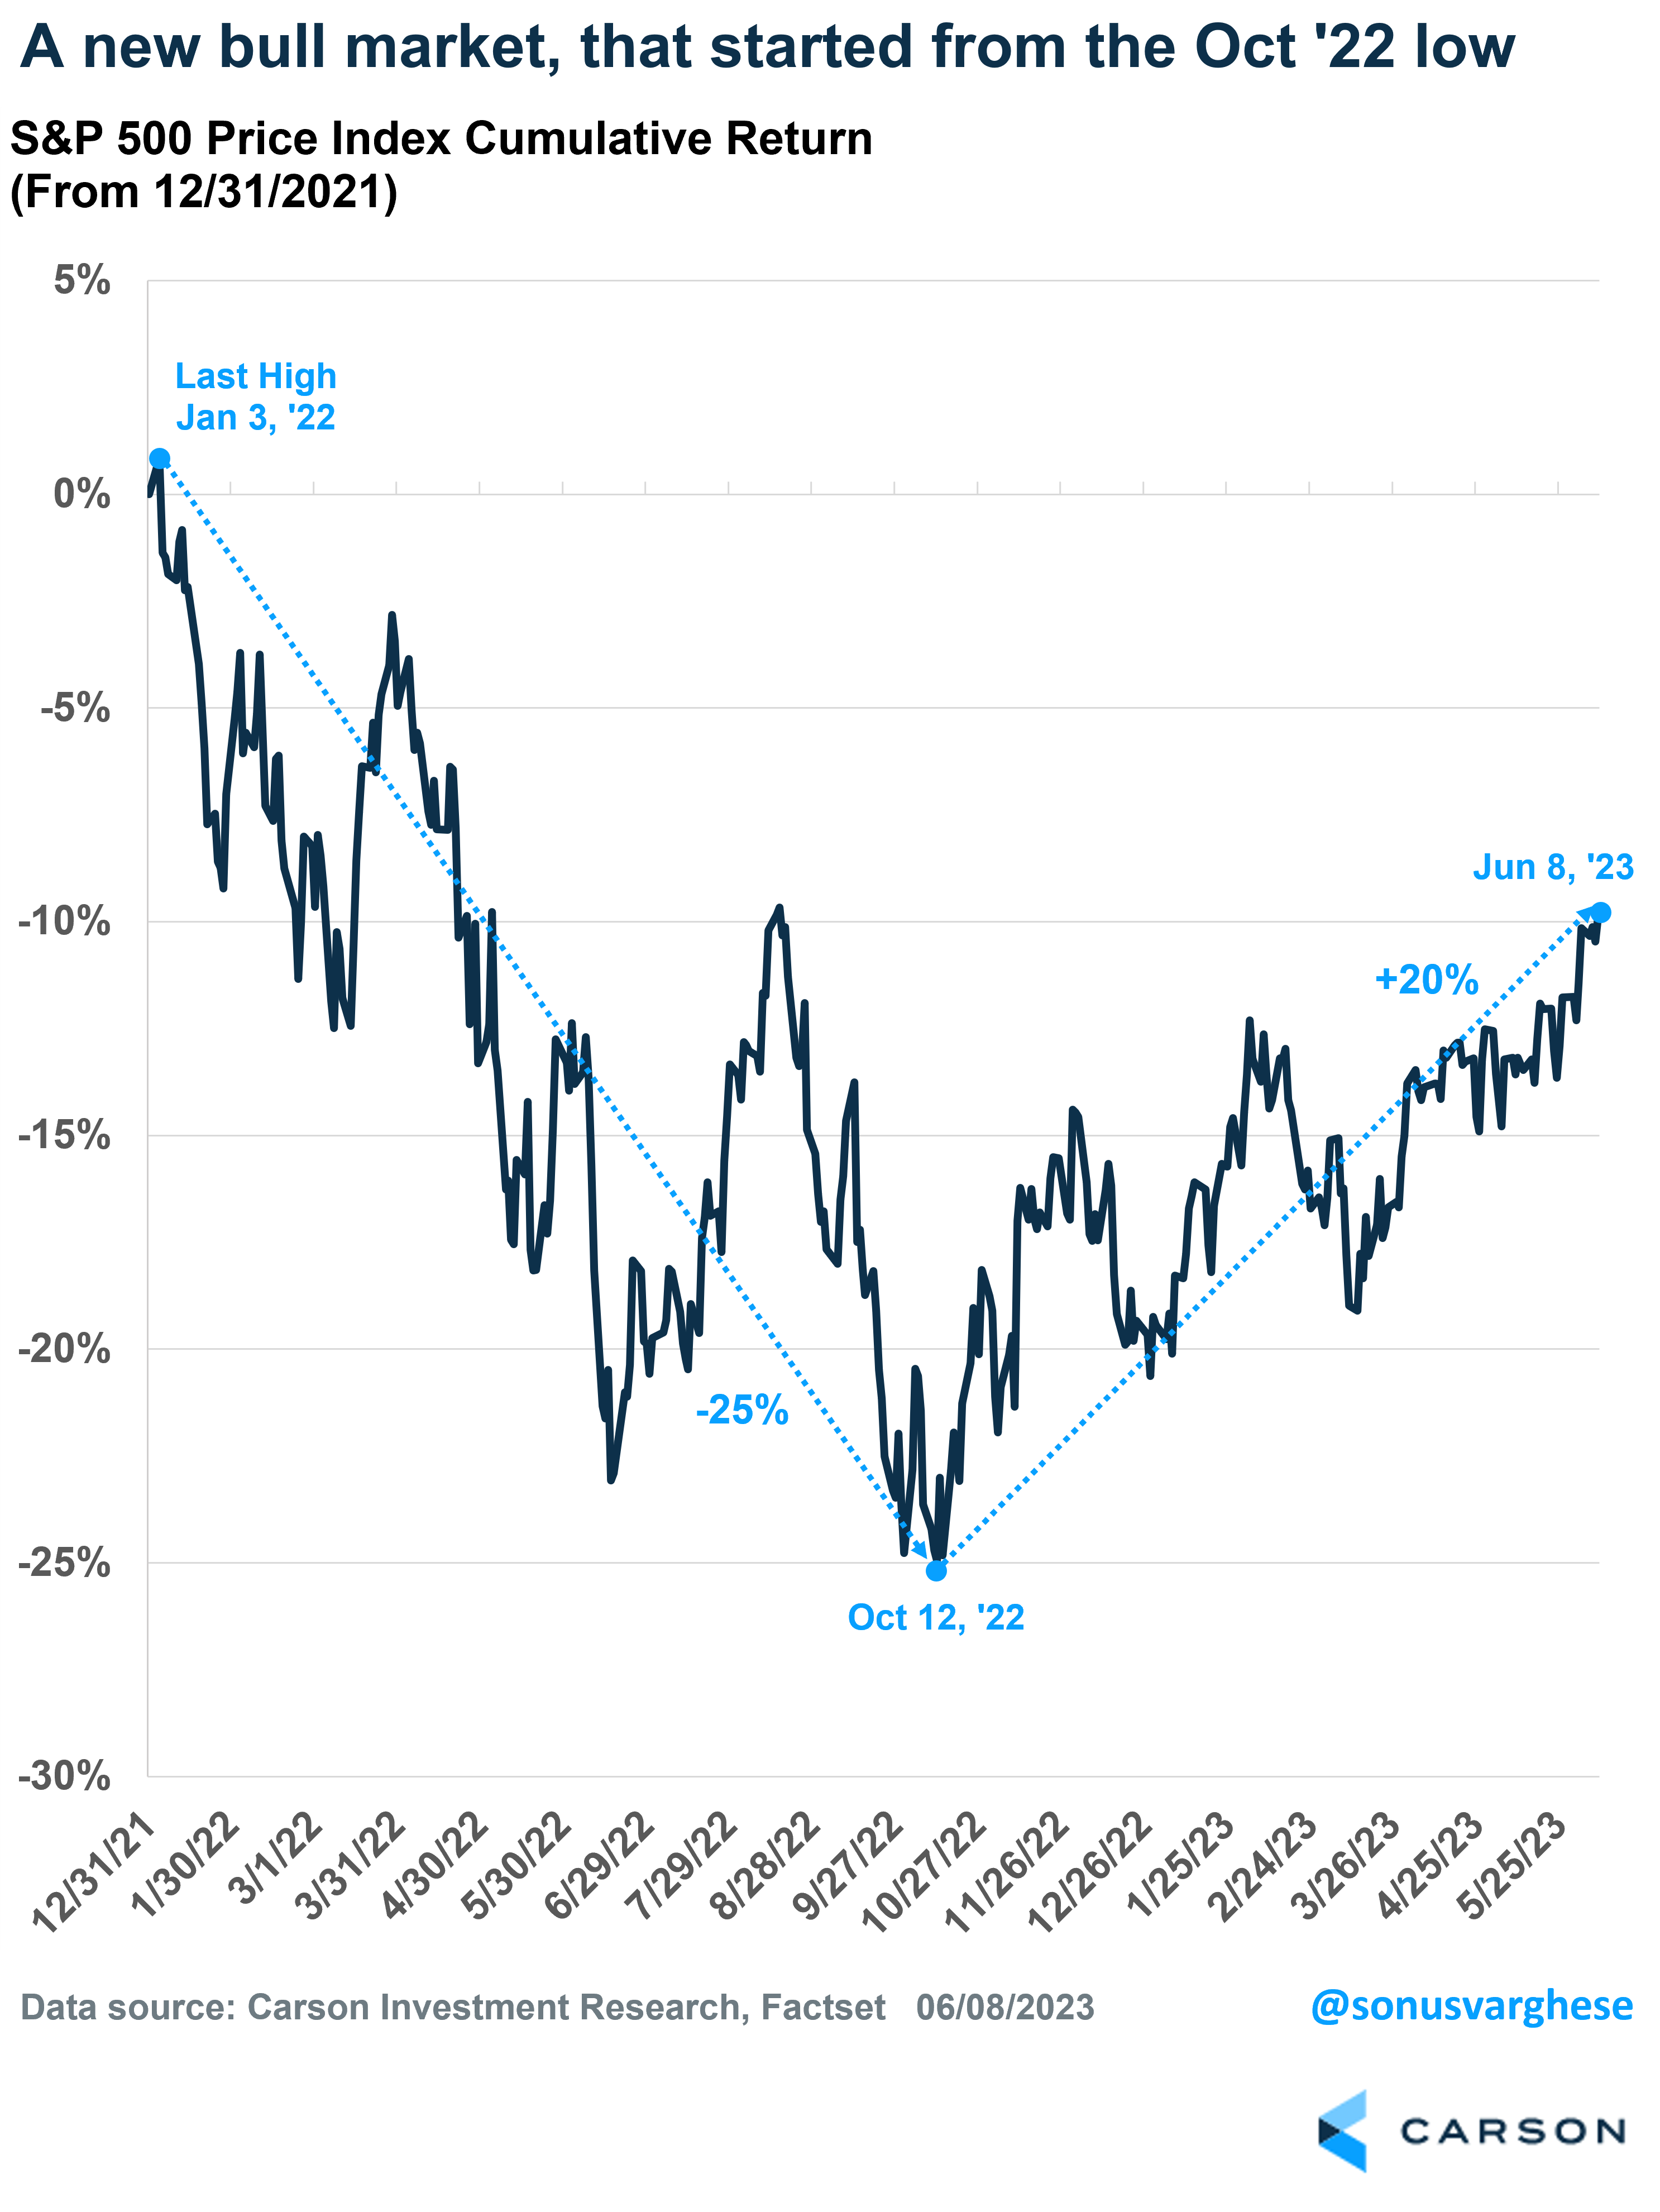
The S&P 500 finally closed 20% above its October 12th (2022) closing low. This puts the index in “official” bull market territory.
Of course, if you had been reading or listening to Ryan on our Facts vs Feelings podcast, you’d have heard him say that October 12th was the low. He actually wrote a piece titled “Why Stocks Likely Just Bottomed” on October 19th!
The S&P 500 Index fell 25% from its peak on January 3rd, 2022 through October 12th. The subsequent 20% gain still puts it 10% below the prior peak. This does get to “math of volatility”. The index would need to gain 33% from its low to regain that level. This is a reason why it’s always better to lose less, is because you need to gain less to get back to even.
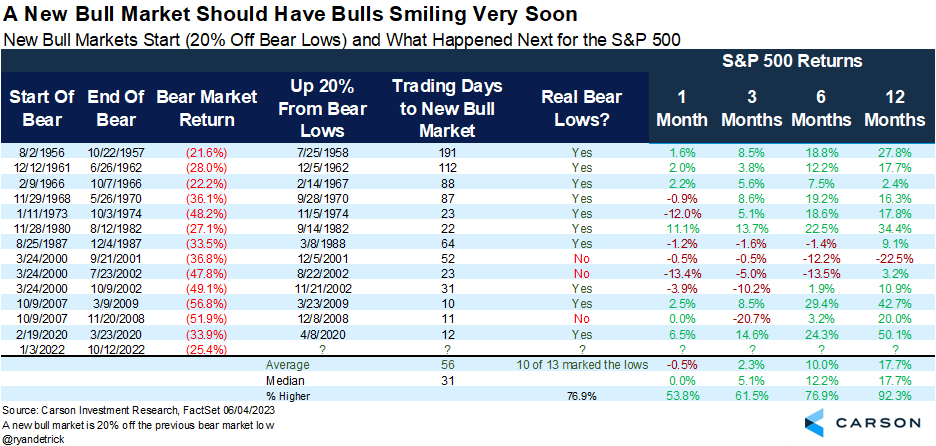
So, what’s next? The good news is that future returns are strong. In his latest piece, Ryan wrote that out of 13 times when stocks rose 20% off a 52-week low, 10 of those times the lows were not violated. The average return 12 months later was close to 18%. The only time we didn’t see a gain was in the 2001-2002 bear market.
Digging into the return drivers
It’s interesting to look at what’s been driving returns over the past year. This can help us think about what may lie ahead. The question was prompted by our friend, Sam Ro’s latest piece on the bull market breakout. He wrote that earnings haven’t been as bad as expected. More importantly, prospects have actually been improving.
Stay on Top of Market Trends
The Carson Investment Research newsletter offers up-to-date market news, analysis and insights. Subscribe today!
"*" indicates required fields
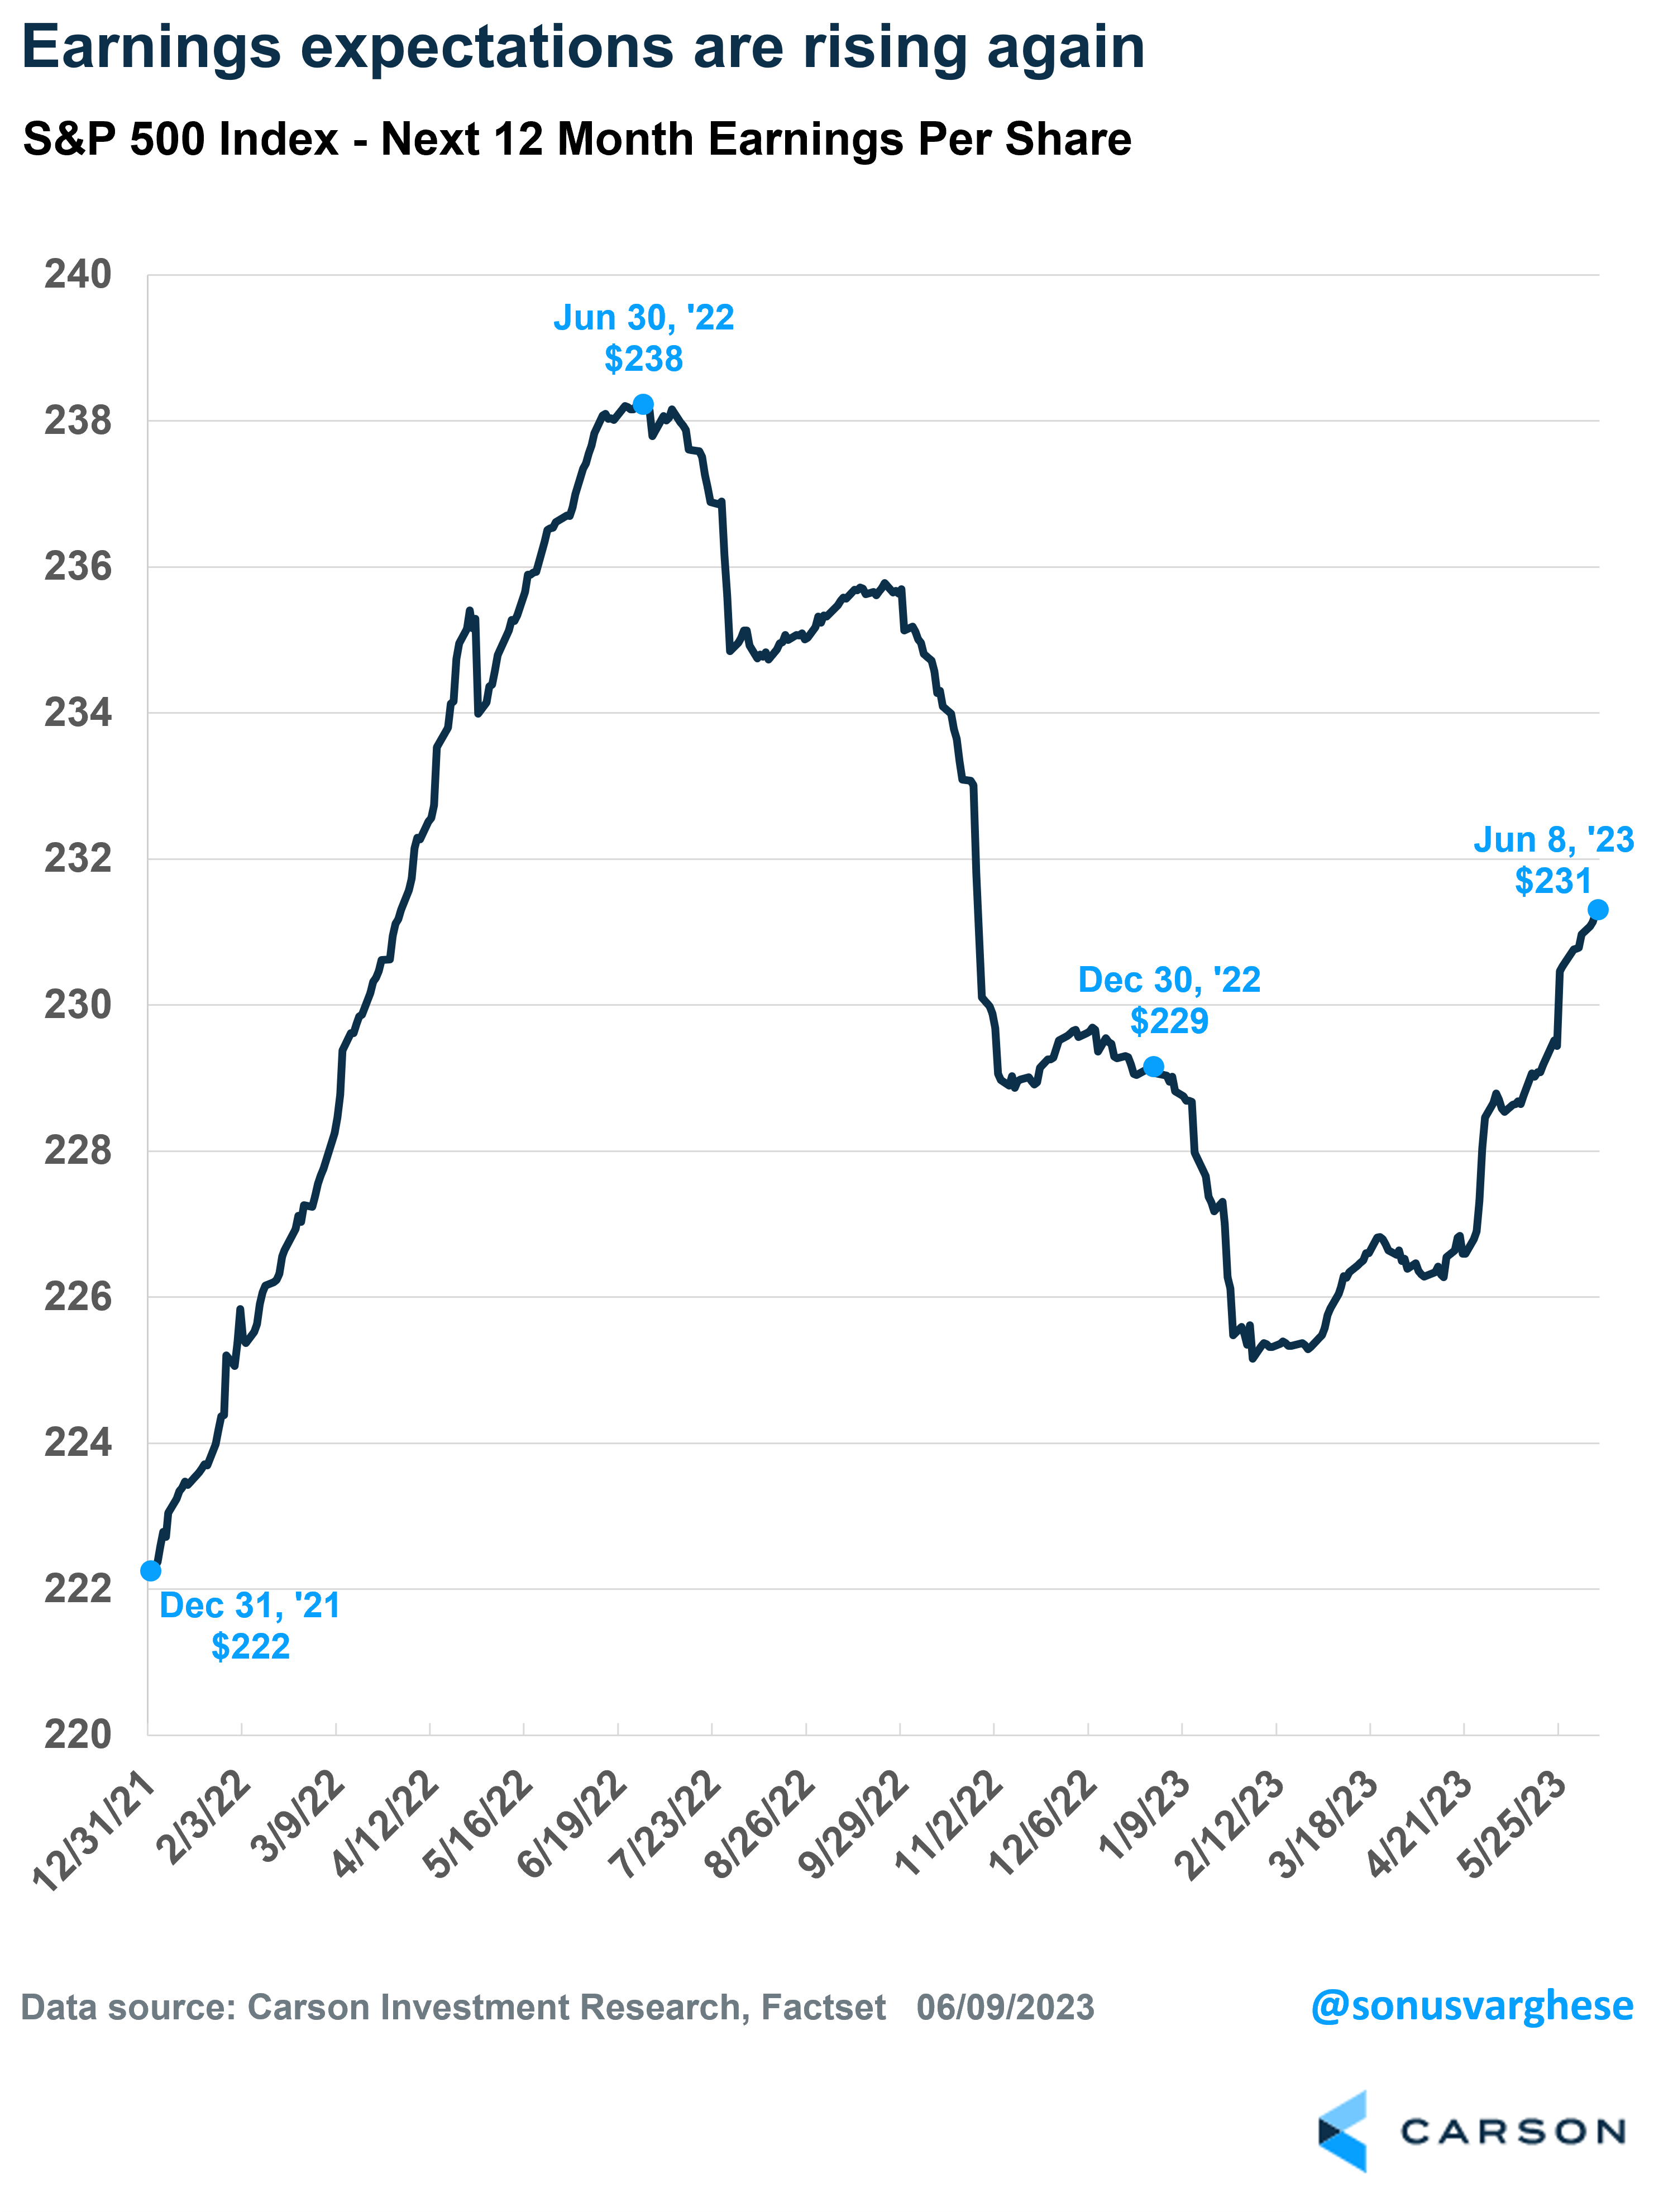
The chart below shows earnings expectations for the S&P 500 over the next 12 months. You can see how it rose in the first half of 2022, before collapsing over the second half of the year. The collapse continued into January of this year. But since then, earnings expectations have steadily risen. In fact, they’ve accelerated higher since mid-April, after the last earnings season started. Currently, they’re higher than where we started the year.
Backing up a bit: we can break apart the price return of a stock (or index) into two components:
- Earnings growth
- Valuation multiple growth
I decomposed annual S&P 500 returns from 2020 – 2023 (through June 8th) into these two components. The chart below shows how these added up to the total return for each year. It also includes:
- The bear market pullback from January 3rd, 2022, through October 12th, 2022
- And the 20% rally from the low through June 8th, 2023
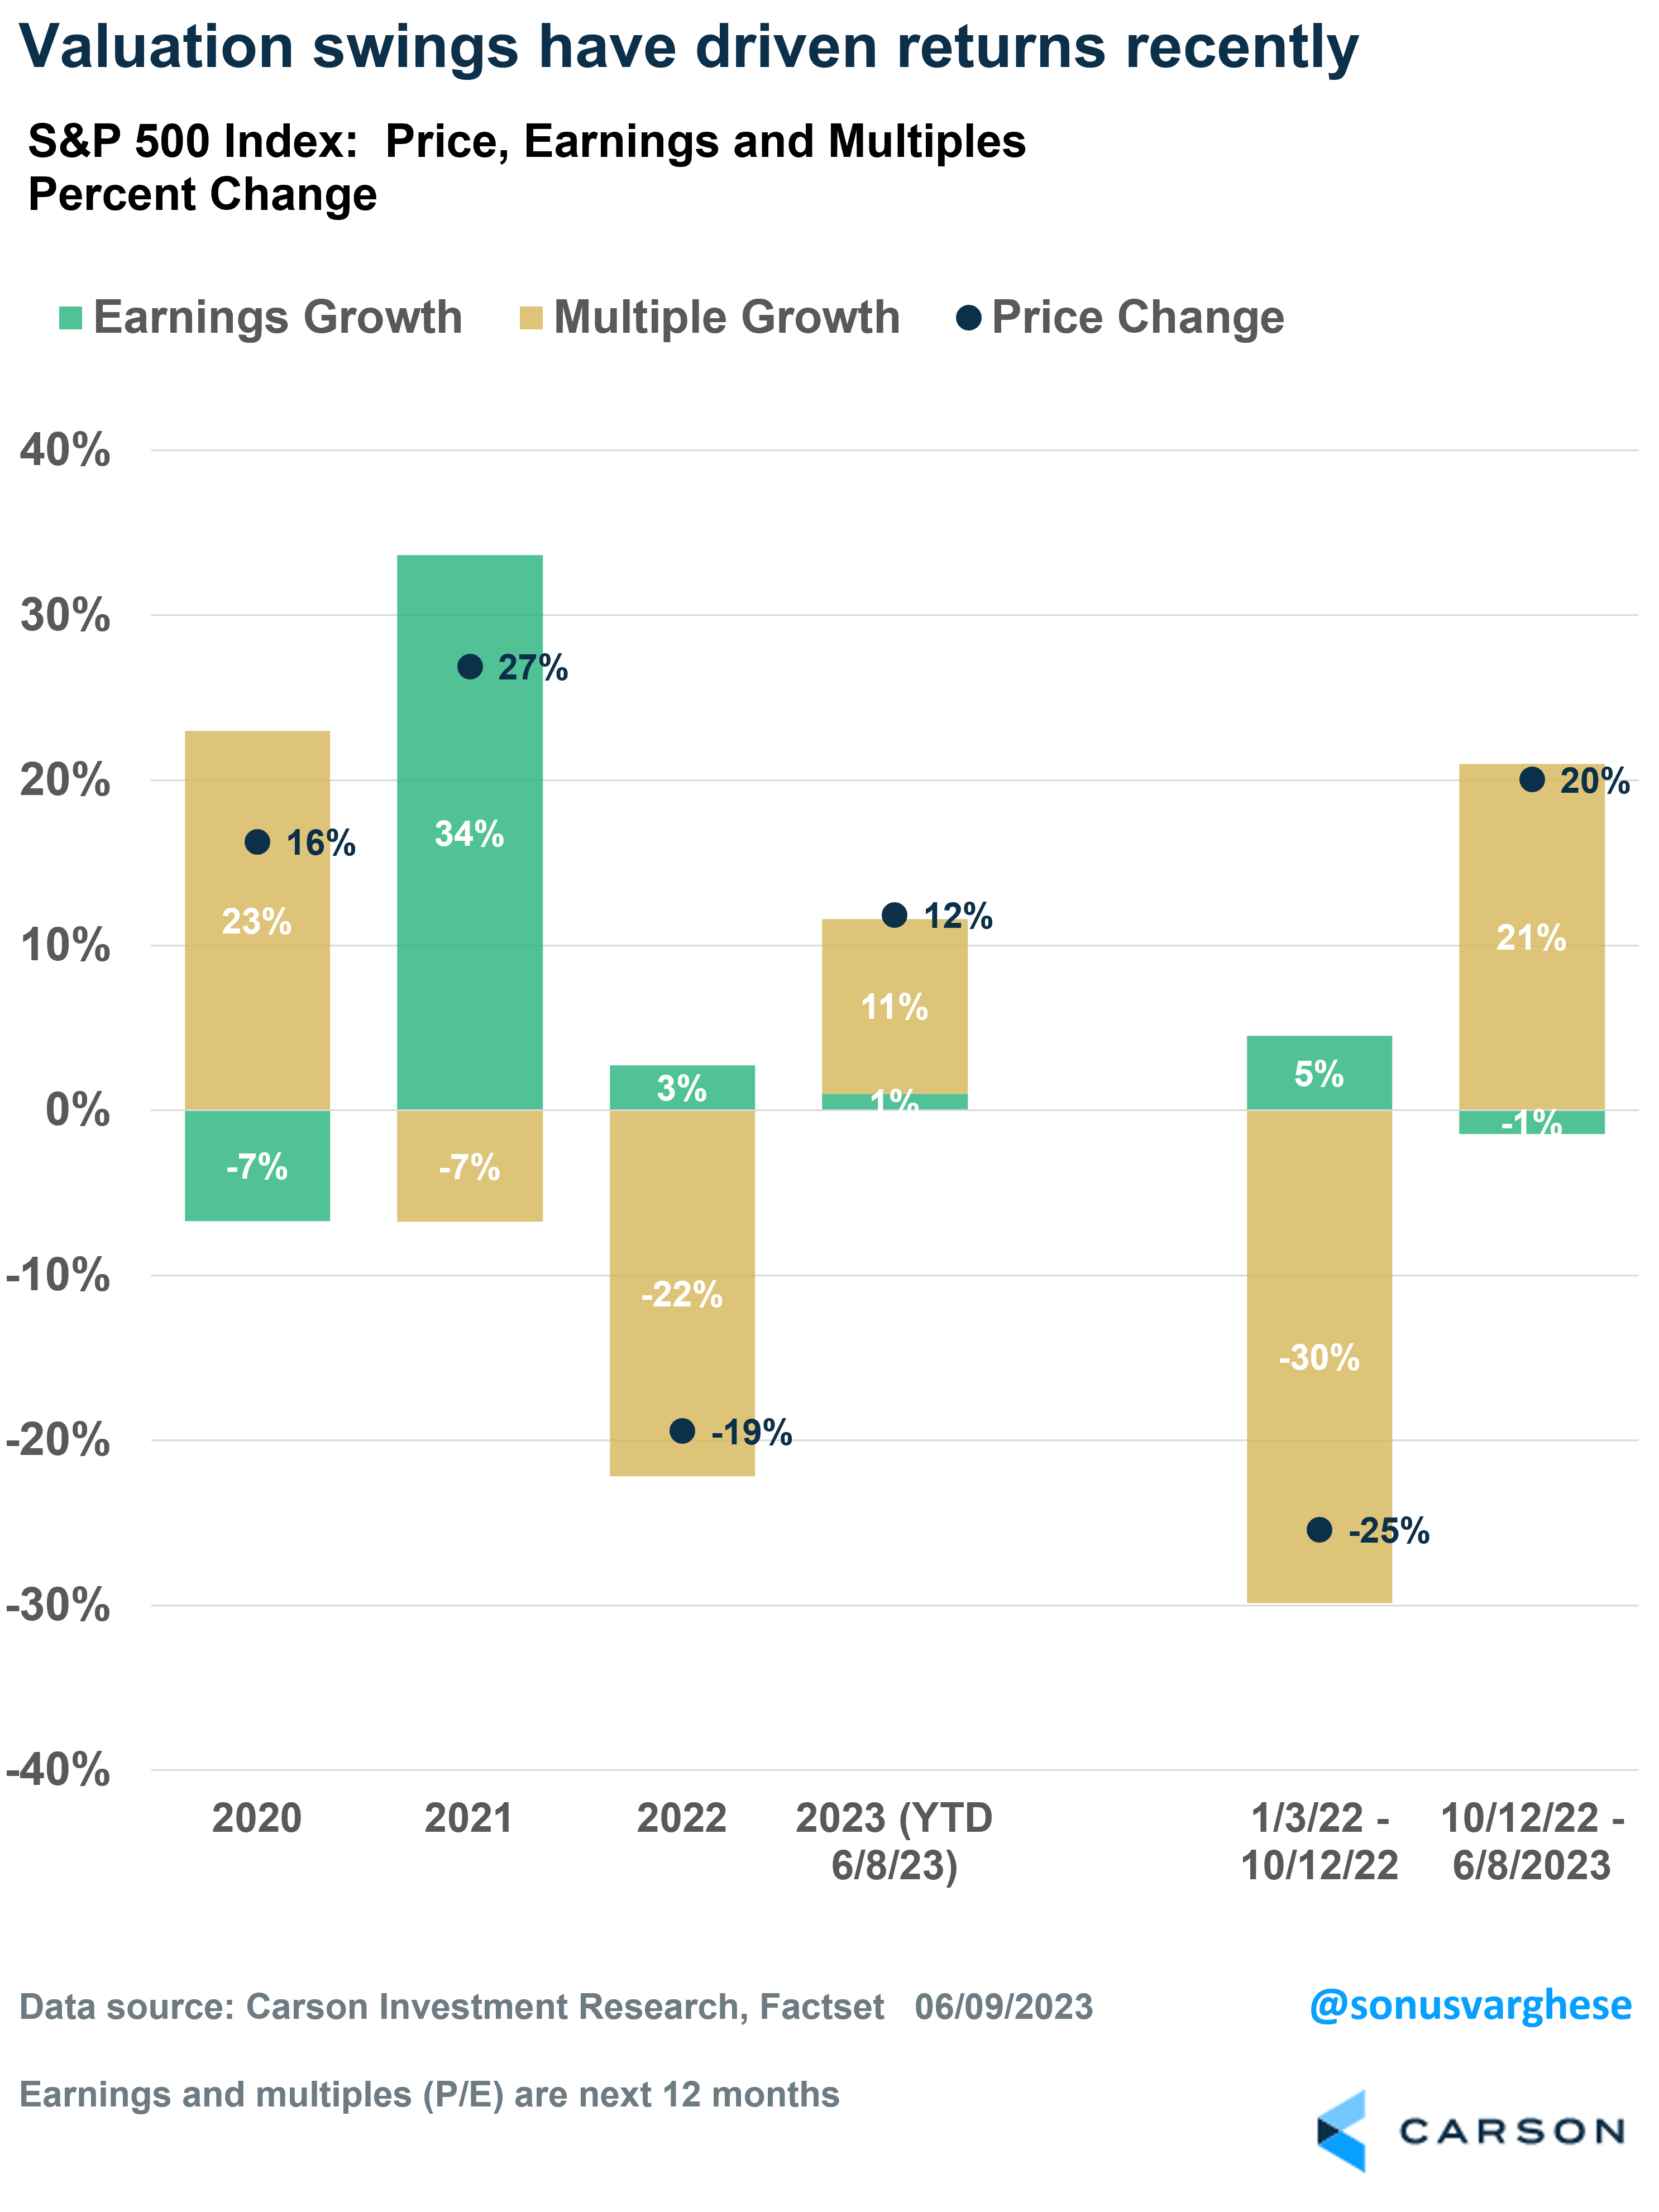
You can see how multiple changes have dominated the swing in returns.
The notable exception is 2021, when the S&P 500 return was propelled by earnings growth. In contrast, the 2022 pullback was entirely attributed to multiple contraction. Earnings made a positive contribution in 2022.
Now, multiple contraction is not surprising given the rapid change in rates, as the Federal Reserve (Fed) looked to get on top of inflation. However, they are close to the end of rate hikes, and so that’s no longer a big drag on multiples.
Consequently, multiple growth has pulled the index higher this year. You can see how multiple contraction basically drove the pullback in the Index during the bear market, through the low. But since then, multiples have expanded, pretty much driving the 20% gain.
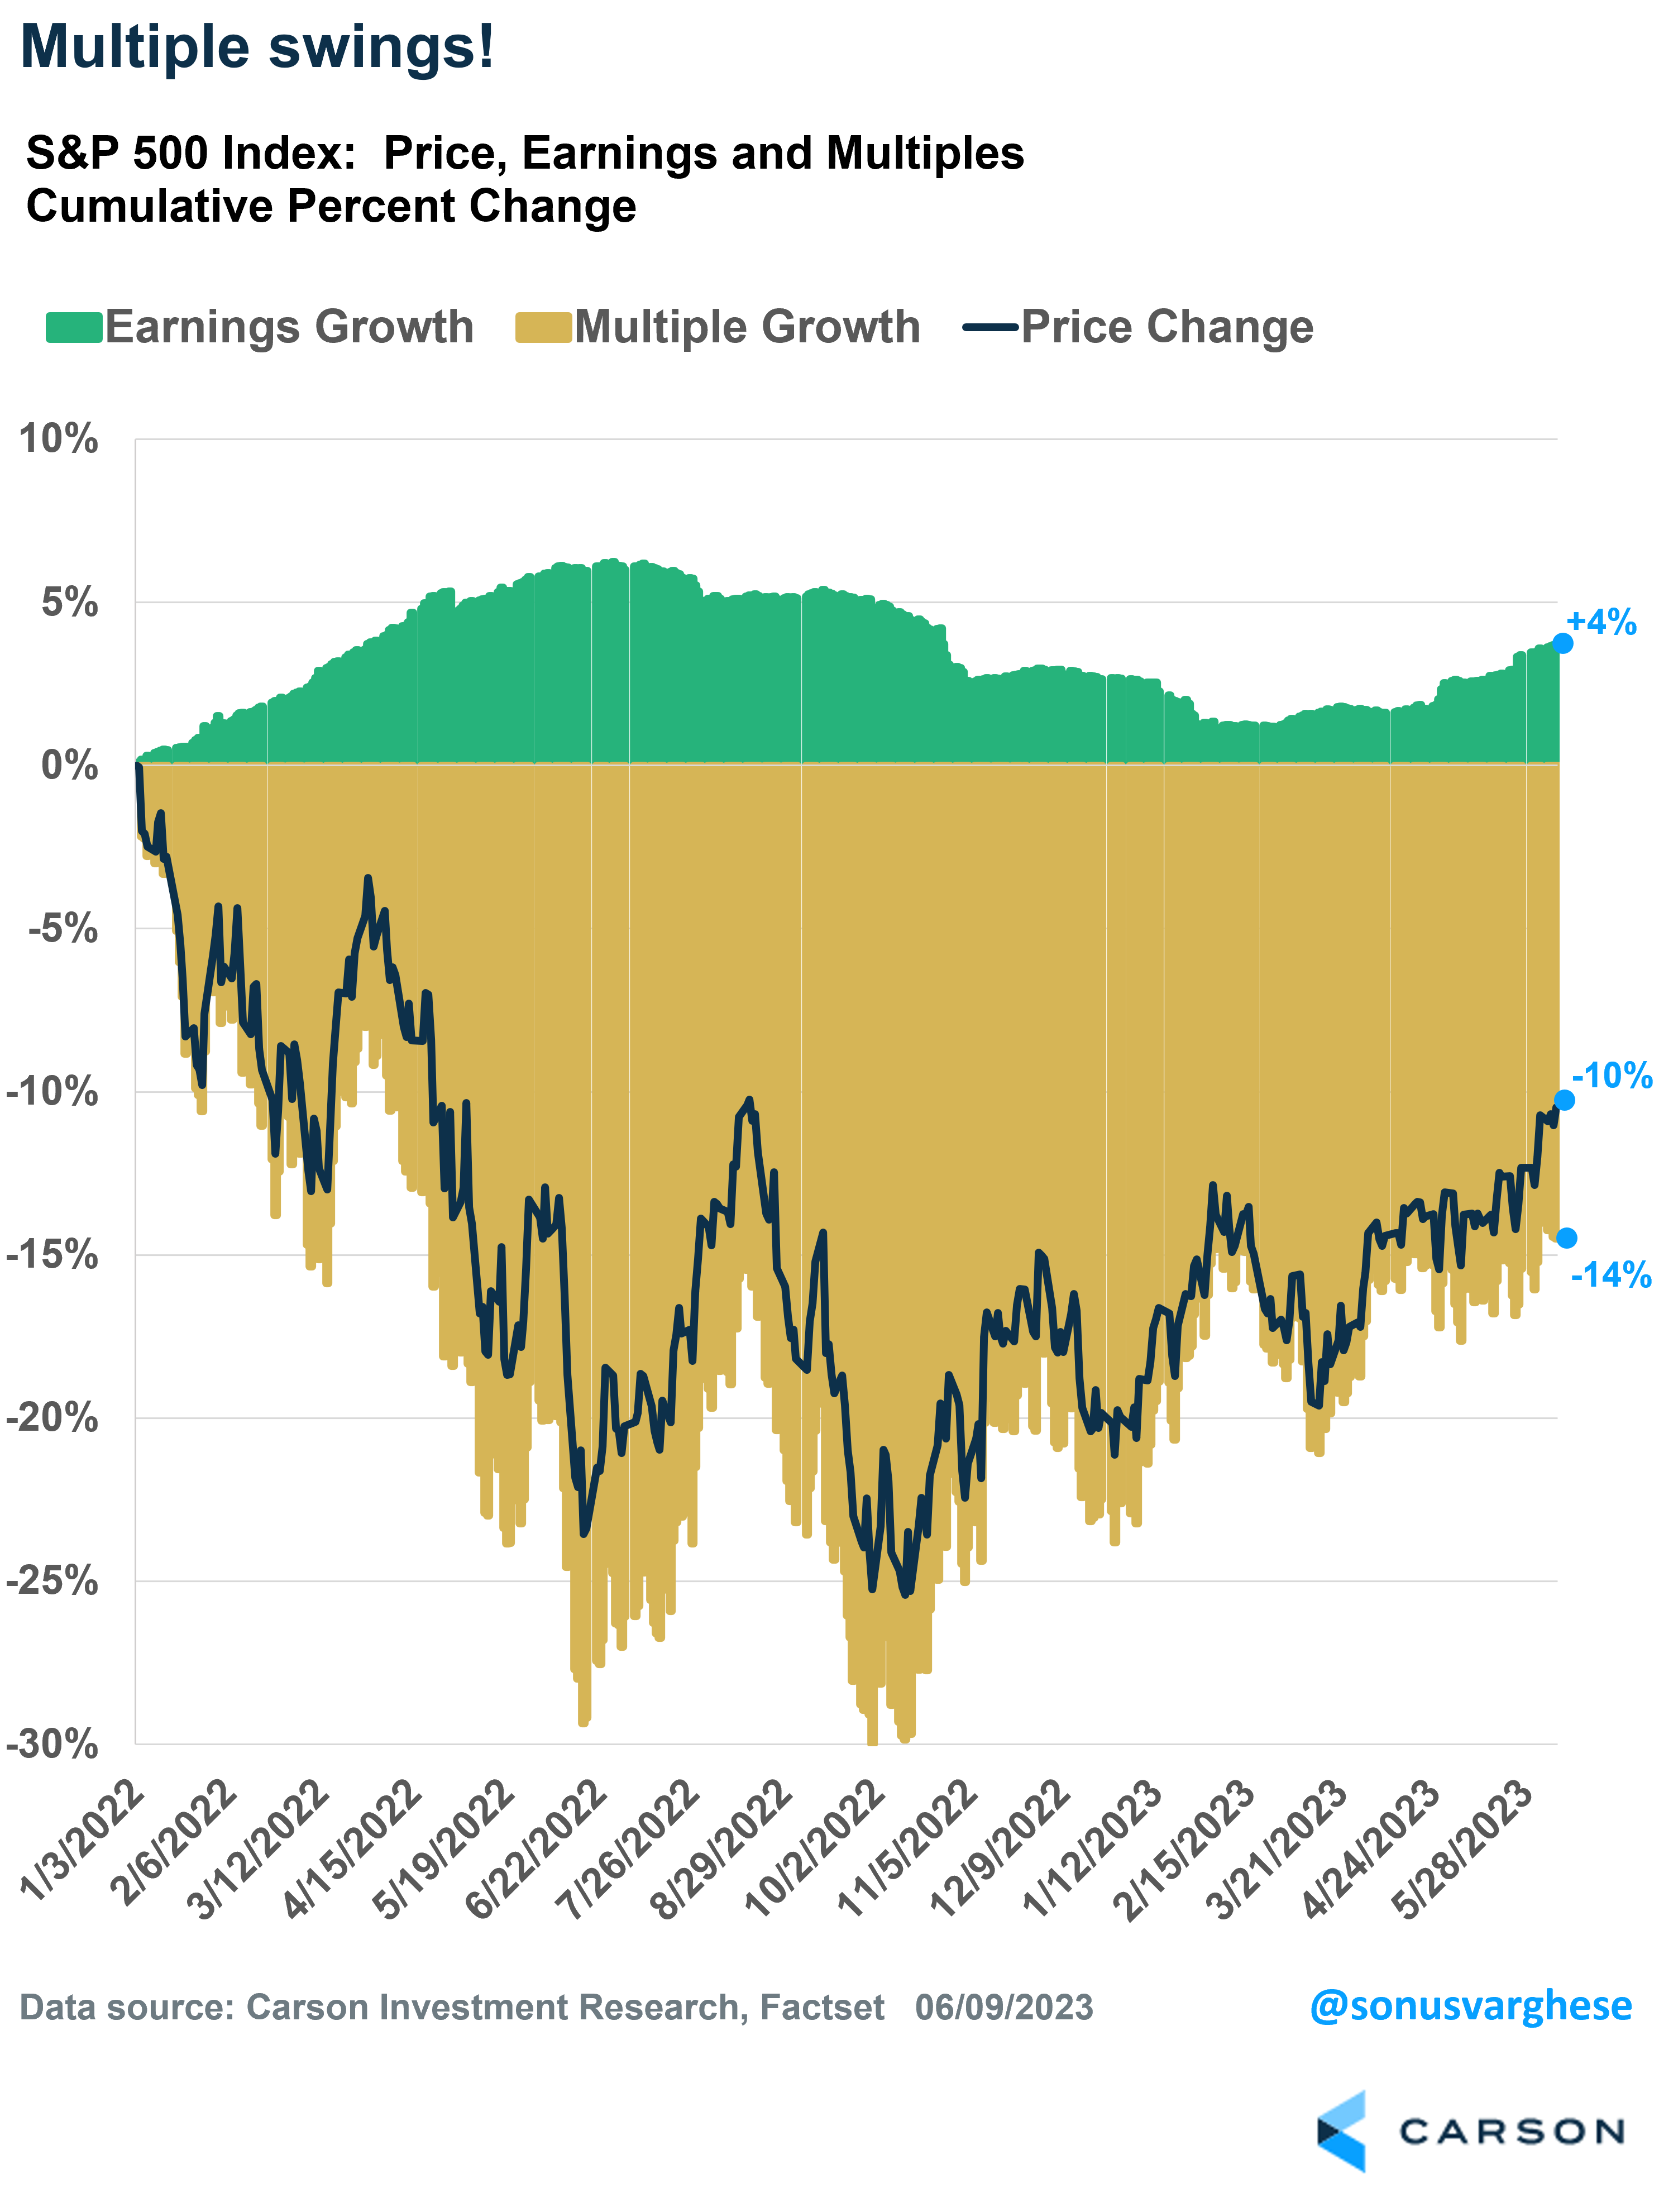
Here’s a more dynamic picture of the S&P 500’s cumulative price return action from January 3rd, 2022, through June 8th, 2023. The chart also shows the contribution from earnings and multiple growth. As you can see, earnings have been fairly steady, rising 4% over the entire period. However, the swing in multiples is what drove the price return volatility.
Multiples contracted by 14%, and when combined with 4% earnings growth, you experienced the index return of -10%.
What next?
As I pointed out above, the problem for stocks last year was multiple contraction, which was driven by a rapid surge in interest rates.
The good news is that we’re probably close to end of rate hikes. The Fed may go ahead with just one more rate hike (in July), which is not much within the context of the 5%-point increase in rates that they implemented over the past year.
Our view is that rates are likely to remain where they are for a while. But rates are unlikely to rise from 5% to 10%, or even 7%, unless we get another major inflation shock.
This means a major obstacle that hindered stocks last year is dissipating. The removal of this headwind is yet another positive factor for stocks as we look ahead into the second half of the year.
