
“Smart people focus on the right things.” — Jensen Huang, Nvidia’s CEO and Co-Founder
First things first, thank you to all the Veterans out there for all you’ve done for our great country. You all have sacrificed so much to keep the rest of us safe, and we thank you.
The week of November 2 started off calmly enough, then stocks staged a big rally on Wednesday, November 4, after the midterm elections, with the Democrats taking over both the House and Senate and doing much better than expected. The initial pop was likely relief that the election was simply over and we could move on, not to mention that historically stocks have done well once midterms were out of the way.
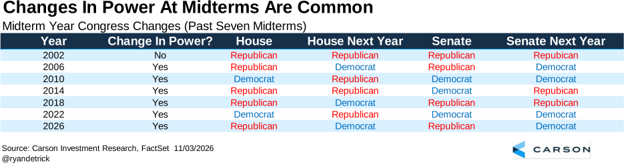
Let’s be clear that changes in power in Congress are quite common, as this is now the sixth midterm in a row to see a change in power. It was the size of the Blue Wave that likely caught the market off guard, which brings us to Thursday.
Then Came a Red Wave of Selling
Like clockwork, at 10 am ET on Thursday, November 5, massive selling started, and it ended as one of the worst days we’ve seen in years, down a whopping 4.4%. I was on a plane and saw things open about flat, and when I landed, the S&P 500 was down like 2.5%, and I honestly thought it was a mistake. Boy, it wasn’t.
Although all major sectors were lower that day, most of the selling was in technology, as the group fell 8% and semiconductors fell 12% for their second-worst day ever (only March 2020 was worse). Rumors of forced selling and funds going under dominated the conversation, but the bottom line was a red wave of selling.
What sparked it? The realization that voters nearly unanimously rejected building more datacenters was front and center. According to CBS, 44 of 45 ballot measures that placed some kind of limit on datacenters at the state or local level passed. Ohio alone had 21 datacenter ballot measures, and every single one was approved by voters. As we discuss below, AI and datacenter construction have been major drivers of economic growth and, in turn, markets over the past two years, and whether justified or not, the voter reaction led to a sell-first-and-ask-questions-later mentality among investors.
The Toll We Pay To Invest
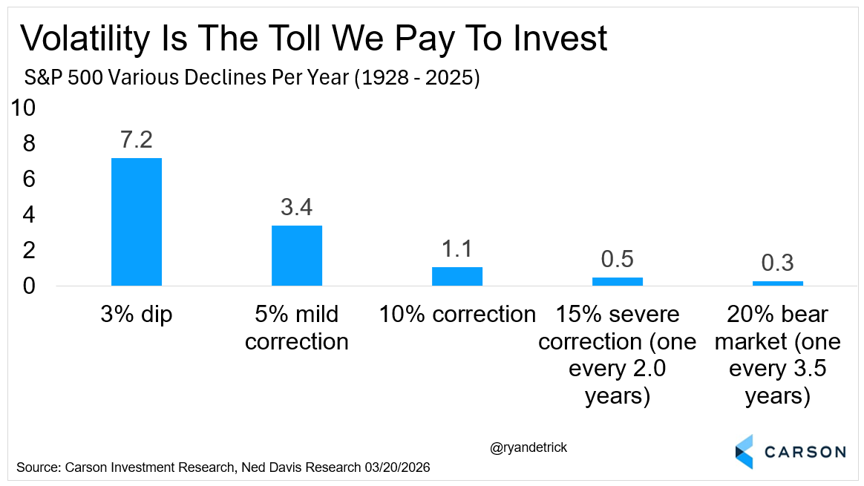
After Wednesday’s big rally, the S&P 500 was about 1.5% away from a new high, and the S&P 500 equal-weight index closed at an all-time high. Things looked pretty good, and then the volatility happened. Long-time readers know we like to say that volatility is the toll we pay to invest, and we all paid that toll on Thursday.
This is only the second 5% mild pullback of the year, which really puts in context how things have gone this year. We had the 9.1% correction in February and March around the start of the Iran war, then a historic jump in April and May, only to be followed by a very boring market. In fact, from the end of May until the end of October, the S&P 500 was basically flat, and the three months going into November traded in only a 3.5% range, one of the tightest three-month ranges in history.

Stay on Top of Market Trends
The Carson Investment Research newsletter offers up-to-date market news, analysis and insights. Subscribe today!
"*" indicates required fields
You could argue we were due for some volatility, and it sure happened. There’s an old saying: “the stock market takes an escalator up and an elevator down,” and it played out in a big way here. Below is a chart we’ve shared for years, and we wanted to share it again after last week. Each year has volatility and scary headlines, so 2026 wasn’t going to be any different. On average, the S&P 500 has more than three separate 5% mild pullbacks and one 10% correction a year, with a bear market occurring every 3.5 years. In order to benefit from the incredible long-term gains the stock market provides, we have to pay the toll of experiencing all the ups and downs.
In a Bear Market, Trouble Historically Starts Fast
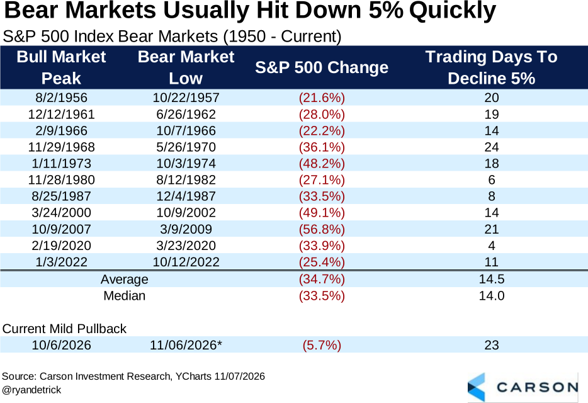
The last all-time high for the S&P 500 was on October 6, and it officially moved into a 5% mild correction on Thursday, 23 trading days from an all-time high to down 5%. In late March, which also saw a slow initial 5% correction, we noted this as a reason not to expect a bear market (which proved correct), and we are sharing it again. Looking at previous bear markets, you tend to see that the initial 5% decline happens quickly. If it takes a long time to be down 5%, then the odds of moving into a bear market are slim.
Only one bear market took longer than the current decline to drop 5%, and that was the 34% bear market of the late ’60s and early ’70s, at 24 days. The average was 14.5 days to be down 5%, and this could be a clue that although this volatility isn’t fun, going into a bear market from here isn’t likely. Shout-out to our friend Sam Stovall, CFRA’s U.S. Equity Strategist, for this idea, which he’s shared for years.
Bad Before Good
As bad as Thursday was, Monday saw a huge jump, with the S&P 500 up 2.4% and the Nasdaq having its best day of the year. Market breadth was incredible also, with 420 names in the S&P 500 advancing, the best day in nearly a year.
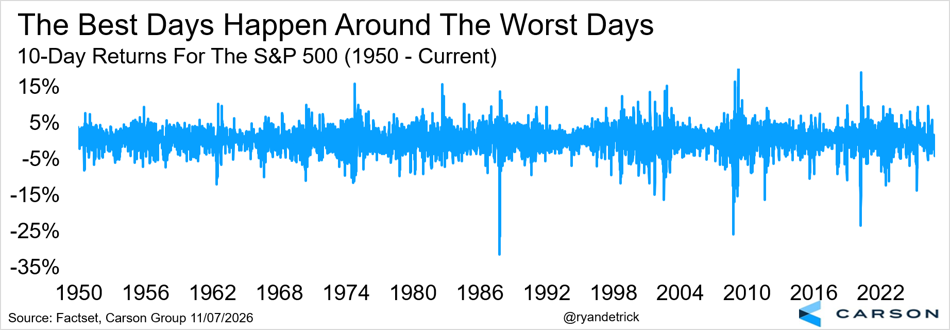
Here’s the thing (and another chart we’ve shared many times): the best days and worst days tend to happen near each other. If you sell after a few bad days, you’ll likely miss the good days that follow. This is all about timeframes, of course, and we are really talking to longer-term investors here. I’ve seen so many investors sell longer-term positions on normal volatility, and they usually regret it six months later.
We shared this same chart after the 10% crash in two days around Liberation Day, and we subsequently saw one of the greatest near-term rallies ever after that. Think of this the next time you want to sell after some bad days.
The Green Wave
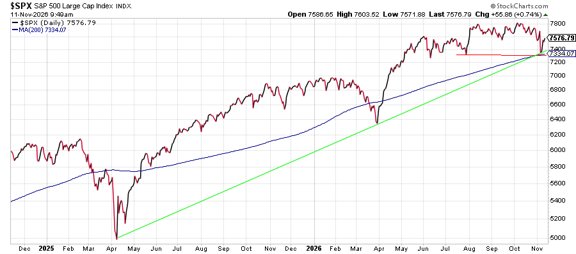
Speaking of Monday’s big move, the S&P 500 is finding support near a logical level. As you can see in the chart below, this is near the upward-sloping 200-day moving average, the summer lows, and a trendline going back to Liberation Day. Bottom line, this is still quite constructive, and a break below these areas would signal a clear warning. We aren’t there yet.
Average Isn’t So Average
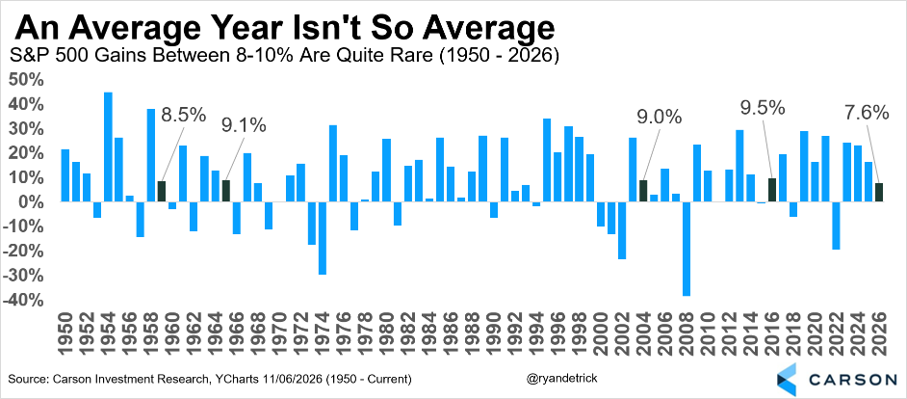
Another one we’ve shared and discussed for years is that average returns aren’t so average when it comes to investing. The average year gains around 9%, but did you know that in only four of the past 76 years did the S&P 500 gain between 8-10%? That tells us a few things, but mainly that bigger yearly changes (up or down) are perfectly normal.
Which brings us to this year, with the S&P 500 up 7.6% as of Friday’s close. Yes, we’ve bounced a good deal since then, but this is right in the range of ‘about average,’ and you have to ask yourself, will the market really stay right here to the end of the year? We’d say no; history says that isn’t the play. That means it has to go either higher or lower from here, and we still think the move is a solid rally into year-end.
More On Midterms
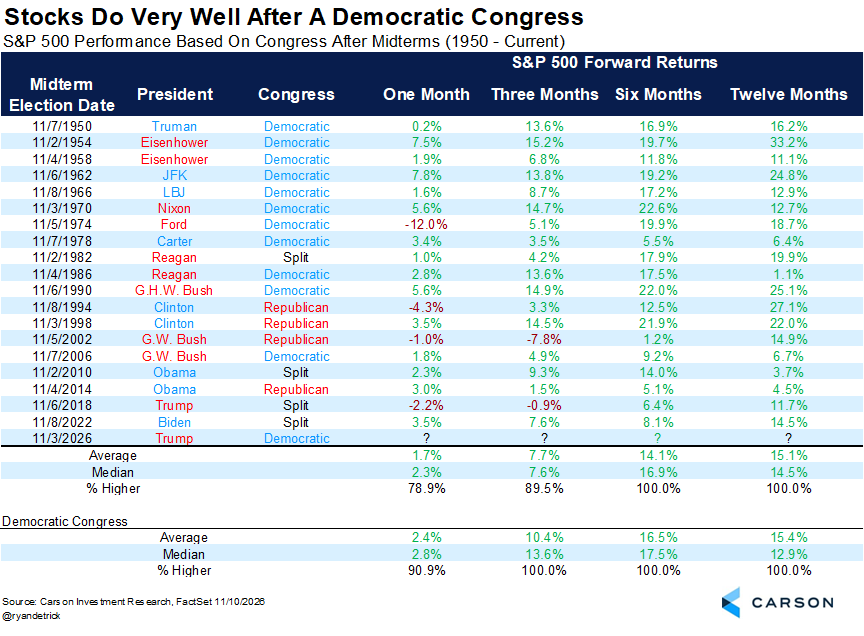
We will end this blog with a little more on midterms. We know emotions are running high, and confusion over AI spending and building is foggy at best, but let’s leave on this potentially positive note. Looking back at the past 19 midterm elections, the S&P 500 was higher six months out every time, up a very impressive 14.1% and 16.0% median. One year out, it is higher every time as well, but we’ve talked about that already.
We then looked at how Congress shaped up after the election and found that the Democrats controlled Congress 11 times. Well, we know all 11 were higher six months later, but it is worth noting the average return actually jumped to 16.5%, with a median of 17.5%.
I tossed a lot into this one, but with everything happening, it is important to show many different angles and views of how we see the world. Yes, we didn’t expect that crash last Thursday, but we remain optimistic that a strong year-end rally (and more new highs) is likely. I was in the studio on CNBC’s Morning Call last Friday to discuss many of these concepts, and my friend Dan Ives, Partner at Yorkville Ives, joined me as well. As always, thanks for reading!
For more content by Ryan Detrick, Chief Market Strategist, click here.
9233498.1. – 11NOV26A