Welcome to Carson Investment Research’s Earnings Check-In. This series is built weekly from FactSet’s Earnings Insight report (John Butters, VP, Senior Earnings Analyst with FactSet), with index weights and market caps sourced from YCharts, and aggregation performed in-house. We tie every figure to FactSet’s published numbers, then add Carson’s perspective on top of that. We publish our Earnings Check-In weekly during earnings season.
This week’s numbers have me scratching my head. S&P 500 companies just put up one of their best earnings quarters in years, and investors responded by paying less for them. The forward P/E, which is the price investors pay for each dollar of expected earnings over the next year, fell to 17.7, the lowest since November 2023, according to FactSet. My first instinct was to call that a potential buying opportunity. A little buy-low, sell-high action! However, the more I dug into why the market got cheaper, the more I think investors are pricing these profits like a peak. I lean toward thinking they just might be right.
In Following the Money, I said that if the chip sellers kept raising their outlooks while the big AI buyers kept burning cash, I’d give the analysts the better read. The sellers held up their end. Super Micro’s fourth-quarter estimate jumped 62% in a month, the biggest increase in the S&P 500, and Technology companies giving Q4 guidance are 28 positive to 9 negative. By my own test, the analysts won this round. The strange part is, the market sold anyway, so I’m updating my map with a new question: why investors won’t pay for earnings that, on the surface, look spectacular?
Where the Season Stands
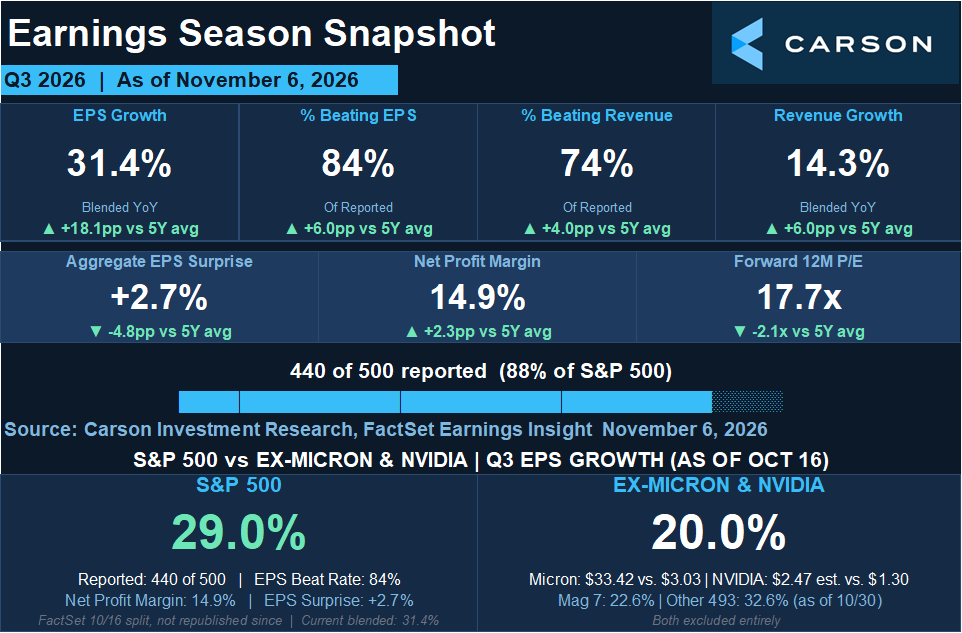
88% of S&P 500 companies have reported, and blended earnings growth rose to 31.4% from 30.1% last week (FactSet nudged last week’s figure down a tenth). 84% of companies beat estimates, above the 5-year average of 78%, but the average beat was only 2.7%, which is the smallest since late 2022. Revenue is growing 14.3%, and profit margins are still near record highs.
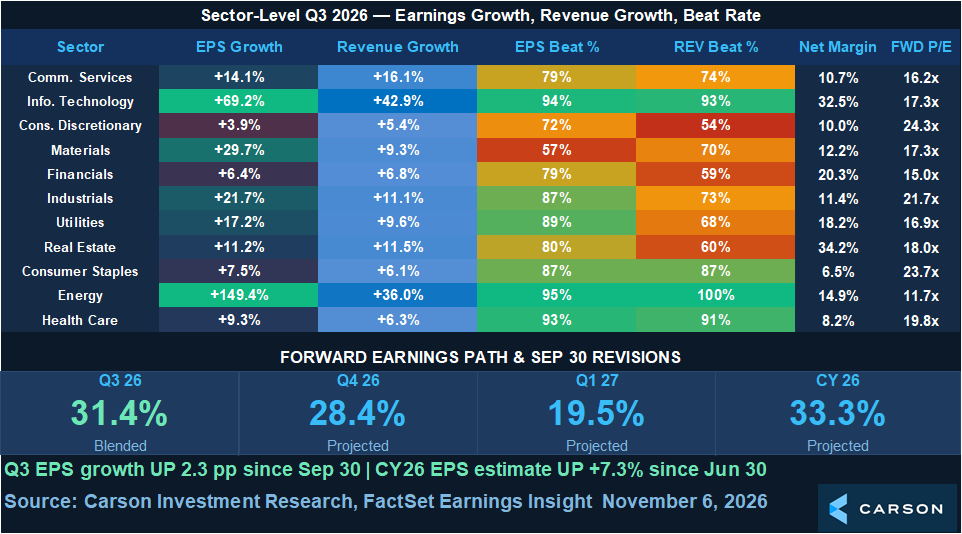
Energy and Technology are still carrying the quarter. Communication Services slipped to 14.1% from 20.3%, which is the only sector growing slower than analysts expected at the end of September.
The P/E Fell for a Good Reason, Until September
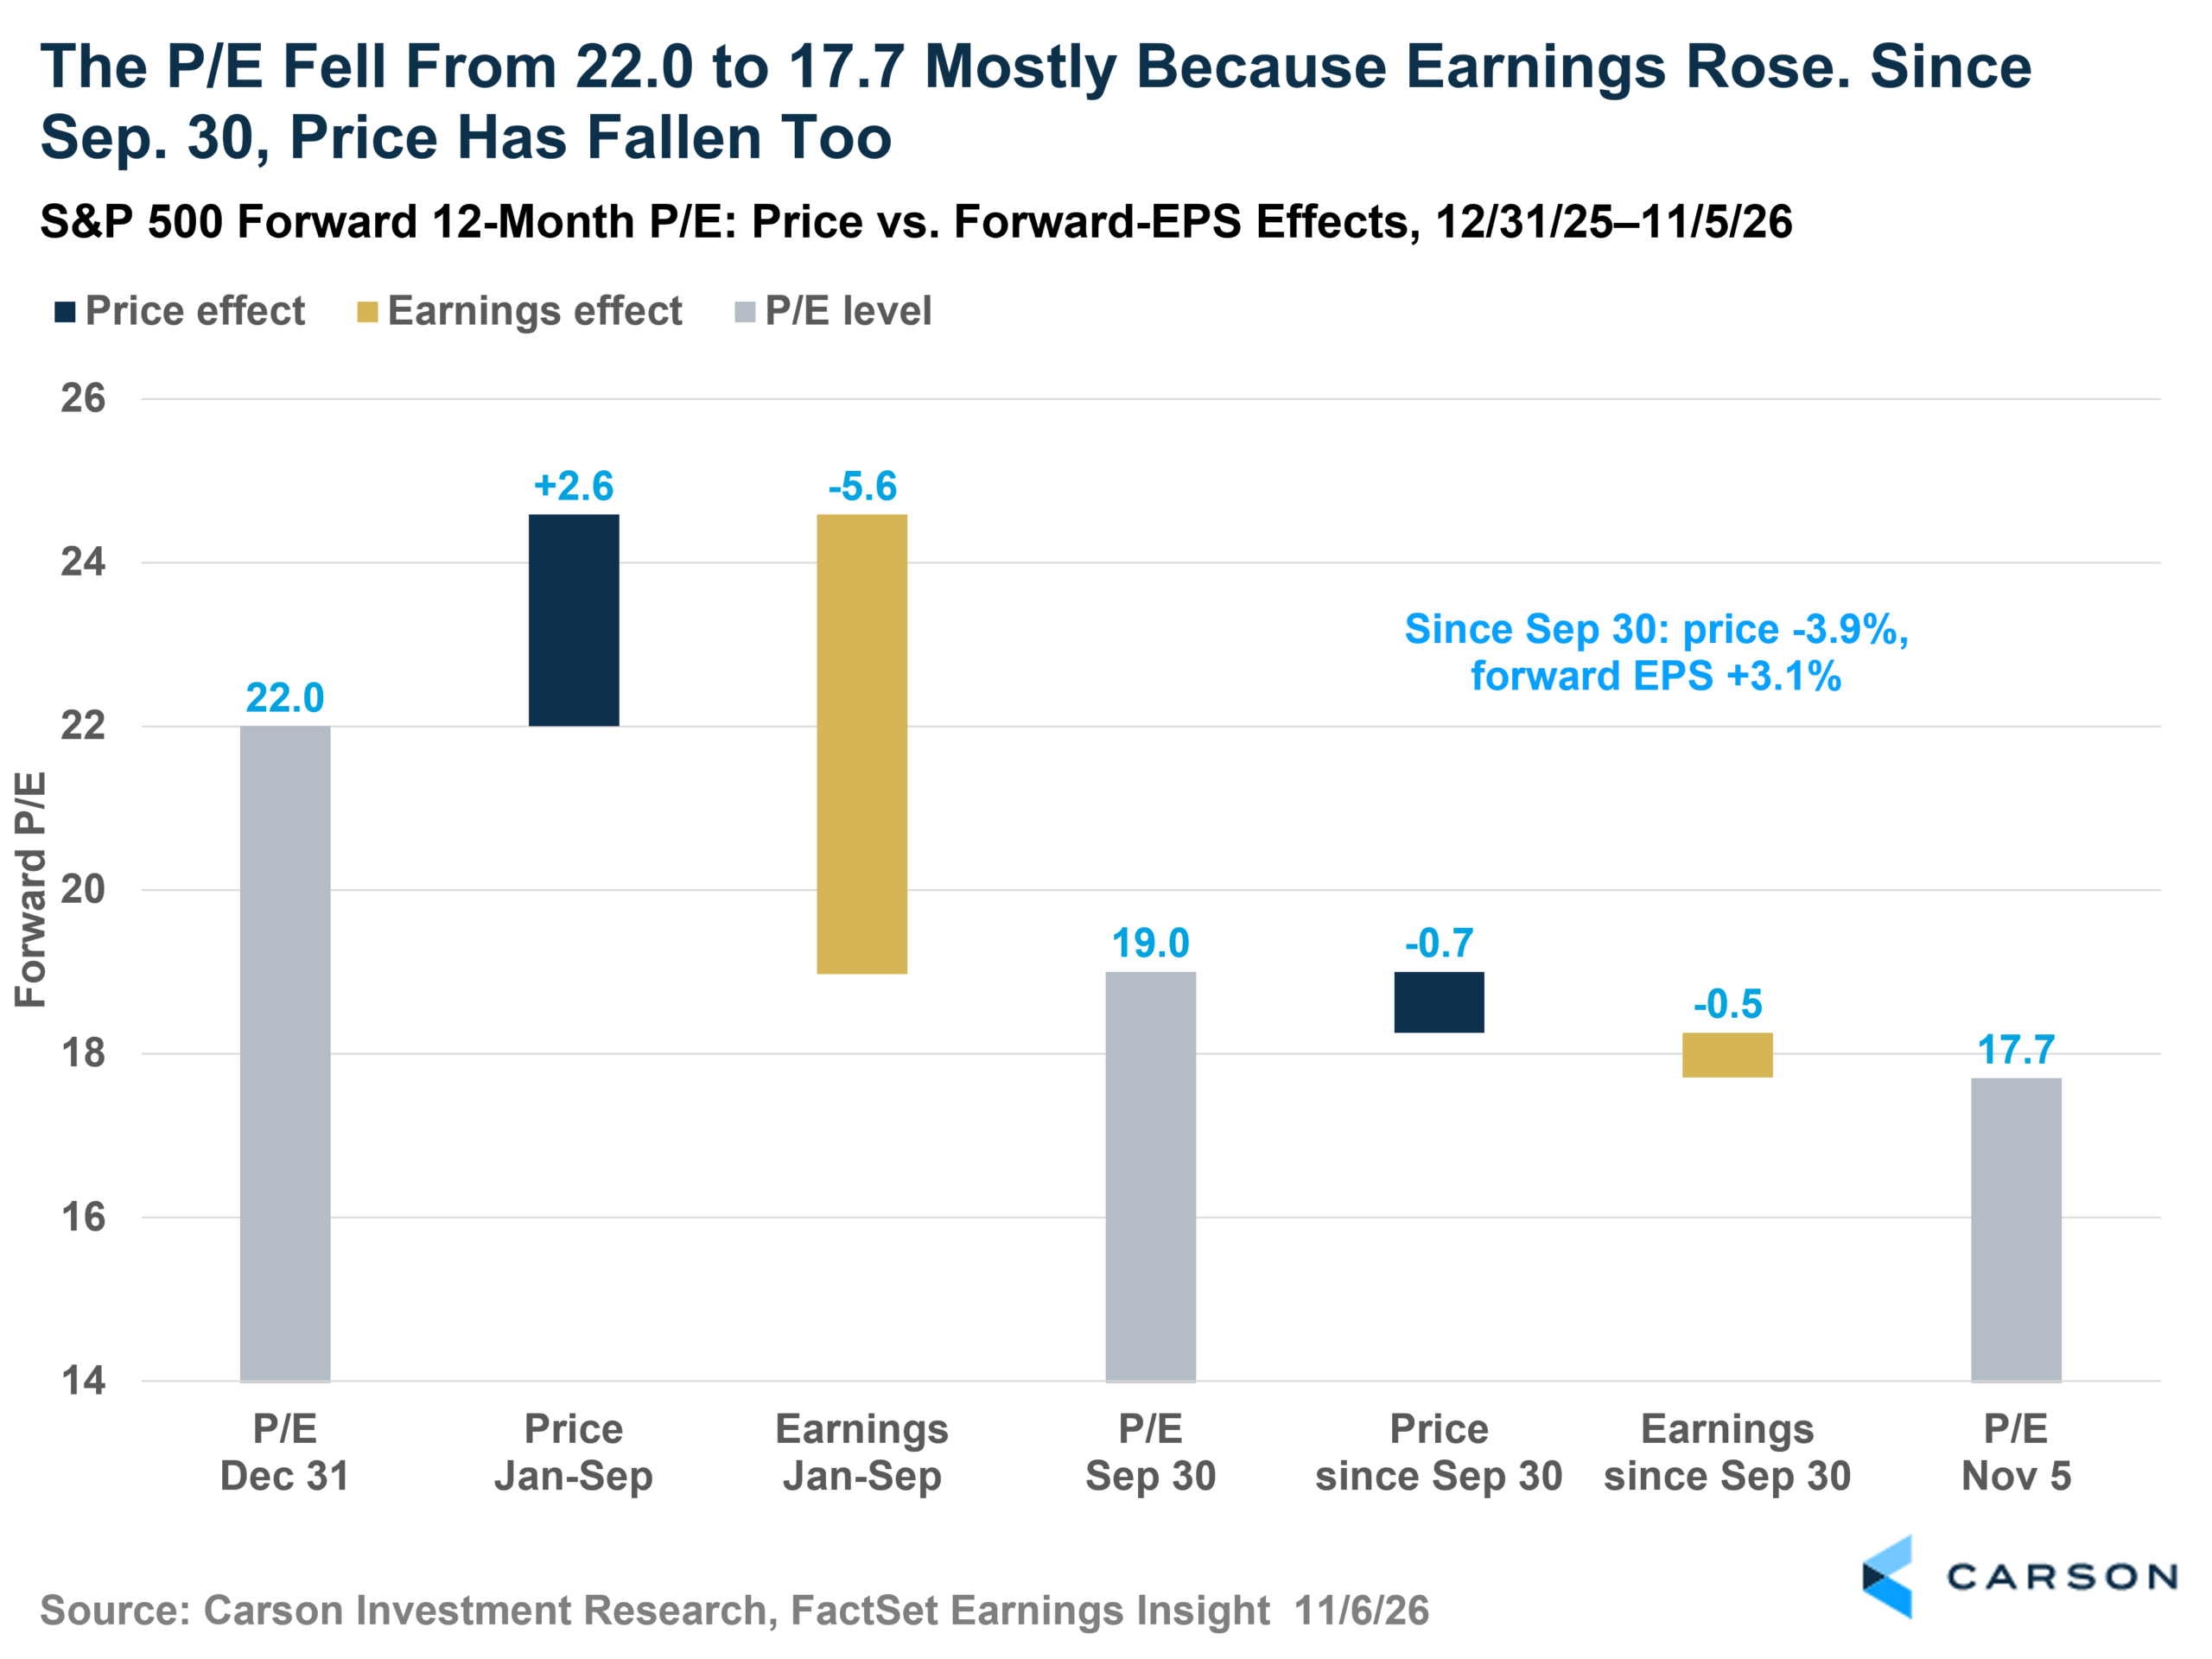
A P/E can fall in two ways. Prices can drop, or earnings can grow faster than prices. For most of this year, we got the healthy kind. From the start of the year through September, forward earnings estimates rose about 30% while the S&P 500 rose about 12%, so the P/E slid from 22.0 to 19.0, and nobody seemed to mind.
Since September 30, earnings estimates rose another 3.1%, and the index fell 3.9%. Investors stopped paying for the new earnings.
What really gets me is that interest rates aren’t the excuse. The 10-year Treasury yield fell from 5.29% to 4.84% over that stretch. Lower rates usually lift valuations, and valuations fell anyway. That suggests the market doubts the earnings.
Priced Like a Peak
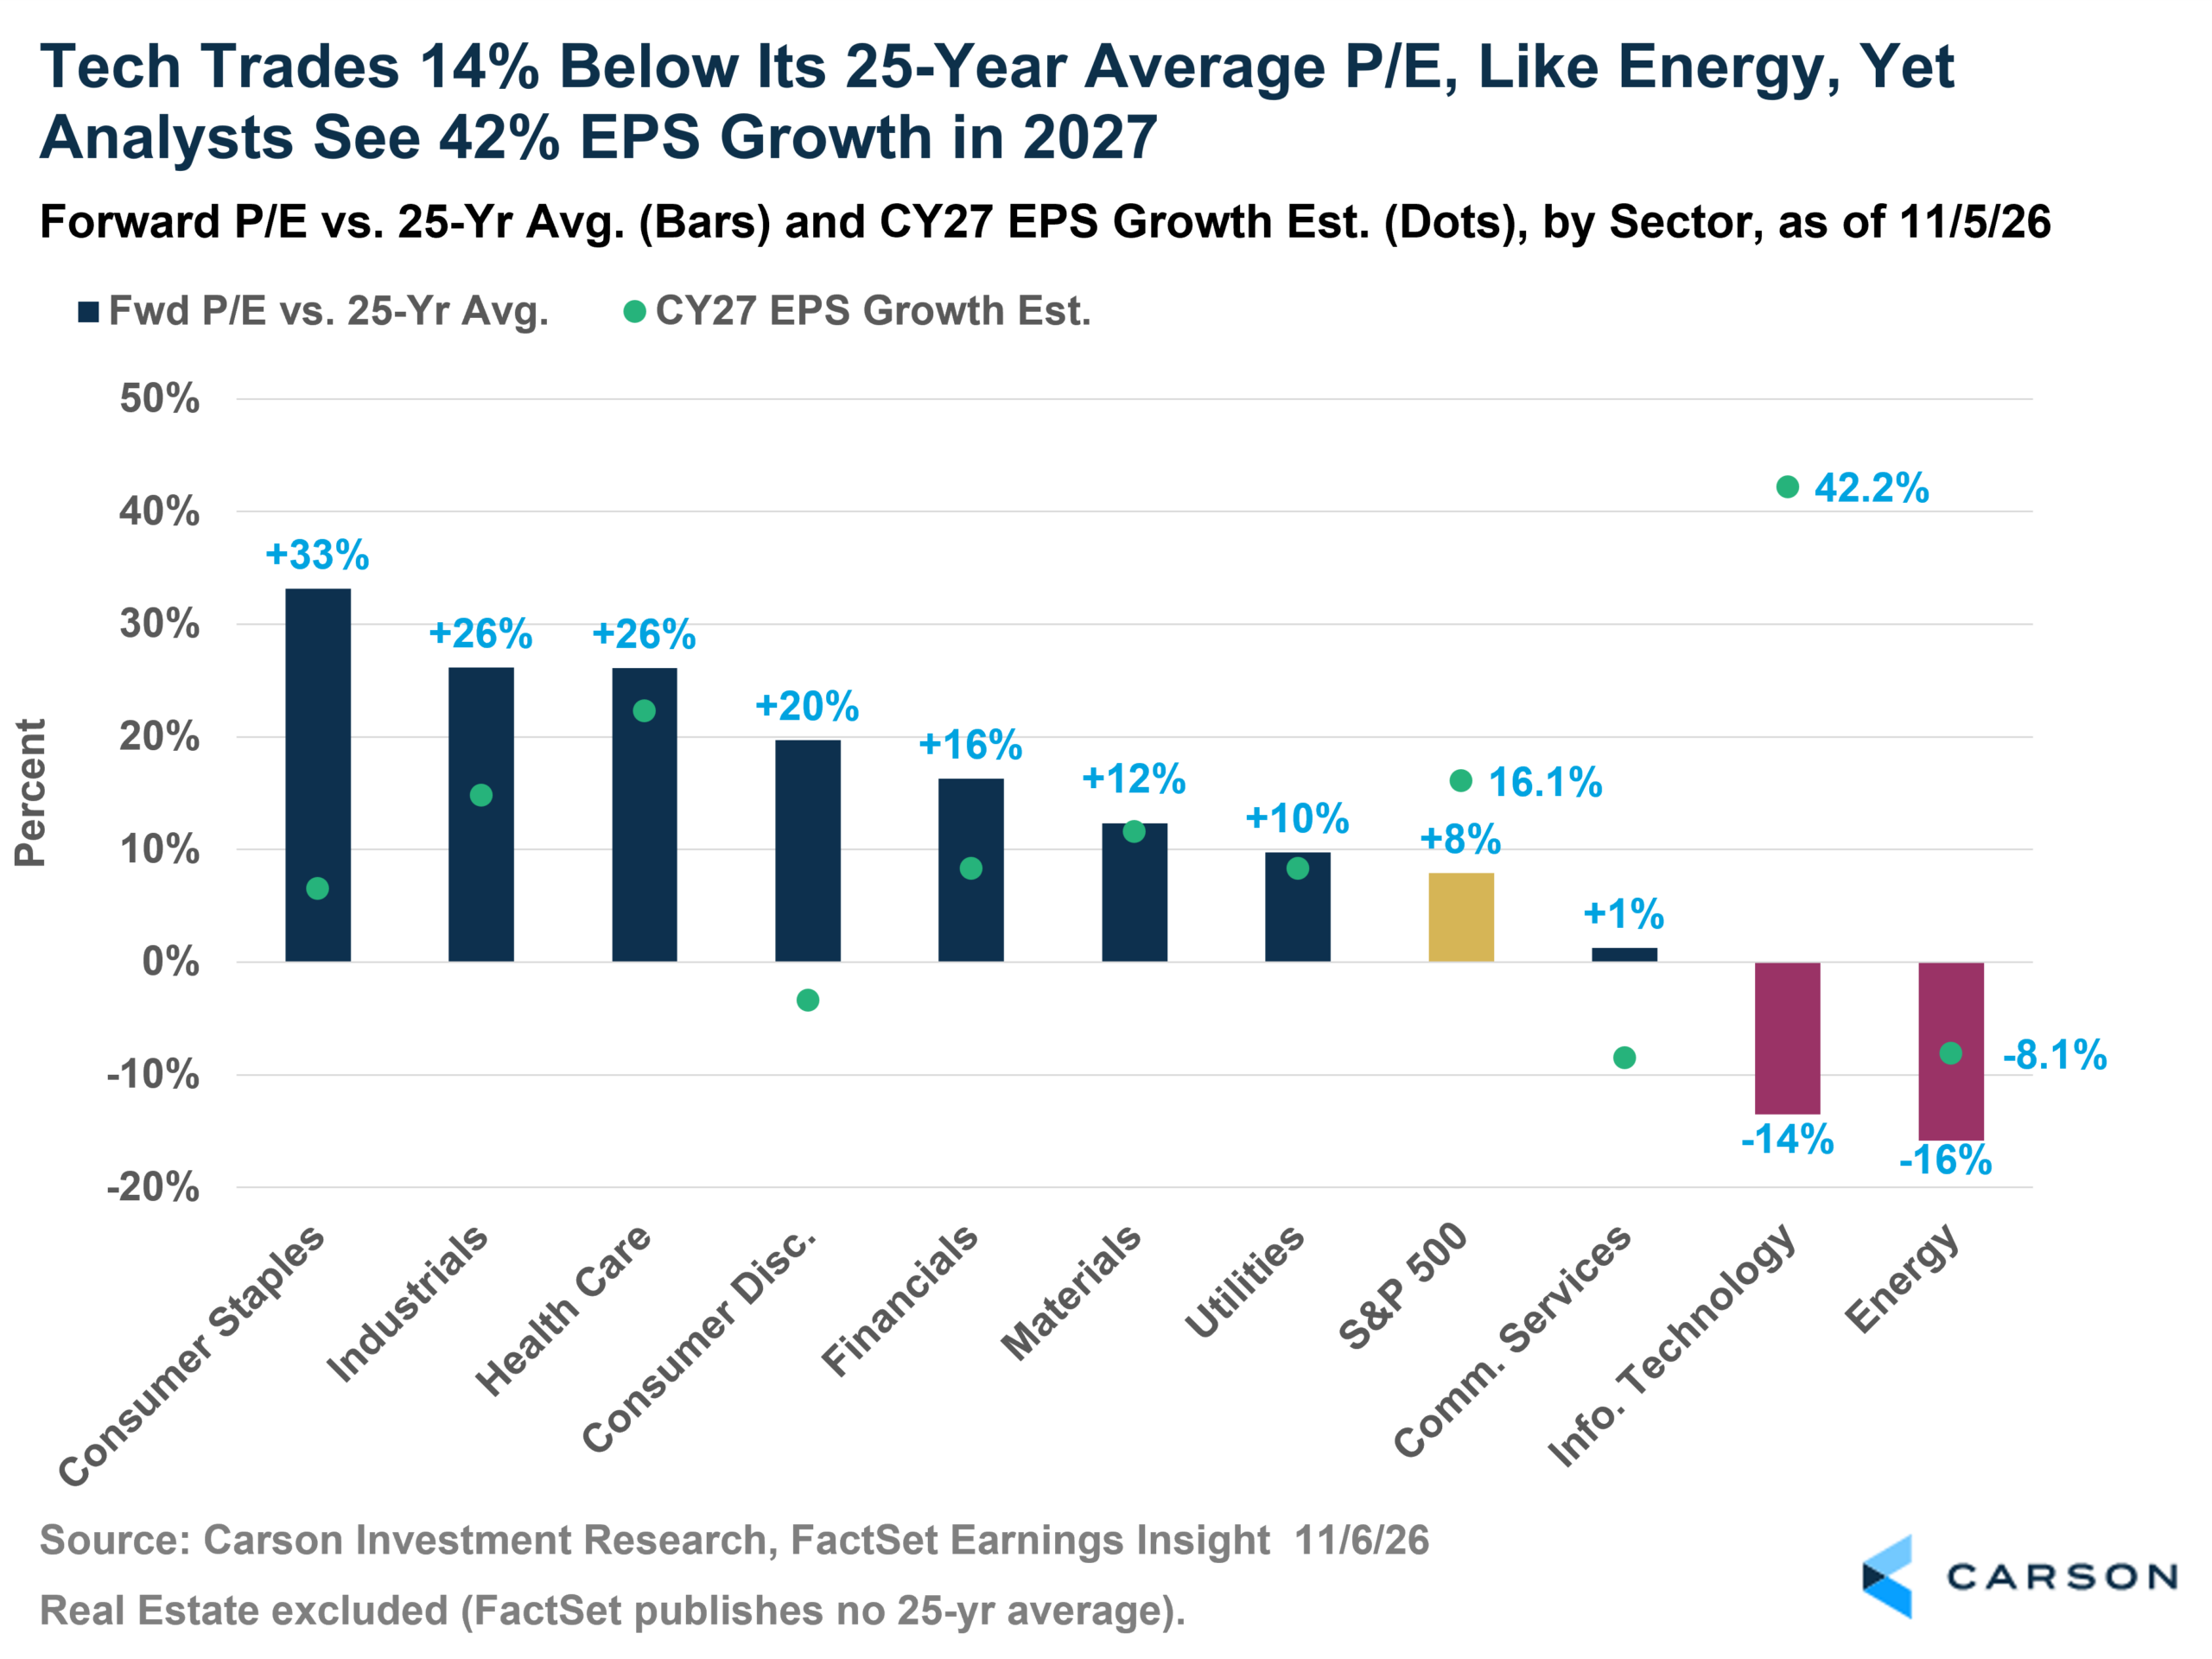
According to FactSet, only two sectors trade below their 25-year average P/E right now, and they’re the fastest-growing. Energy trades at 11.7 times earnings, down from a 25-year average of 13.9. Technology trades at 17.3 against 20.0, cheaper than the S&P 500 itself and at its lowest level since March 2020.
Energy makes sense to me. Oil averaged $85.68 in the third quarter, 32% above a year ago, and analysts already expect Energy earnings to shrink 8% next year, mostly on the basis of the war with Iran winding down and oil falling, which is exactly why investors won’t pay much for them today. However, most investors (myself included) thought the war in Iran would be finished by summertime, let alone November… yet here we are.

Stay on Top of Market Trends
The Carson Investment Research newsletter offers up-to-date market news, analysis and insights. Subscribe today!
"*" indicates required fields
Tech is the one I keep going back and forth on. Analysts expect Technology earnings to grow 42% in 2027, yet the market is pricing the sector like an oil company. Either investors know something the analysts don’t, or someone is very wrong. I keep asking myself what I’m missing, and the best answer I have comes from last week. The biggest buyers are now borrowing to pay the sellers. (Sonu, Chief Macro Strategist at Carson, laid out how large those commitments have gotten in This Is Why Everyone’s Nervous About Data Centers). As our example in the previous Earnings Check-In showed, if the homeowner needs a loan to finish the renovation, the contractor’s record year probably isn’t the new normal. It is probably more the beginning of the end.
This Has Happened Before
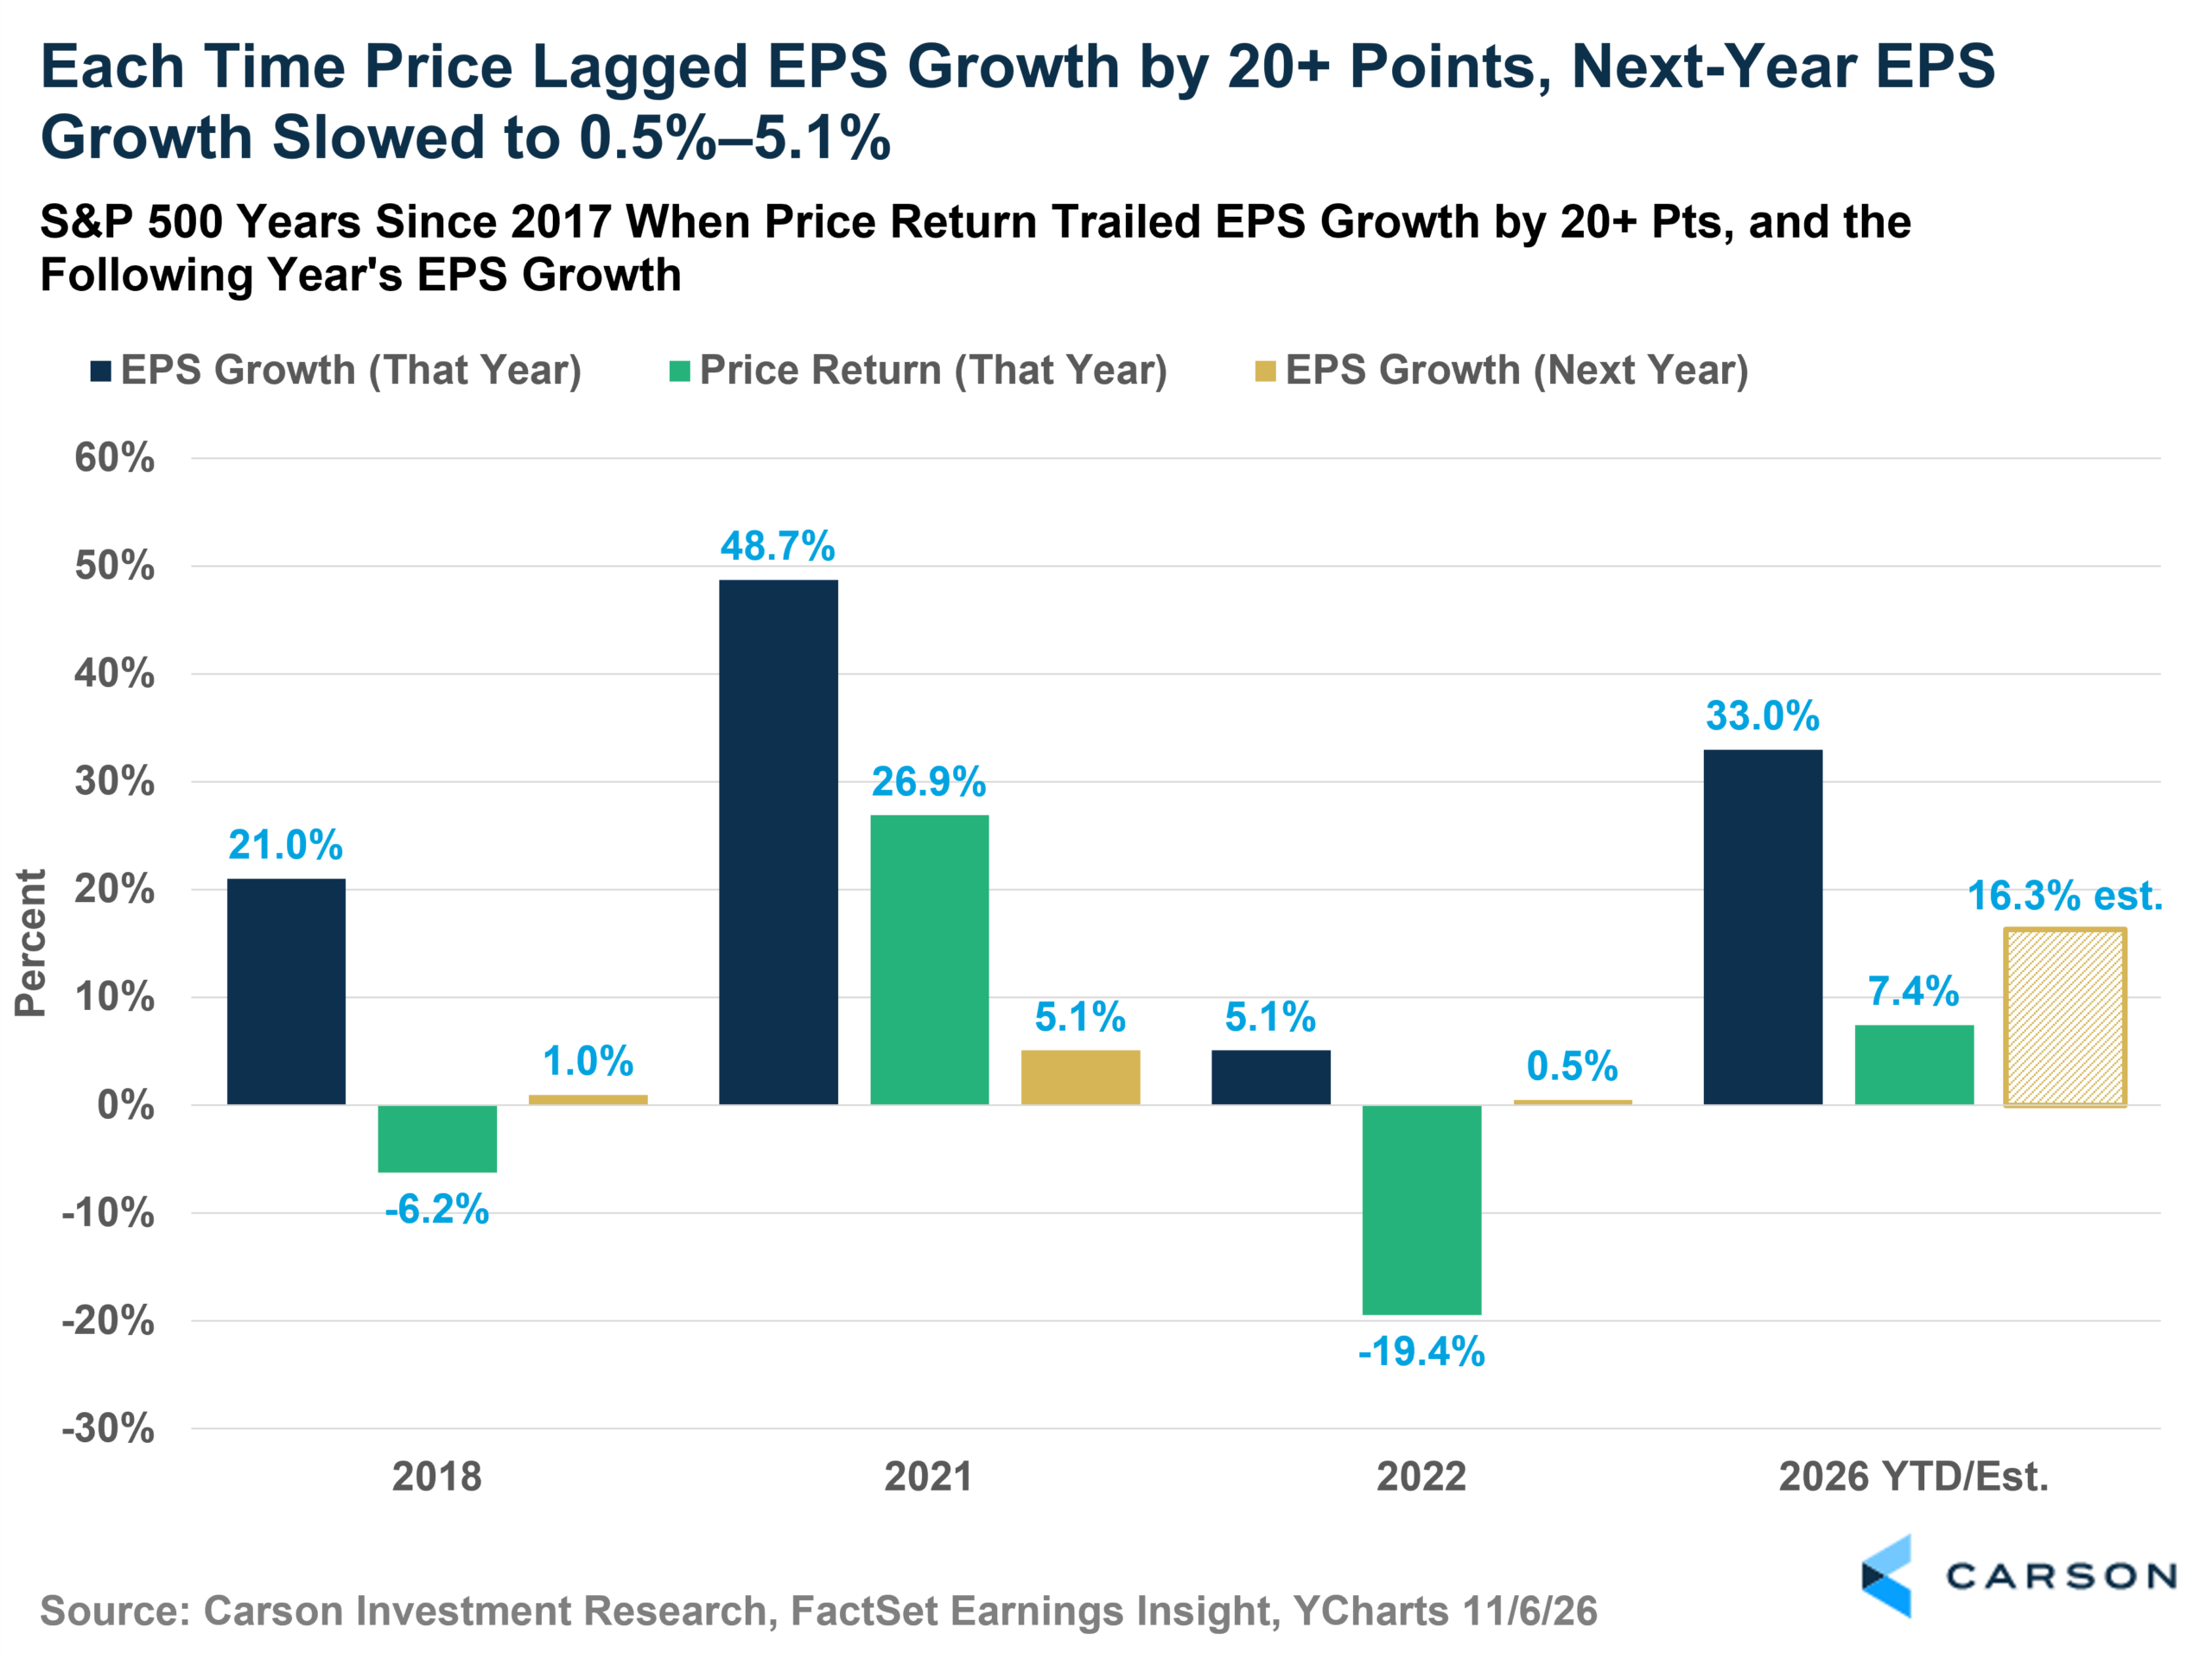
This chart surprised me! S&P 500 earnings are on track to grow about 33% this year, while the index is up just 7.4%. Of FactSet’s data, since 2017, price has trailed earnings growth by 20 points or more in only three other years: 2018, 2021, and 2022.
Each time, earnings growth nearly vanished the next year. It was 1.0% in 2019, 5.1% in 2022, and 0.5% in 2023. The market saw the slowdown before earnings did. Right now, analysts expect earnings to grow 16% in 2027.
Three cases going back to 2017 is a small sample, and 2021 comes with an asterisk since earnings were bouncing back from COVID. I still take it seriously because earnings are what stock prices are ultimately built on, and a 17.7 P/E only looks cheap if the earnings hold up. If forward earnings fell 10% and prices didn’t move, the P/E would be back near 20. The two engines carrying this season, oil and AI spending, are exactly the kind of earnings that can fade fast.
Being right about earnings didn’t always mean stocks fell. In 2019, earnings barely grew, and the S&P 500 still rose 29% after the Fed cut rates three times. In 2023, earnings grew just 0.5%, and stocks rose 24% once the Fed stopped hiking. The one year stocks fell hard was 2022, when the Fed was raising rates aggressively. Investors usually see an earnings slowdown coming early, but the Fed decides what to do in the market once it shows up, which brings me to the other side of the coin.
The Other Argument
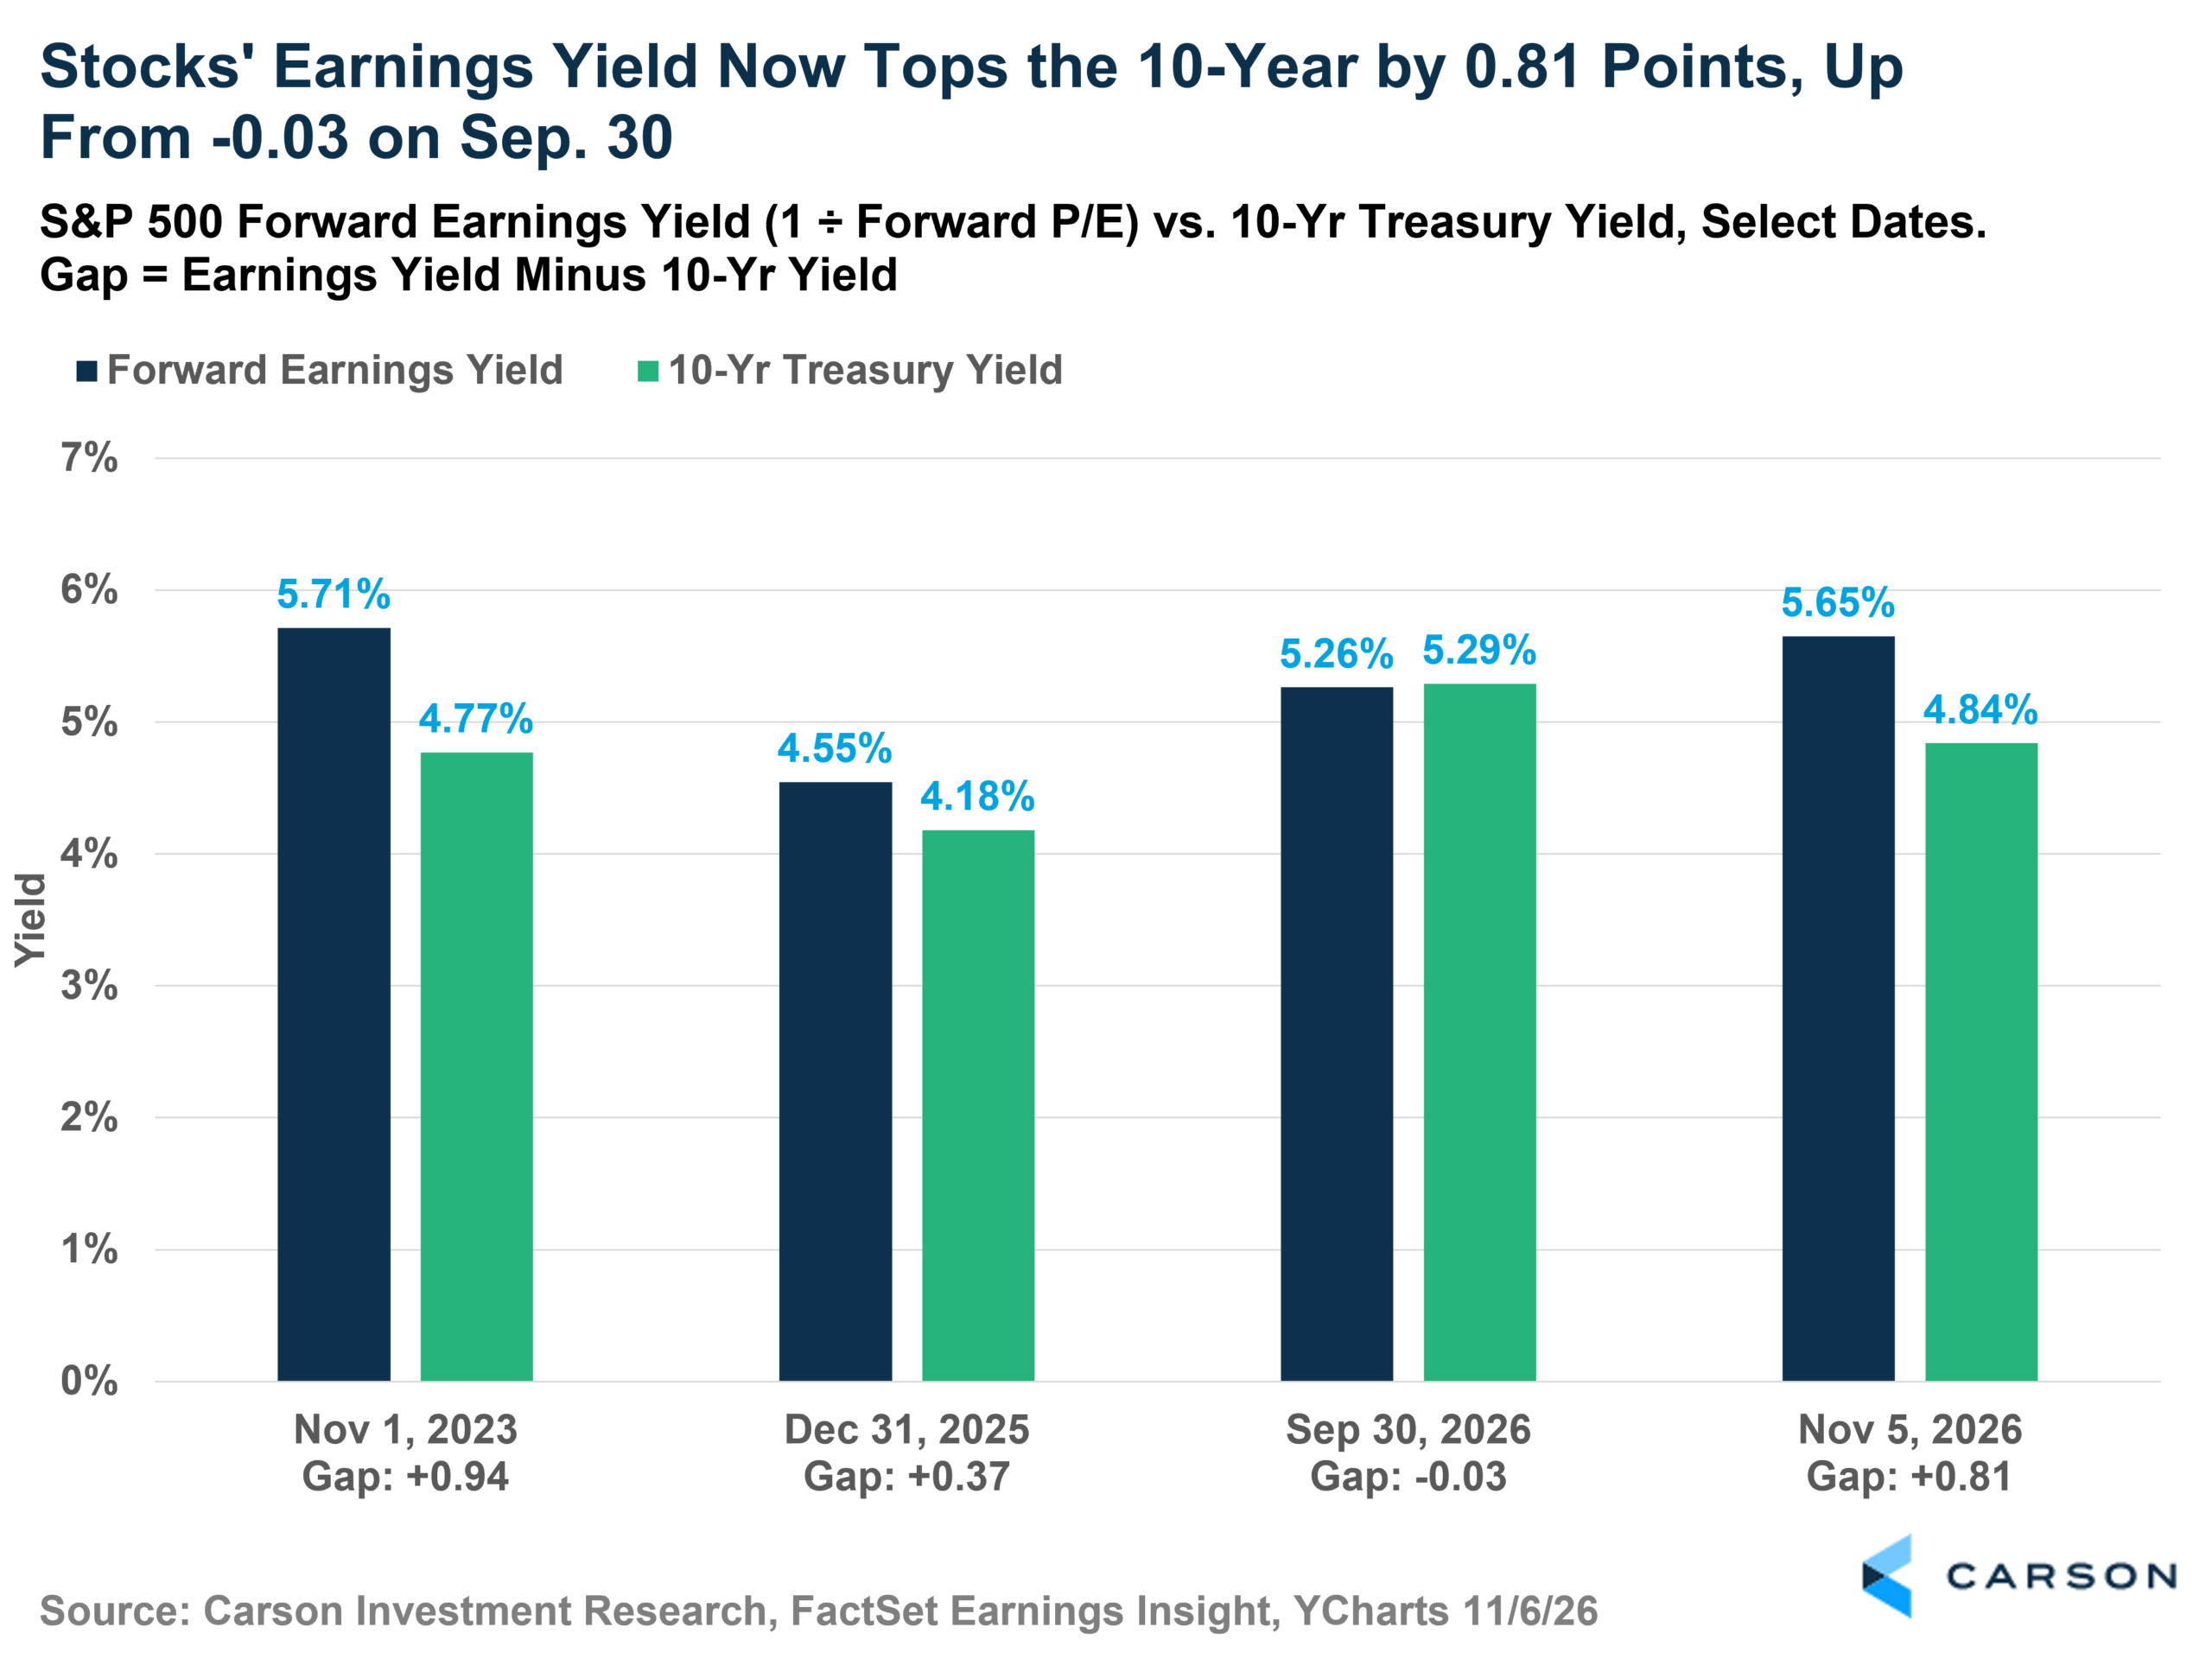
Flip the P/E upside down, and you get the earnings yield, which is roughly what stocks “earn” for every dollar you invest. The chart compares it to the 10-year Treasury yield at four points: the last time the P/E was this low, the start of this year, the start of the fourth quarter, and today. At 17.7 times earnings, the earnings yield is 5.65%, about 0.8 points more than a 10-year Treasury pays. At the end of September, stocks paid slightly less than bonds. The last time the P/E was this low, in November 2023, the gap was about the same, and stocks rallied hard from there. If the earnings hold up, that gap says stocks look undervalued next to bonds, and today could look like a bargain a year from now.
The Range of Outcomes
I see three paths from here, and each one has a sign I’ll be watching for.
In the first, the analysts are right. 2027 estimates hold, Tech grows into its low P/E, and we look back on this as a great entry point not only in the sector, but also the market. The sign would be Tech’s 2027 estimates still rising into January while the sector’s P/E climbs back toward its average.
In the second, earnings growth cools toward normal, and the index keeps moving sideways, as it has since May. The sign would be estimates drifting lower a little at a time, with no big cuts and no big rally.
In the third, this really is the peak. 2027 estimates fall the way 2019’s did, and a low P/E doesn’t protect anyone because the earnings shrink underneath it. The sign would be the chip sellers guiding more cautiously while the big buyers need even more outside money to keep building.
I think the risks lean toward the second and third paths. When earnings this strong get priced this cheaply, investors usually see something coming, and in the few cases I can find, they were right about earnings.
What makes this tricky is that the safer corners of the market aren’t cheap either. Consumer Staples trade 33% above their 25-year average P/E, and Health Care and Industrials are about 26% above theirs, based on FactSet data. Stepping away from AI doesn’t automatically mean stepping into bargains. To me, that argues for spreading out and being picky about what you pay for the “safe” or “safer” stuff.
What Would Change My Mind
NVIDIA reports November 17, and it’s the biggest test left this season. If NVIDIA raises its outlook and Tech’s 2027 estimates keep climbing through year-end, I’m wrong, and the market is being too cautious. If those estimates start slipping before New Year’s, the market saw it first. Either way, I’ll update the map here.
Reporting This Week
Only 13 S&P 500 companies report this week, which might be a relief since investors might need a long nap after last week’s fireworks. See everyone next Tuesday.
By Harry McDonald, Analyst, Investment Research
9231391.1. – 11NOV26A