Welcome to Carson Investment Research’s Earnings Check-In for the week ending July 31, 2026. This series is built weekly from FactSet’s Earnings Insight report (John Butters, VP, Senior Earnings Analyst with FactSet), with index weights and market caps sourced from YCharts, and aggregation performed in-house. We tie every figure to FactSet’s published numbers, then add Carson’s perspective on top of that. We publish our Earnings Check-In weekly during earnings season.
Last week I wrote about Alphabet’s $98 billion investment gain and how it had handed the S&P 500 a headline number the underlying businesses hadn’t quite earned. I filed that post thinking I’d written about an oddity, or even a one-off.
Then Amazon reported a jaw-dropping $80.8 billion of operating income, against estimates for $24.4 billion. Yes, a 231% beat! It translated to EPS of $5.75 against estimates for $1.82. However, much like Google, Amazon’s operating income included a large gain from their stake in Anthropic. This gain totaled $53.4 billion of operating income in the quarter and powered nearly the entirety of their earnings beat.
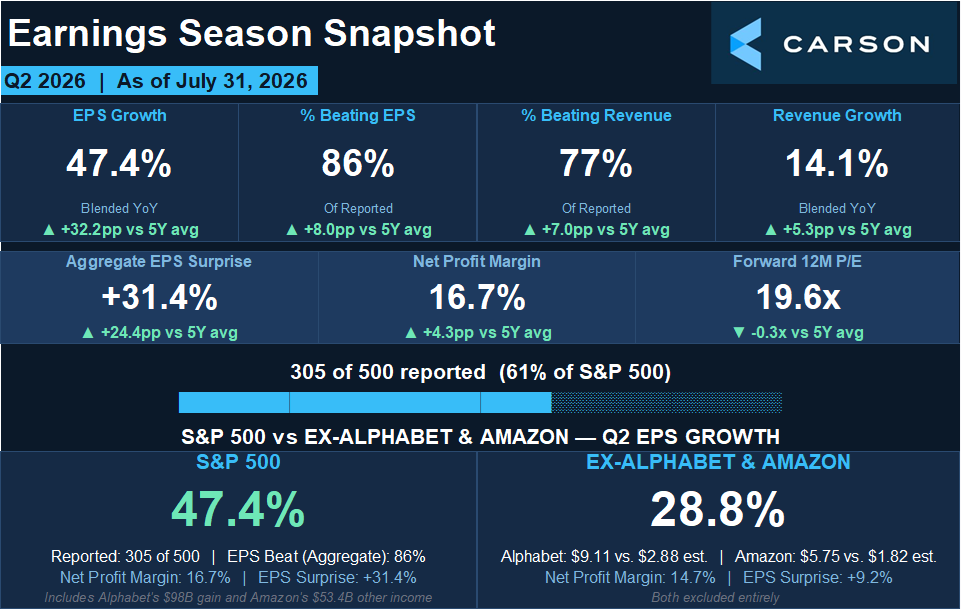
With 61% of the index reported, blended Q2 earnings growth now sits at 47.4%, up from 38.0% a week ago. That would be the fastest growth the S&P 500 has posted since Q2 2021. Amazon by itself accounted for 76% of the net dollar increase in index earnings this past week.
Source: Carson Investment Research, Earnings Insight, FactSet 7/31/2026
What Changed This Week
Nearly everything moved up, and a few things moved into record territory.
86% of reporters have beaten EPS estimates against a 5-year average of 78%. In aggregate, they’re beating by 31.4%, which is the largest aggregate earnings surprise FactSet has recorded since it started tracking the metric in 2008. The prior record was 23.2%, set in Q2 2020. Revenue growth rose to 14.1%, the best since Q4 2021, with 77% of companies beating sales estimates. Net profit margin hit 16.7%, a record going back to 2009, breaking the 14.8% record set last quarter!
Guidance has also been good news. Of the 54 companies that have guided for Q3, only 20 guided lower. That 37% negative rate sits well below the 58% five-year average.
Analysts almost always start a quarter by lowering the bar. This July, they raised it instead for the second straight quarter.
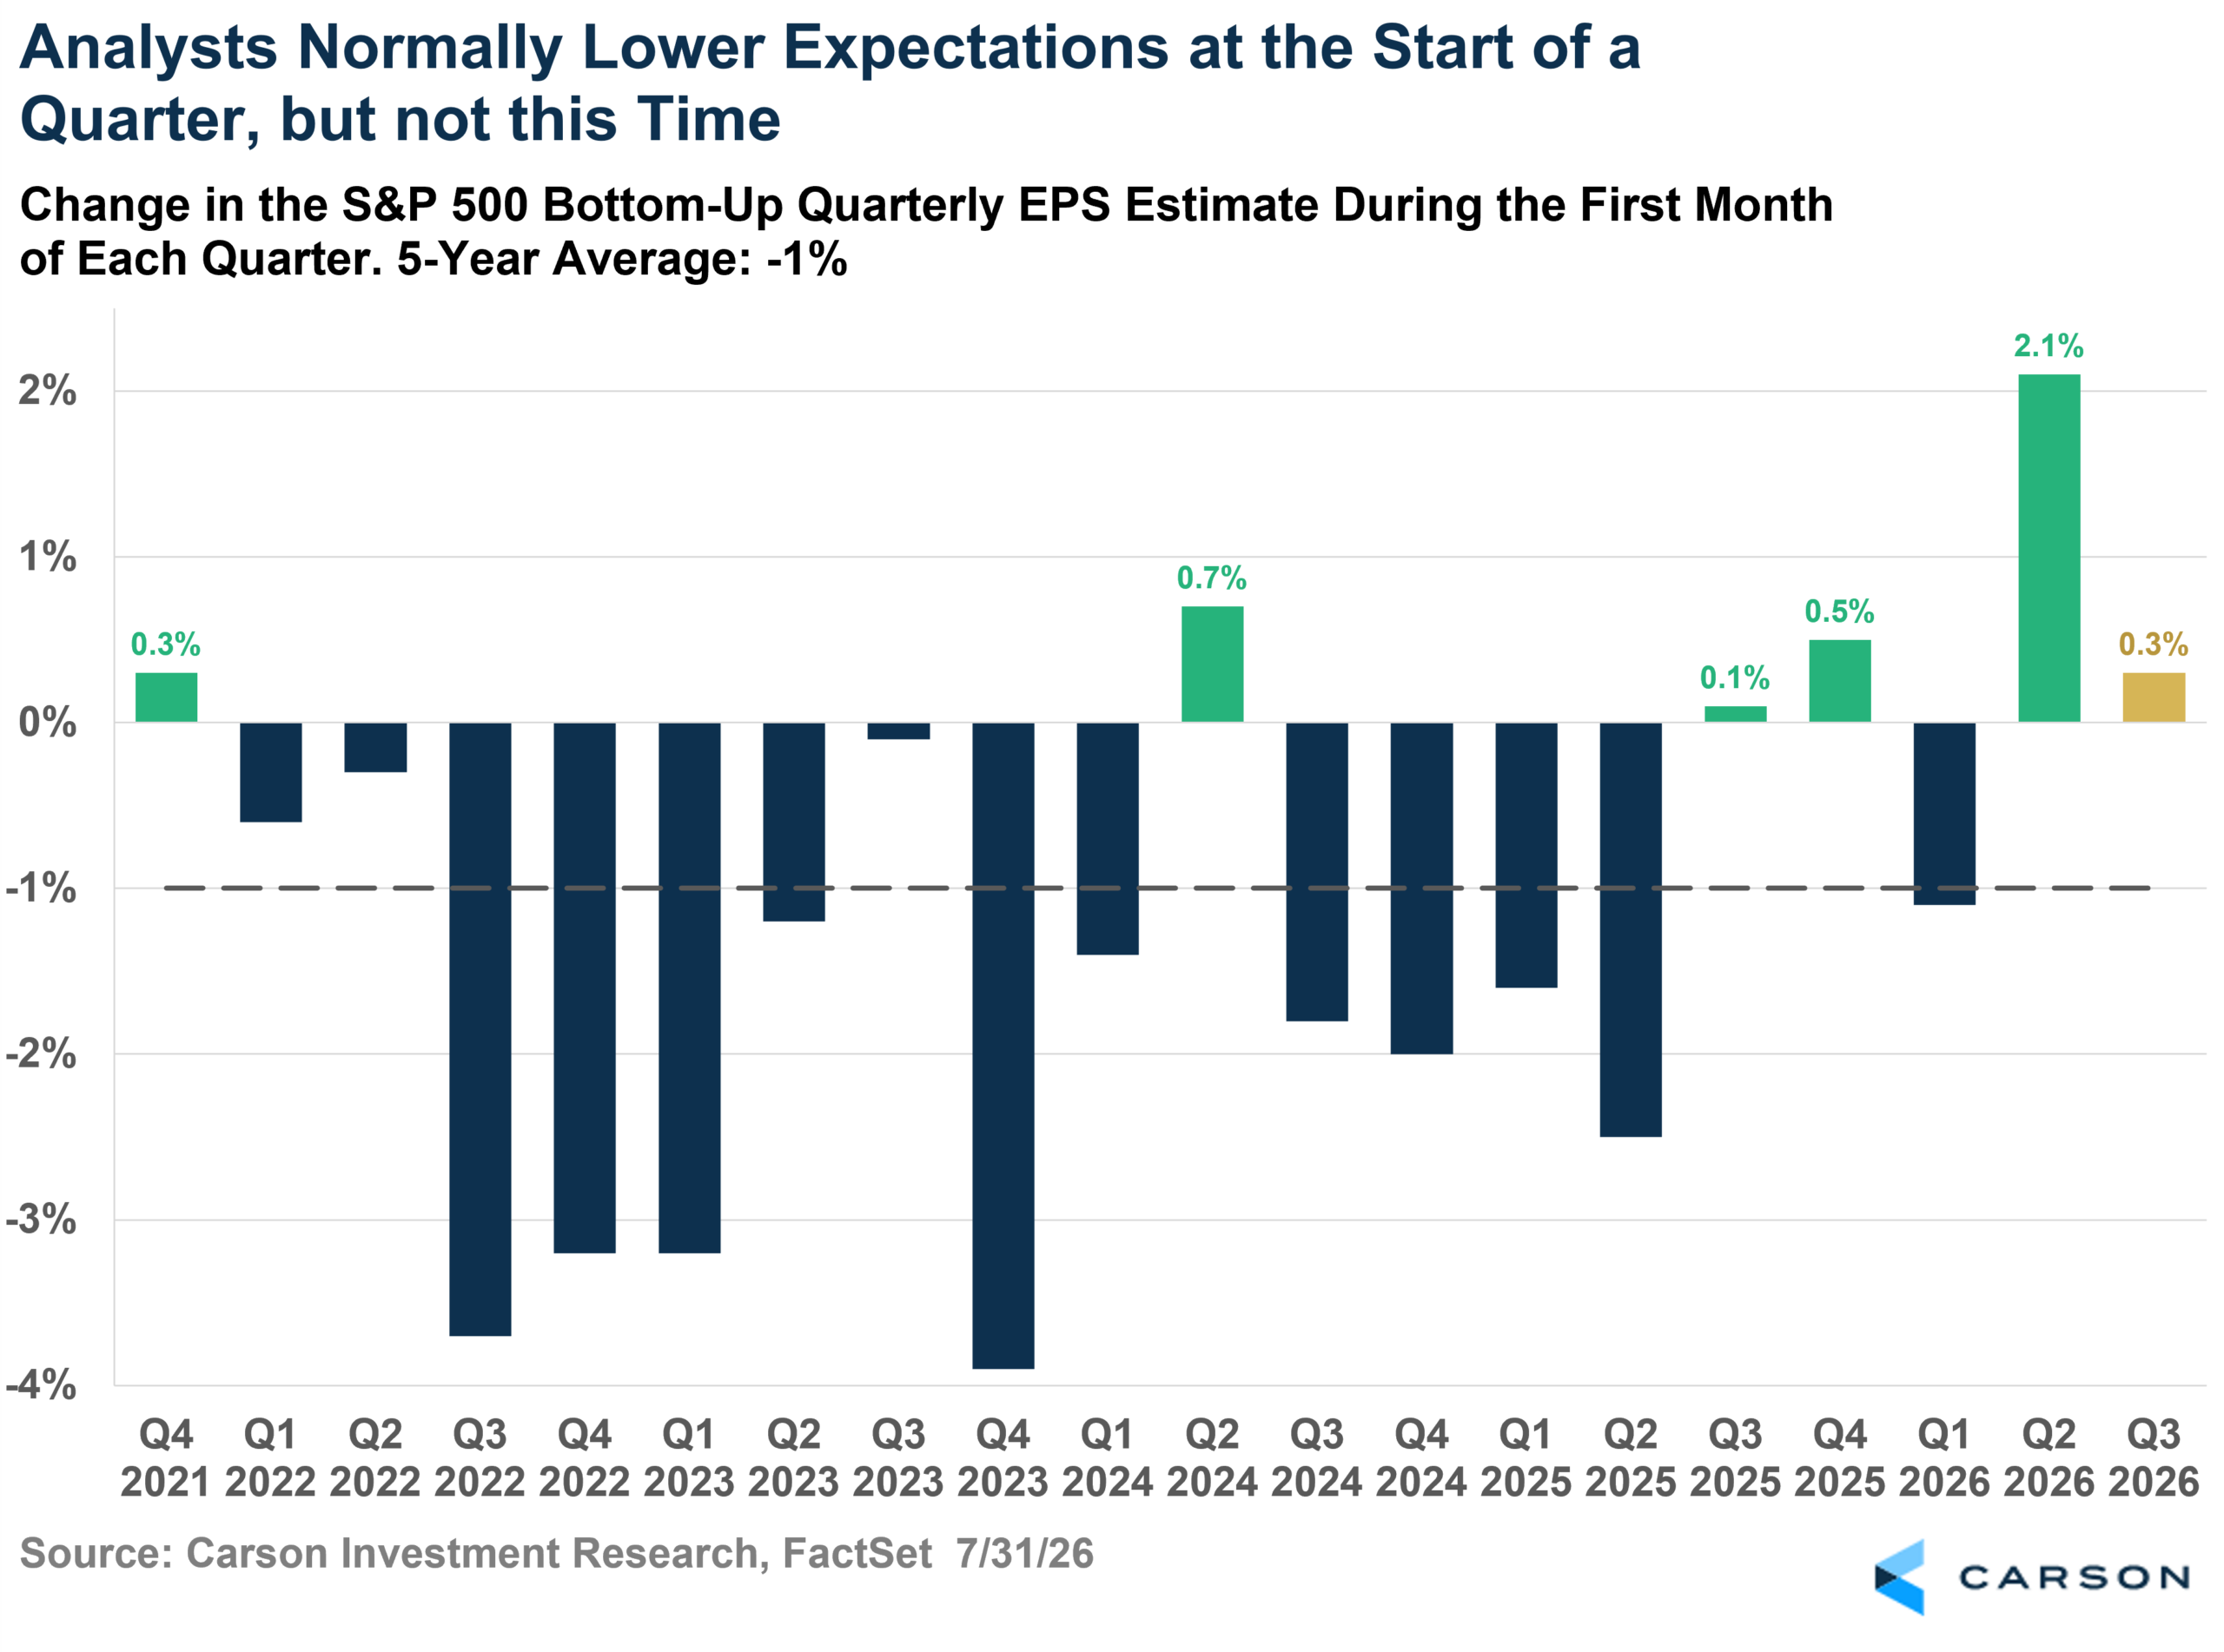
Estimates for the coming quarter normally get trimmed about 1.0% during the first month. This July, they rose 0.3%. It’s the second straight quarter and the fourth time in the past five. I want to be careful here, because 0.3% is a small number and I don’t think it’s evidence of a boom. But over the last twenty quarters, analysts have raised in month one only six times, and four of those are recent. Something in the estimate-setting behavior may have changed, though I’ll come back to why in a minute.
Four Versions of the Same Quarter
Butters gives us the exclusion math, but it’s spread across three different pages of the report. Putting it in one place lets us paint the entire picture.
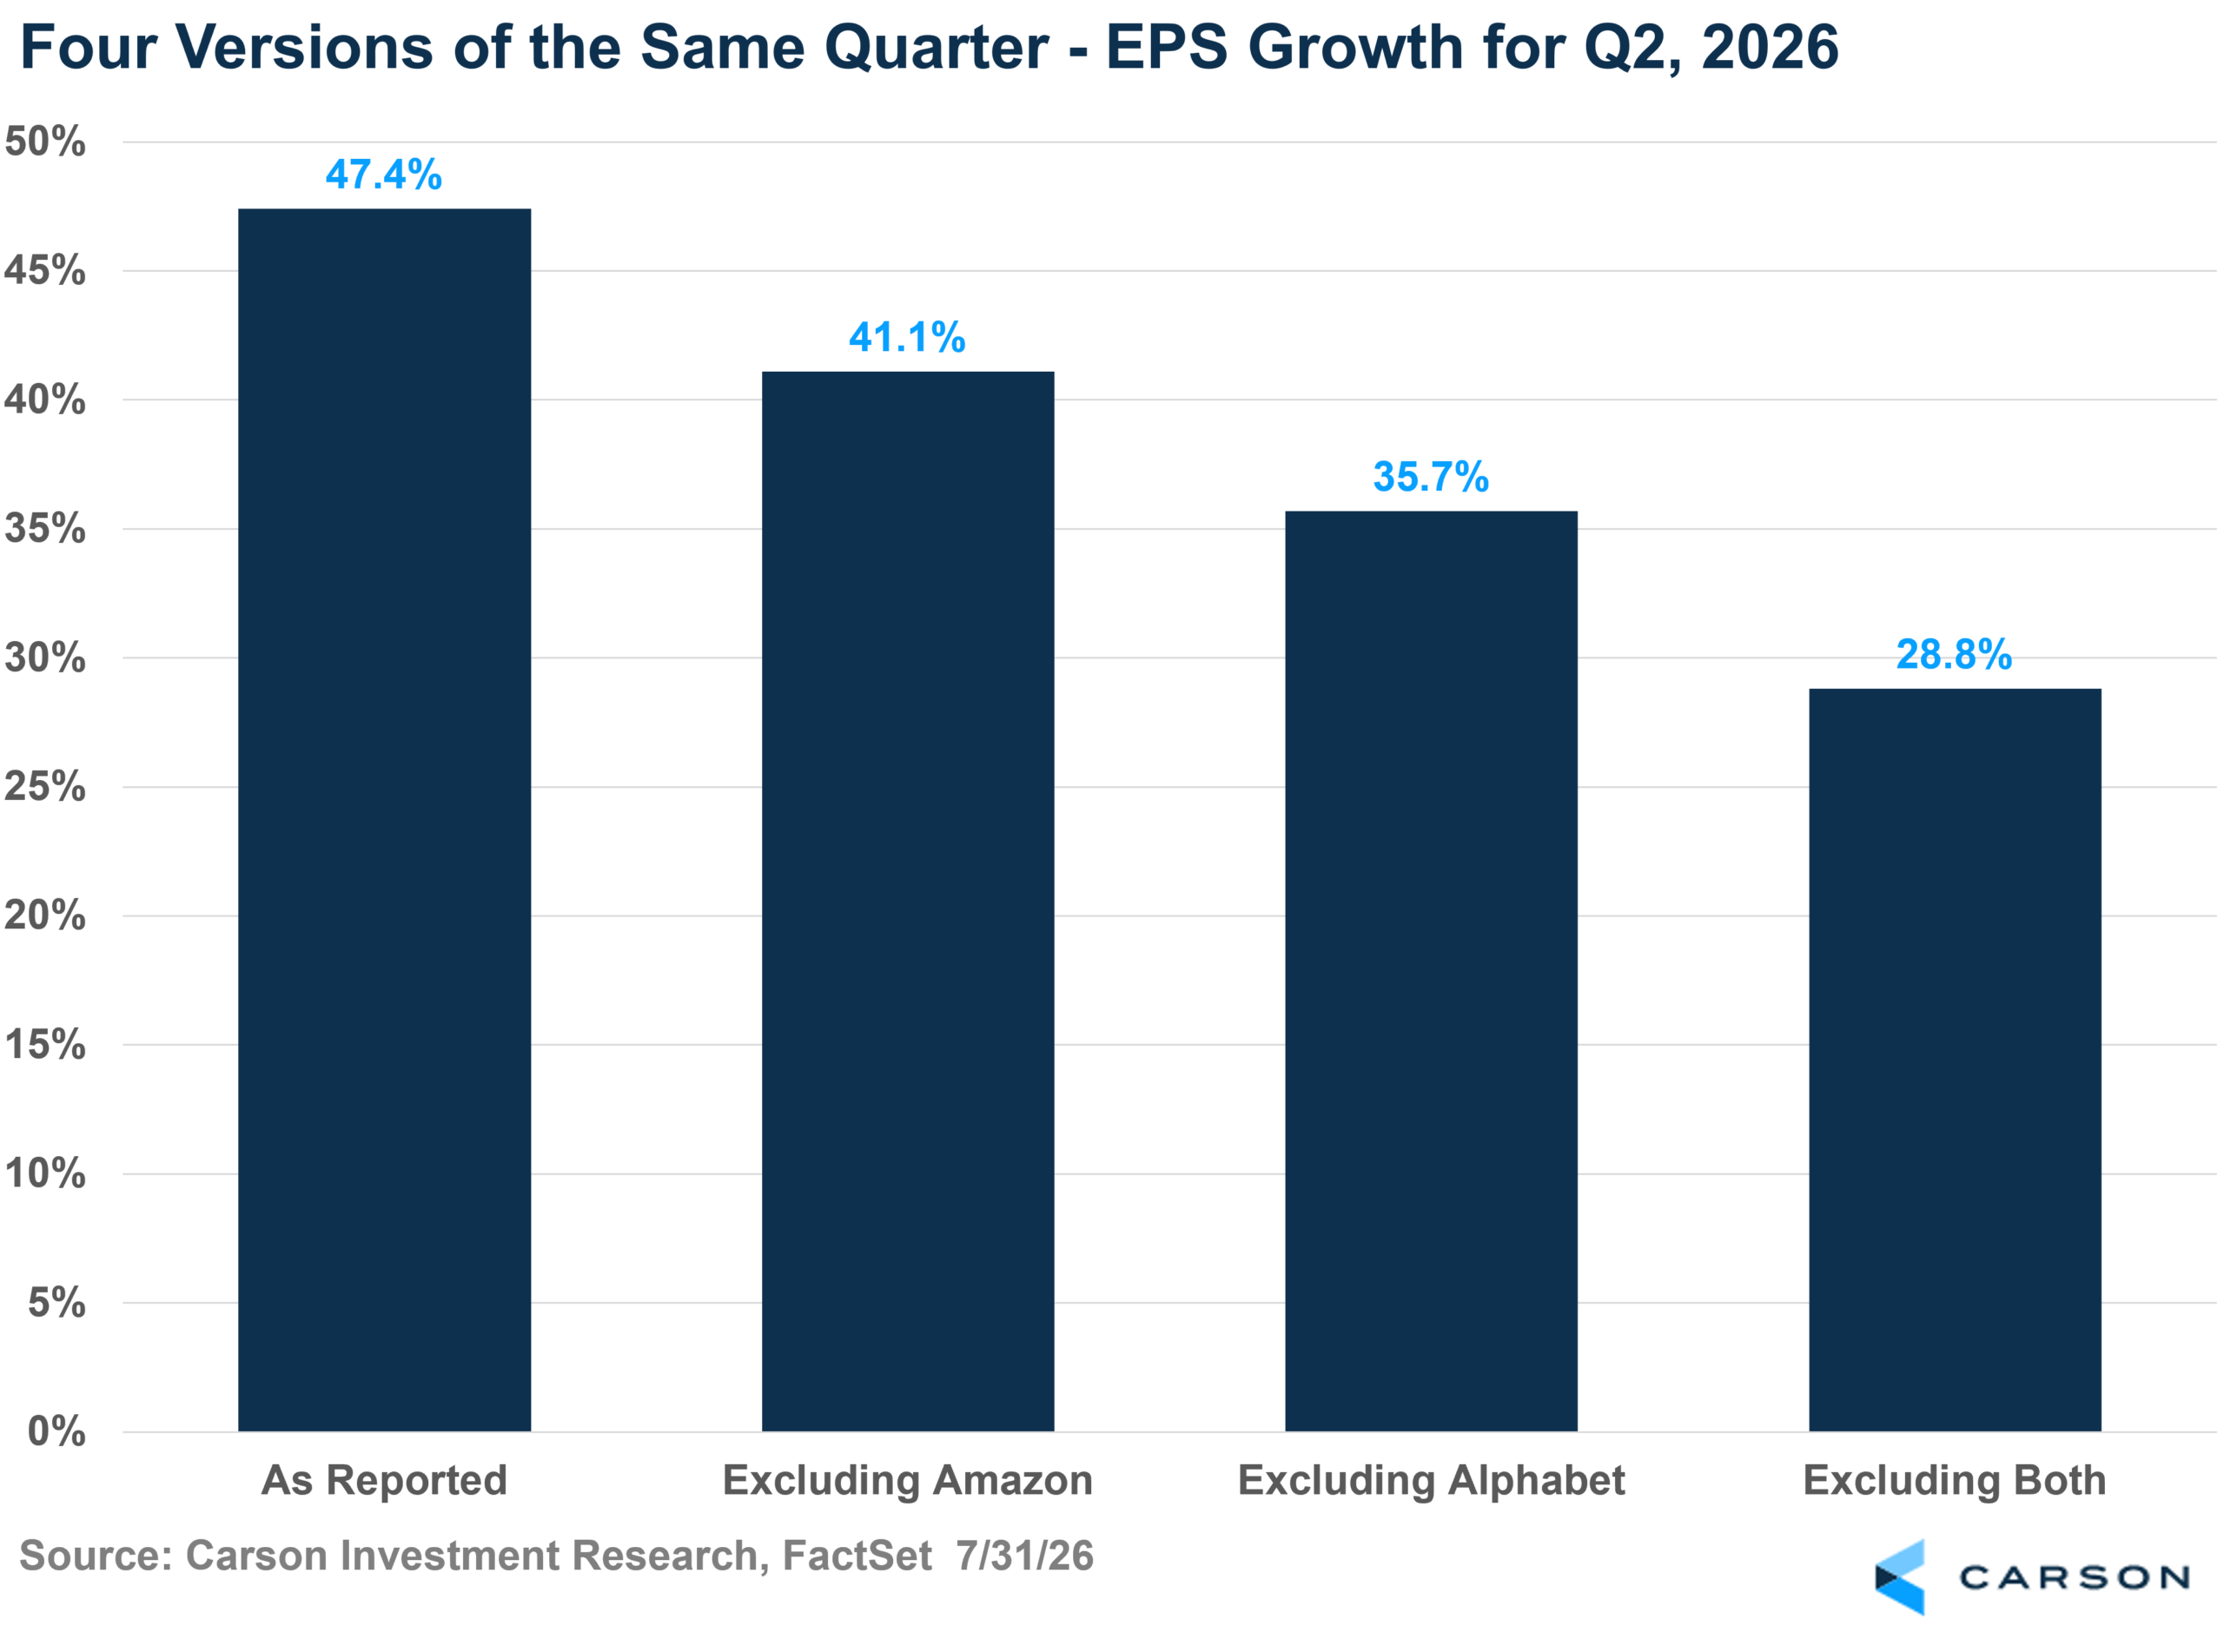
Two companies out of five hundred are worth 18.6 percentage points of index earnings growth. That record 31.4% aggregate surprise falls to 9.2% without them. The record 16.7% margin falls to 14.7%.
However, 28.8% is an excellent quarter. Second straight above 20%, seventh straight in double digits. And because beat rates count companies, the 86% and 77% barely move when you pull those two names out. The season underneath the headline stands on its own, and does not deserve my down-playing.

Stay on Top of Market Trends
The Carson Investment Research newsletter offers up-to-date market news, analysis and insights. Subscribe today!
"*" indicates required fields
But 47.4% and 28.8% are not the same statement about corporate America, and the gap between them isn’t necessarily operating performance. It’s marks on investment portfolios. Real accounting income, but not repeatable. It fundamentally tells you nothing about whether the underlying business is compounding.
The Market Already Knew This
The index just posted its best earnings growth in five years and finished July essentially flat (-0.13%).
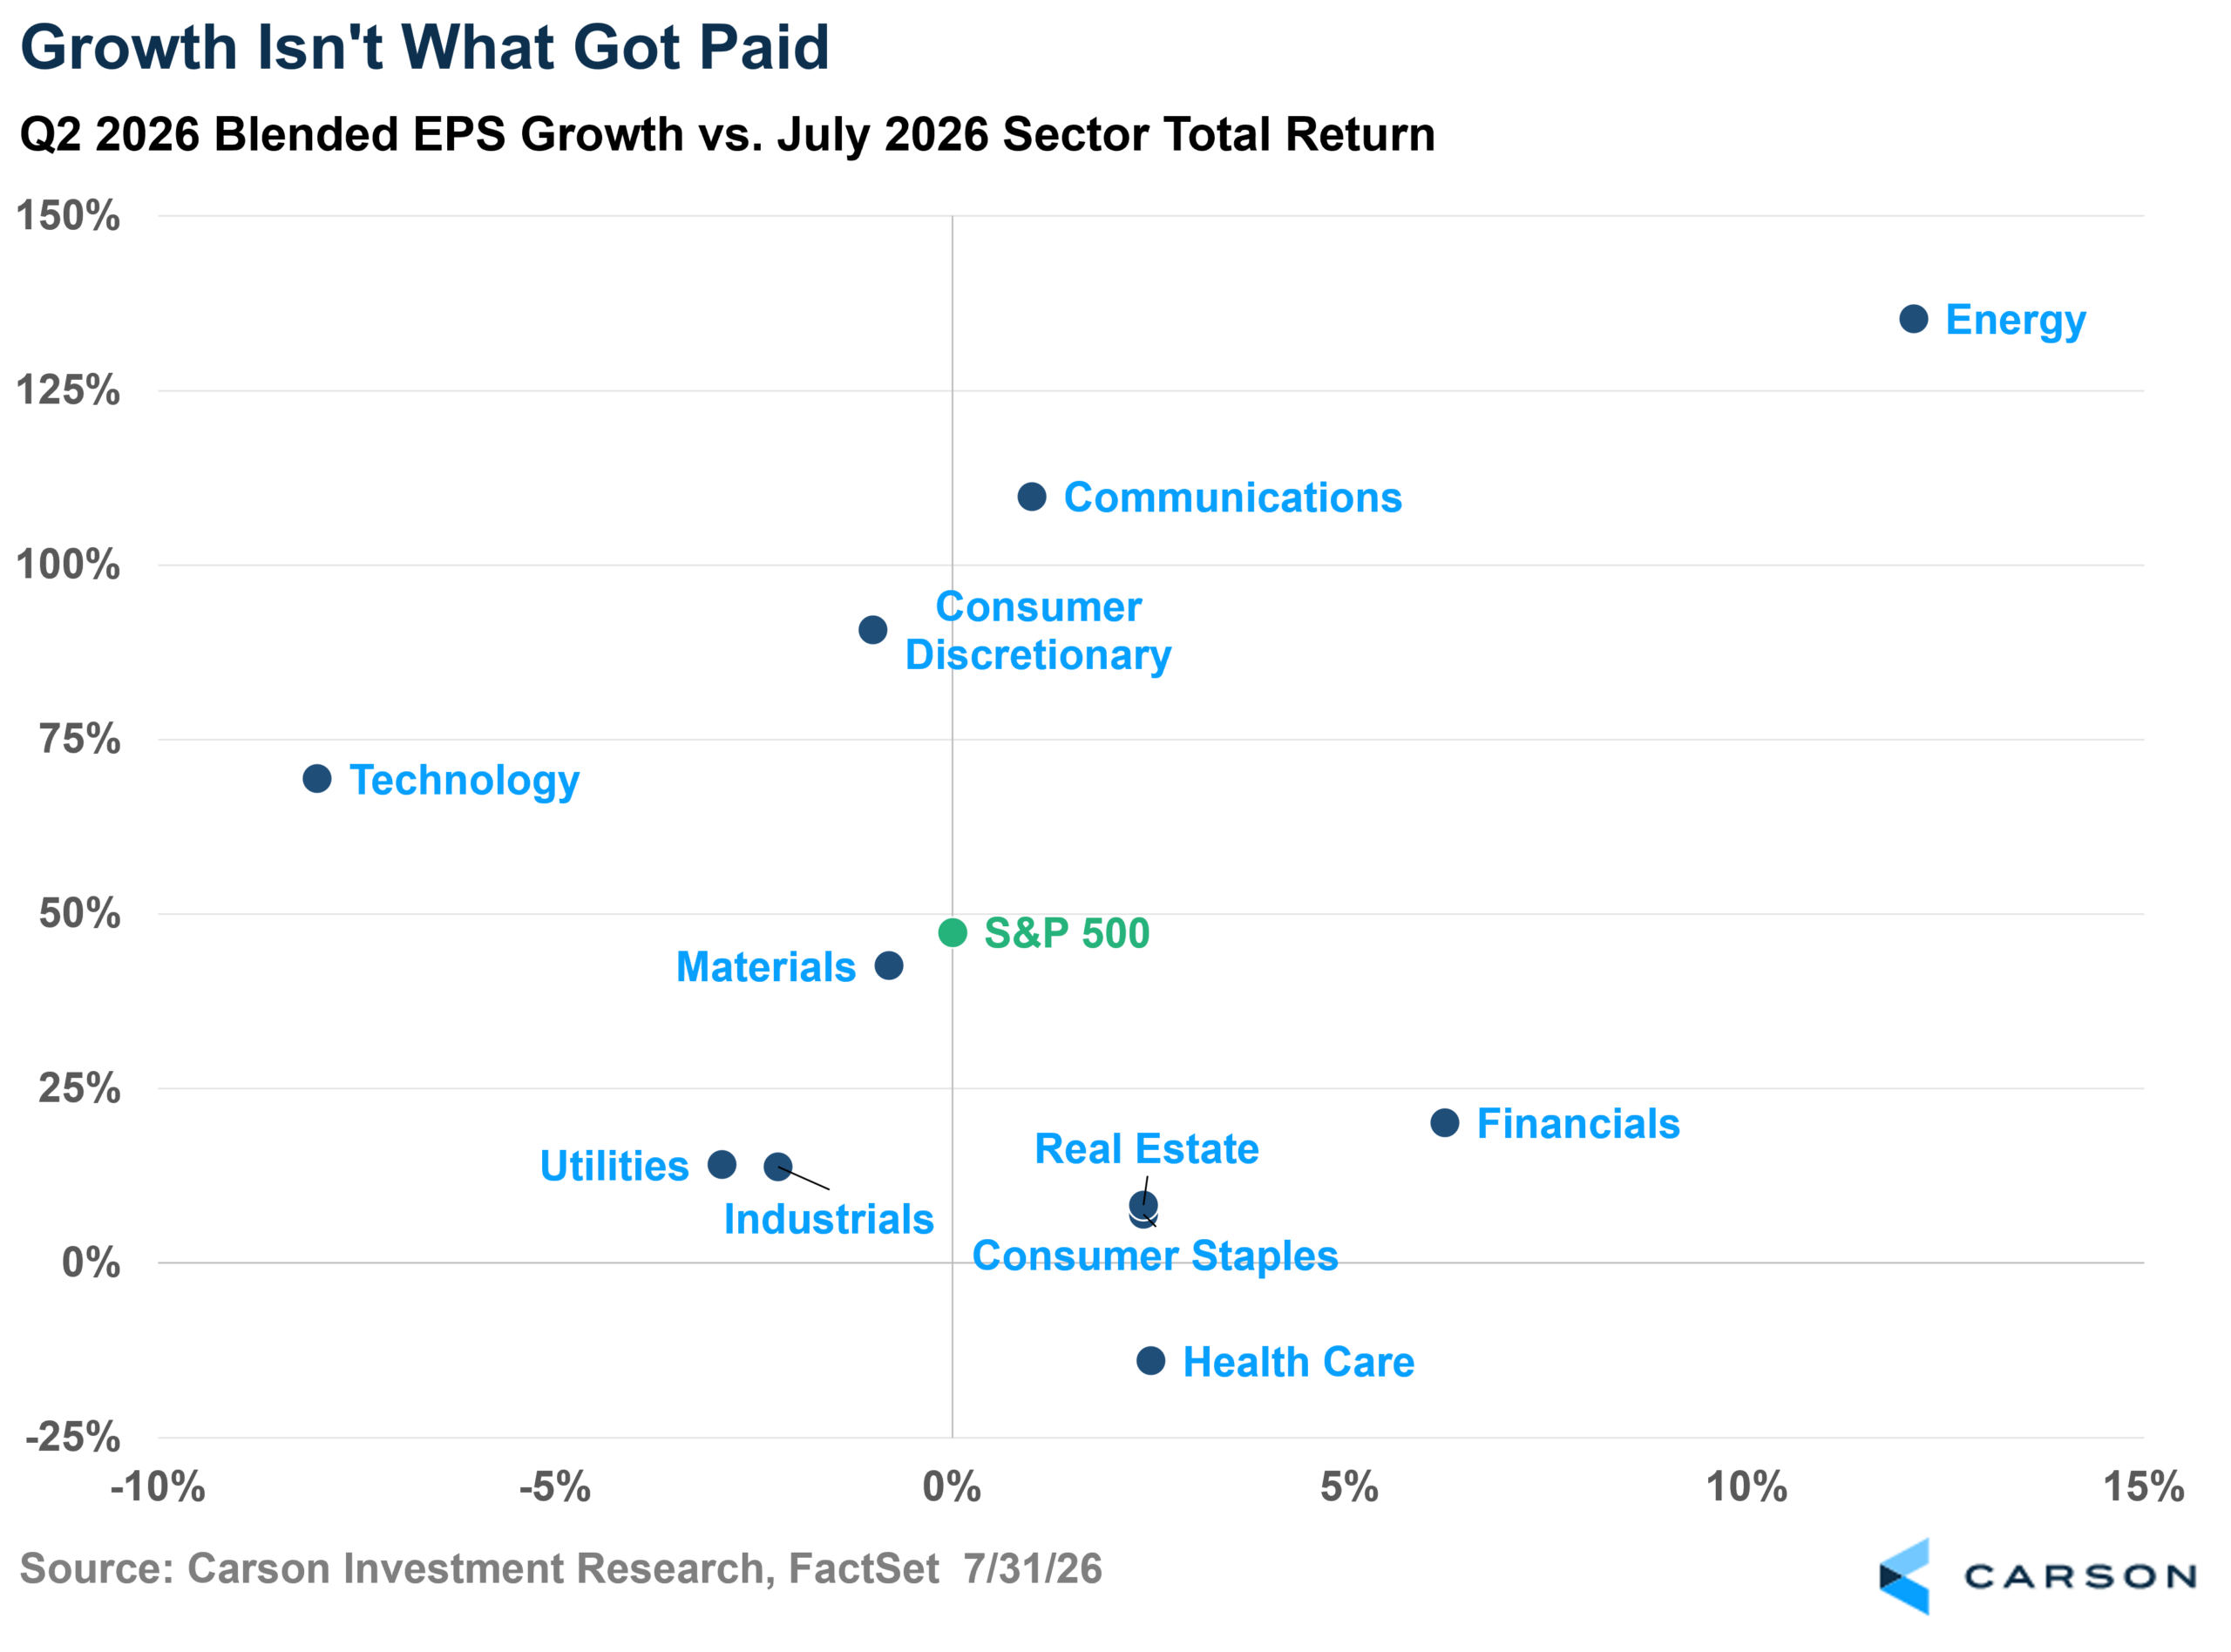
Look at the top-middle of that chart. Communication Services and Consumer Discretionary posted the second- and third-highest earnings growth in the index and finished the month roughly where they started. Energy sits in the top-right, growing earnings faster than anyone and getting paid 12.1% for it. Financials grew 20.1% and gained 6.2%.
Investors saw the same thing inside megacap tech, where the dispersion was violent. Microsoft rose 16% on its report, adding roughly $450 billion in market value in a single day, which is the largest one-day gain for any U.S. company ever! Apple fell 7.4%. Meta fell 8%. Amazon rose 15%.
July also brought a 19-year high in the 30-year Treasury yield and a forced unwind at a levered AI fund. Rates and liquidity may explain part of that tape, but the sorting pattern is hard to miss.
Revenue Is Real, But It’s Also Nominal.
The 14.1% revenue number deserves its own fine print, for a different reason.
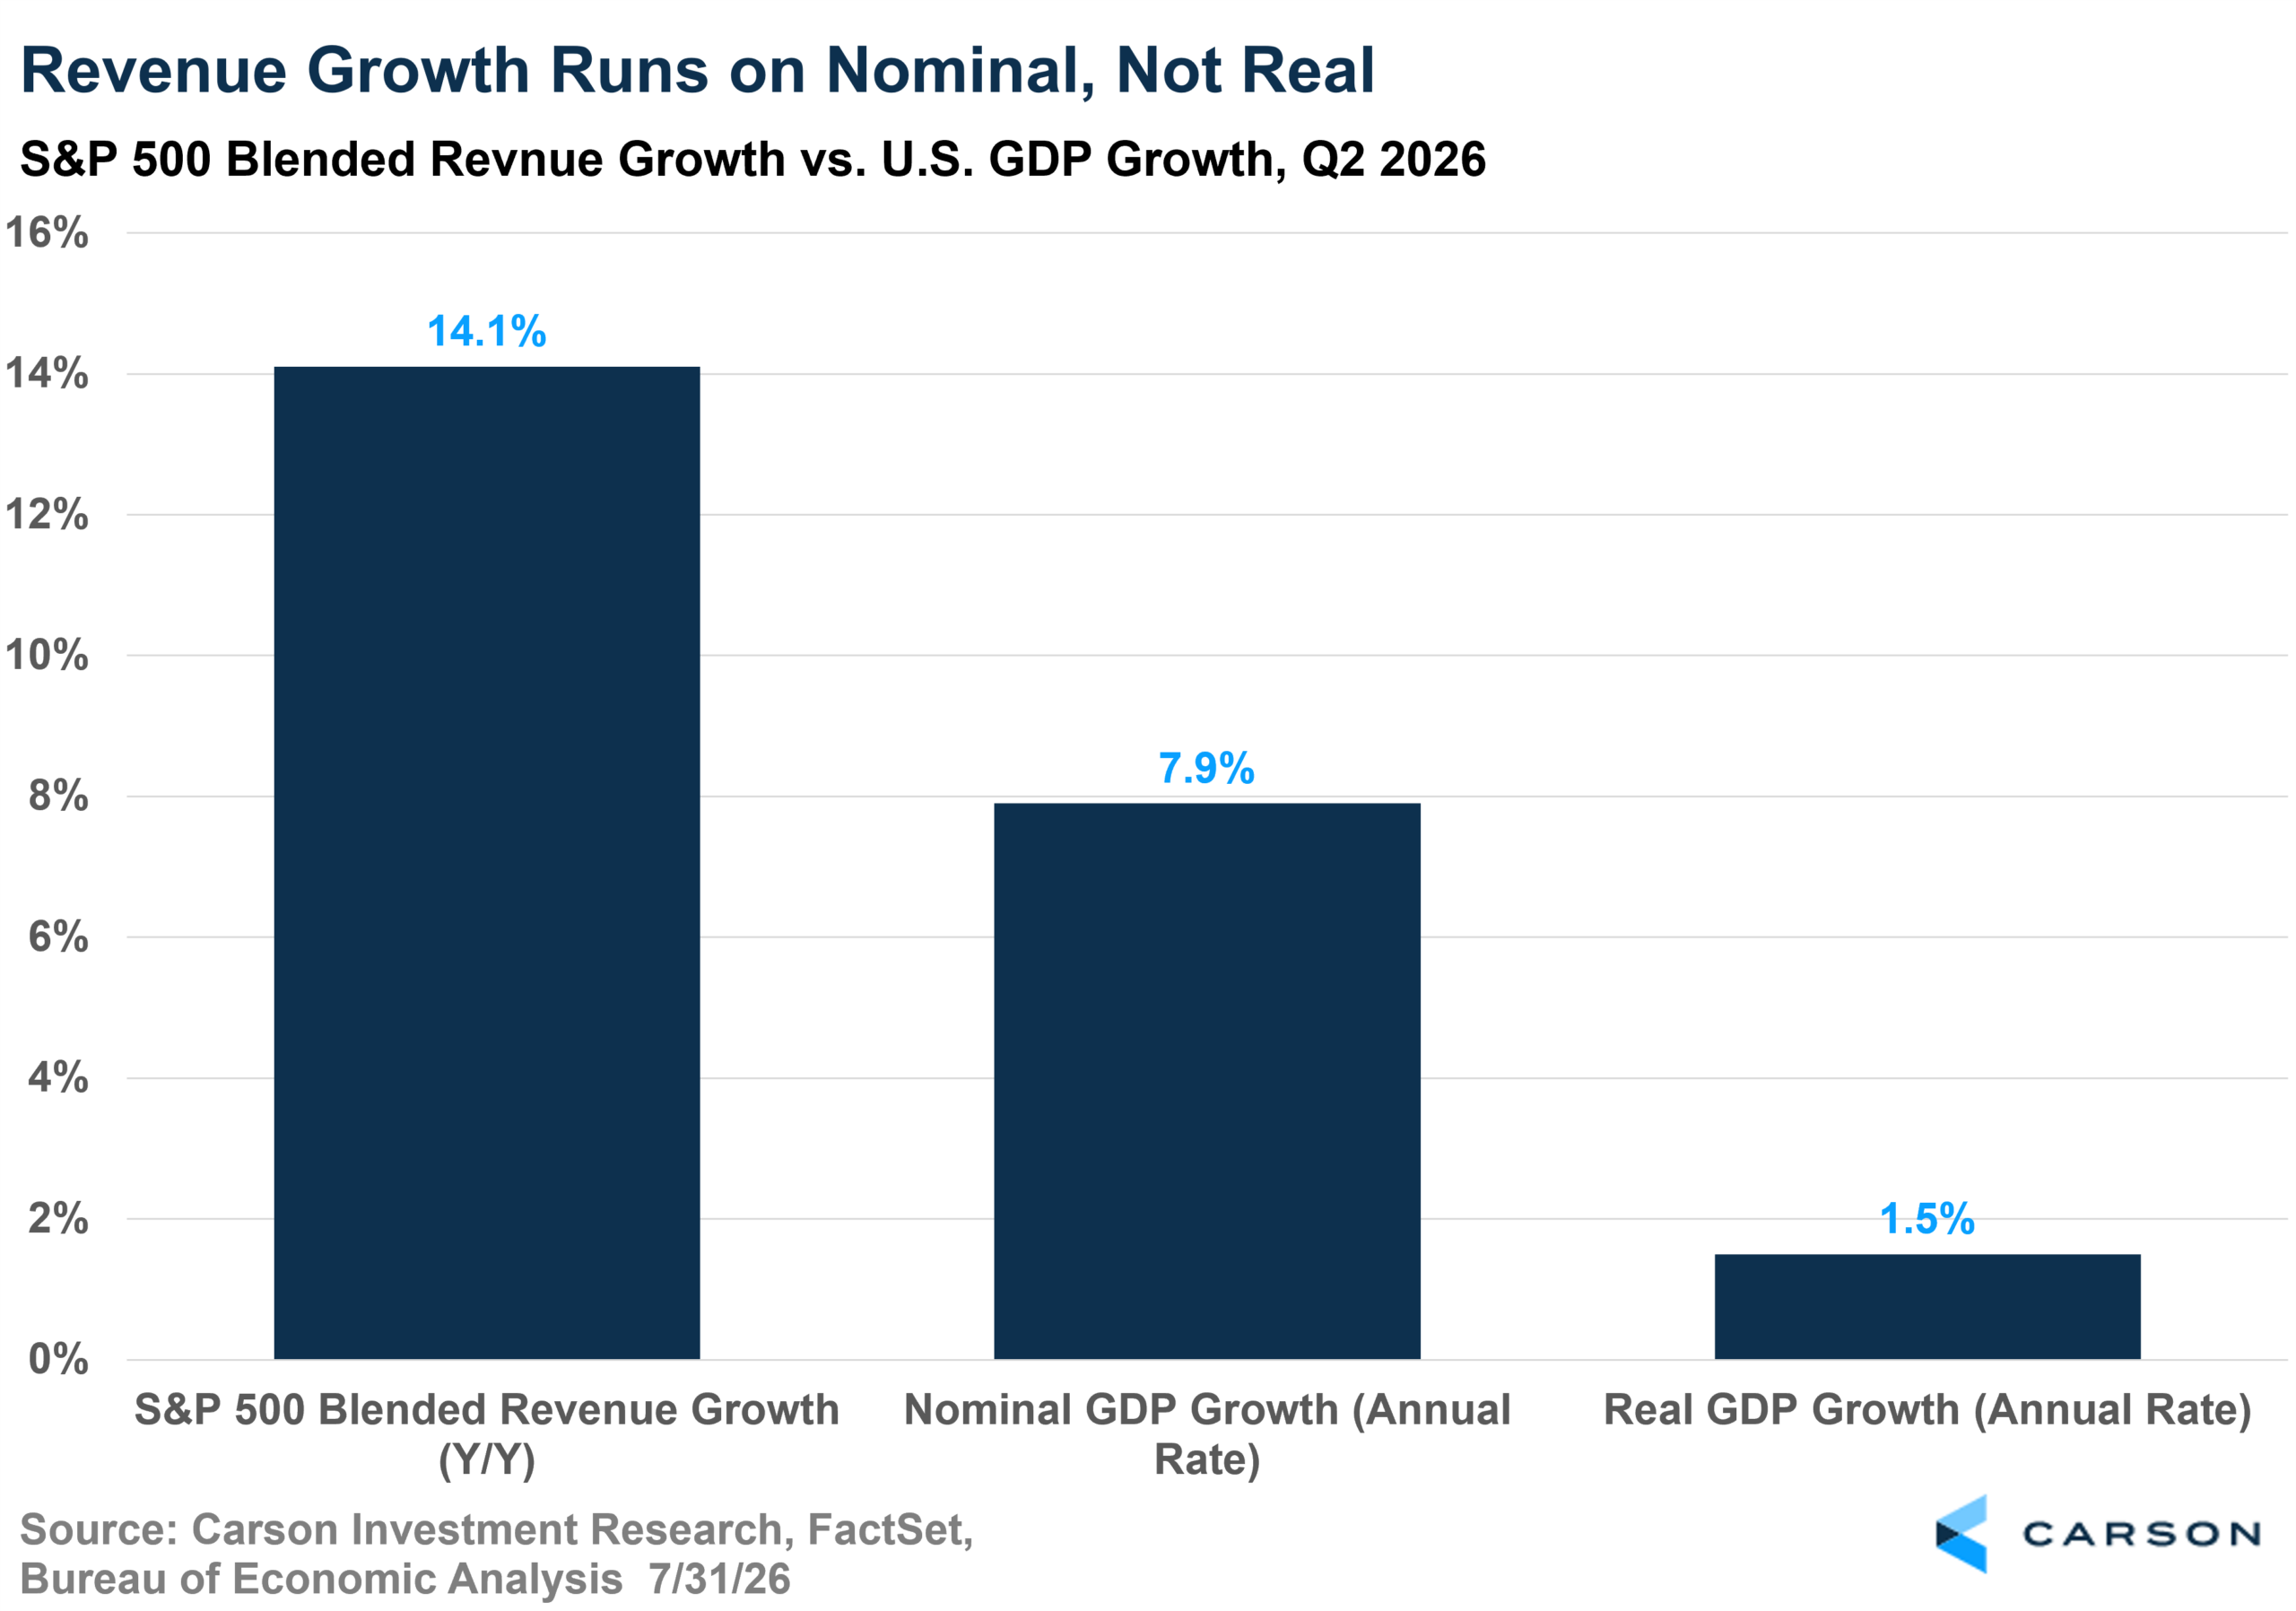
Real GDP grew 1.5% in Q2. Nominal GDP grew 7.9%. Corporate revenue is a nominal number, so a real slice of that 14.1% is price rather than volume. Energy is growing revenue at 31.7% because oil averaged $92.55 versus $63.68 a year ago. Information Technology is growing 35.6% with semiconductors up 77%, in a market where AI hardware is scarce.
That’s big-time revenue. It just isn’t mostly a demand story, and nominal growth pays real bills either way.
Which brings me back to the estimate revisions. If prices across the economy are climbing this fast, analysts raising their dollar EPS estimates might not be a statement about business conditions at all. It could be partly them marking to inflation. I don’t think that’s the whole story, since the raises started back in Q3 2025, before oil moved or Iran was even mentioned. But it does narrow what I’m willing to claim: analysts aren’t doing the thing they normally do at the start of a quarter. That’s different from saying they’ve turned bullish. I’d like to pull that thread properly in a future post, because if a meaningful share of earnings growth is really just price, it changes how much of this cycle we should expect to keep.
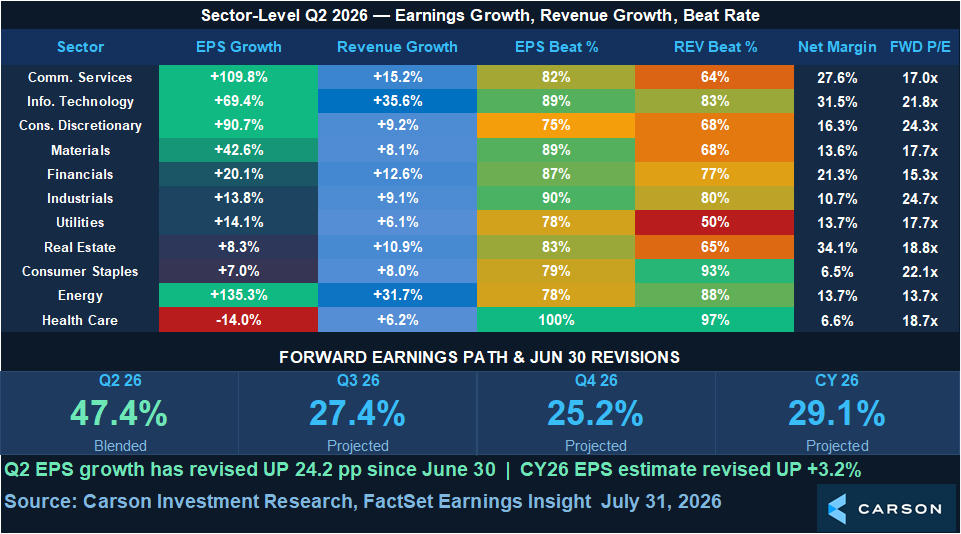
The Sector Scoreboard
Source: Carson Investment Research, Earnings Insight, FactSet 7/31/2026
Two things I keep coming back to:
Health Care is the only sector with falling earnings at -14.0%, and for the third straight week that’s largely an accounting artifact. Analysts are including one-time R&D charges in their estimates for Gilead Sciences and Merck. Excluding those two one-time charges, the sector is expected to grow earnings 11.2% on a more normalized basis. It also has the highest EPS beat rate in the index at 100% and the highest revenue beat rate at 97%. The headline and the business are pointing in opposite directions.
And the concentration inside sectors mirrors the concentration inside the index. Communication Services shows 109.8% growth; without Alphabet it’s a 5.7% decline. Consumer Discretionary shows 90.7%; without Amazon it’s 6.6%. Information Technology shows 69.4%; without semiconductors it’s 33.0%.
Reporting Next Week
136 S&P 500 companies report, including five Dow components, and the concentration is in Health Care. Eli Lilly, Merck, Pfizer, Gilead Sciences, Amgen, and CVS Health all report, meaning the sector currently dragging the index gets its verdict very soon.
McDonald’s, Disney, Caterpillar, AMD, Uber, and ConocoPhillips, among others, are all set to report as well.
Bottom Line
This is a very good quarter with some shaky numbers. Strip the two investment gains, and you still get 28.8% growth, 14.1% revenue growth, a near-record margin, and analysts raising instead of cutting. That’s a strong backdrop by any standard I’d apply.
The market has landed in the same place, which is why I think the best earnings growth in five years produced a flat month. Be back next Tuesday.
By Harry McDonald, Analyst, Investment Research