Stock market concentration has gathered an increasing number of headlines in recent years. Starting with Apple reaching a $1 trillion market capitalization in 2018, “The Four” eventually became the “Magnificent Seven” and all eyes were on these technology and communication giants. Transforming daily life and growing earnings at a rapid pace, these largest stocks have continued to get larger (no doubt fueled in part by index funds—yes, I said it!). Today’s 10 largest stocks represent 33% of the broad market (Russell 3000), and 38% of the closely followed S&P 500. While in the market we always will face uncharted waters, often times the best guide may be the past, and that is where we will begin.
The current level of market concentration is not necessarily new or unique…
When looking back through the history of the U.S. stock market, we have seen similar degrees of market concentration in past periods. The chart below shows sector weights over time, with data back to essentially the beginning of our economy. While that may not be an apt comparison to today’s market, you can see instances of high concentration, particularly in periods of economic boom and technological advancement.
The yellow portion of the chart represents transports –mainly railroads – which dominated the stock market for decades, reaching nearly 63% at peak. Over time, the economy became more balanced but still had periods of concentration. The top 50 stocks of the 1950s and 1960s – the “Nifty 50” – became increasingly large, reaching near the same concentration levels of today’s market. According to Michael Mauboussin and Dan Callahan from Morgan Stanley, the top 10 stocks peaked at 30% of the market in 1963.
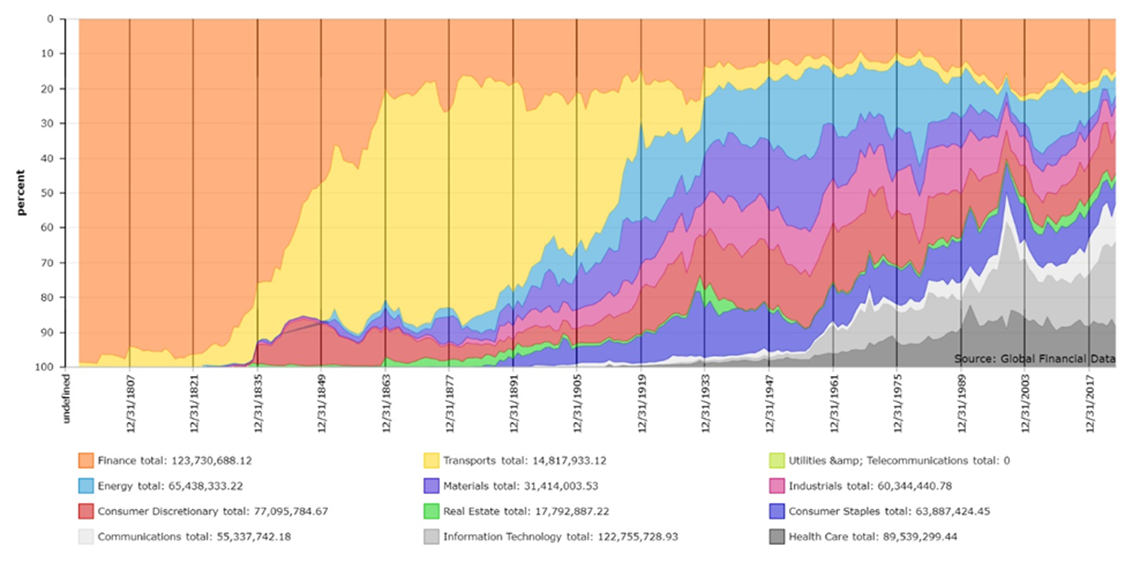
Sources: Finaeon, Global Financial Data https://www.finaeon.com/200-years-of-market-concentration/
The late 1990s and early 2000s saw further technical advancements as the foundation for the internet was laid. The top 10 stocks peaked at just over 26% in 2000, and as has been discussed many times, the companies commanding these large valuations had nowhere near the earnings power of today’s top names.
Stay on Top of Market Trends
The Carson Investment Research newsletter offers up-to-date market news, analysis and insights. Subscribe today!
"*" indicates required fields
…Especially when compared to markets overseas
Concentration is not at all a U.S.-only phenomenon. In fact, as Sonu wrote earlier this year, many countries are far more concentrated than our market. Yes, the number of stocks in their markets is smaller but that doesn’t change the basic point. The chart below shows the top 10 countries by market cap (averaged over the period) and their current and historical level of concentration. Our market has consistently been towards the bottom of the chart over the past 20 years.
That said, our financial markets are the largest and deepest in the world, so there should be an expectation for a diversified set of publicly traded companies. It is also important to keep in mind that the rise of private markets has created an environment for financing that limits the need for companies to go public. There are more than 1,000 private equity-backed “unicorn” companies in the U.S. with a valuation of more than $1 billion, and many more even larger private companies. While there is no certainty that these companies will ever go public (and therefore affect market indexes), there is an economic diversification present that did not exist in the past.
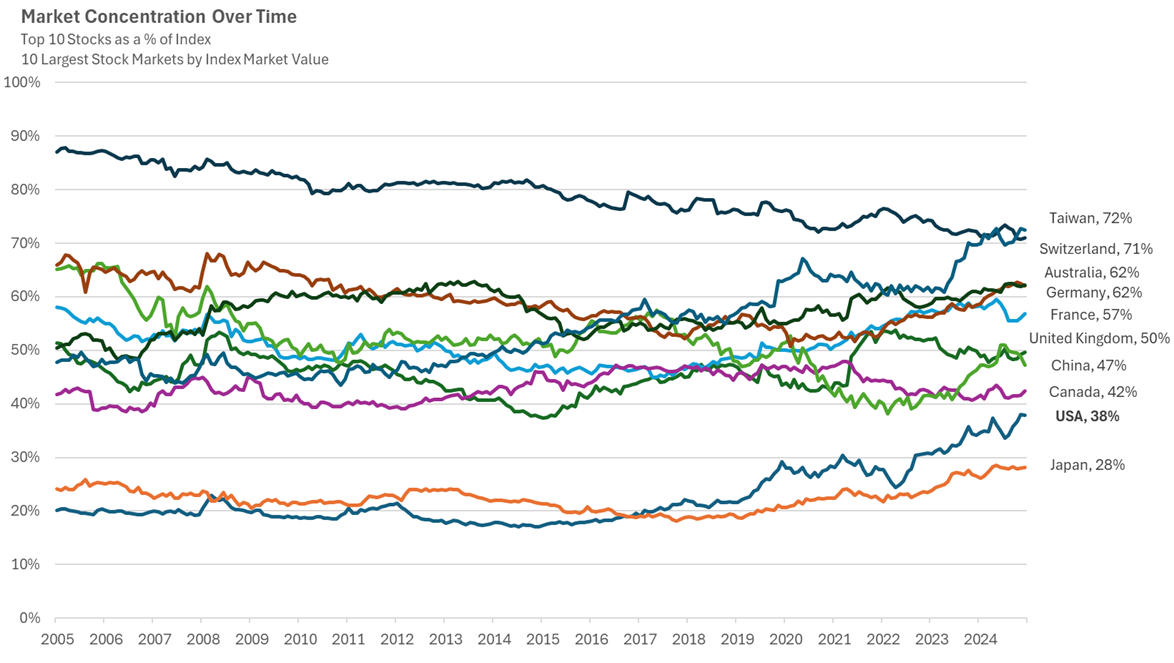
Sources: Carson Investment Research, Morningstar, MSCI
MSCI Country Indices used except for S&P 500 for US market
Market concentration extremes have implications for portfolios
What does all this mean going forward? As simple as it sounds, there is really only one way for concentration to be reduced – the top stocks have to underperform the other 490 (without more of those 490 names becoming disproportionately large). Unfortunately, it is nearly impossible to predict when this might occur, but historically it always has – and there are investment implications. A decrease in market concentration favors really any companies besides the largest ones. Small and mid-cap companies, equal-weighted strategies and indices, and importantly active managers all tend to outperform as the market broadens. For diversification reasons, active managers are typically under-exposed to the largest names, and if those names outperform everything else they face a tough climb. As the chart below shows, in periods where concentration peaks and begins to decline, equal weight (which correlates very closely to small-, mid-cap, and active equity managers) outperforms, often, for many years.
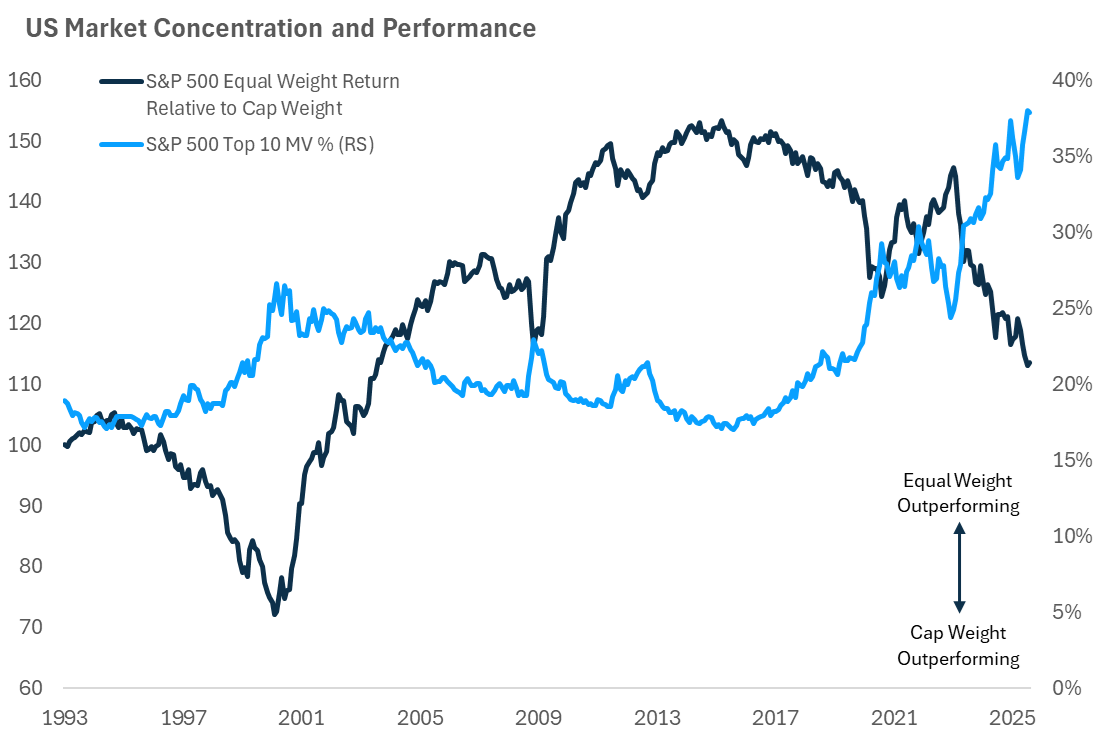
Sources: Carson Investment Research, Factset, Morningstar
The biggest and best companies do not stay that way forever. Competition, technological advances, ever-growing expectations, and many other factors contribute to the decline of corporations over time. Even in the short term, no stock is immune from the need to diversify. (Nvidia fell 43% peak-to-trough just a few months ago!) Market concentration will likely always be present in some form, especially in times of rapid technological advancement.
As the latest technological change (A.I.) spreads across the economy, keep an eye on this often neglected and sometimes spurned parts of the market.
8356353.1.-09Sept2025A
For more content by Grant Engelbart, VP, Investment Strategist click here.
