
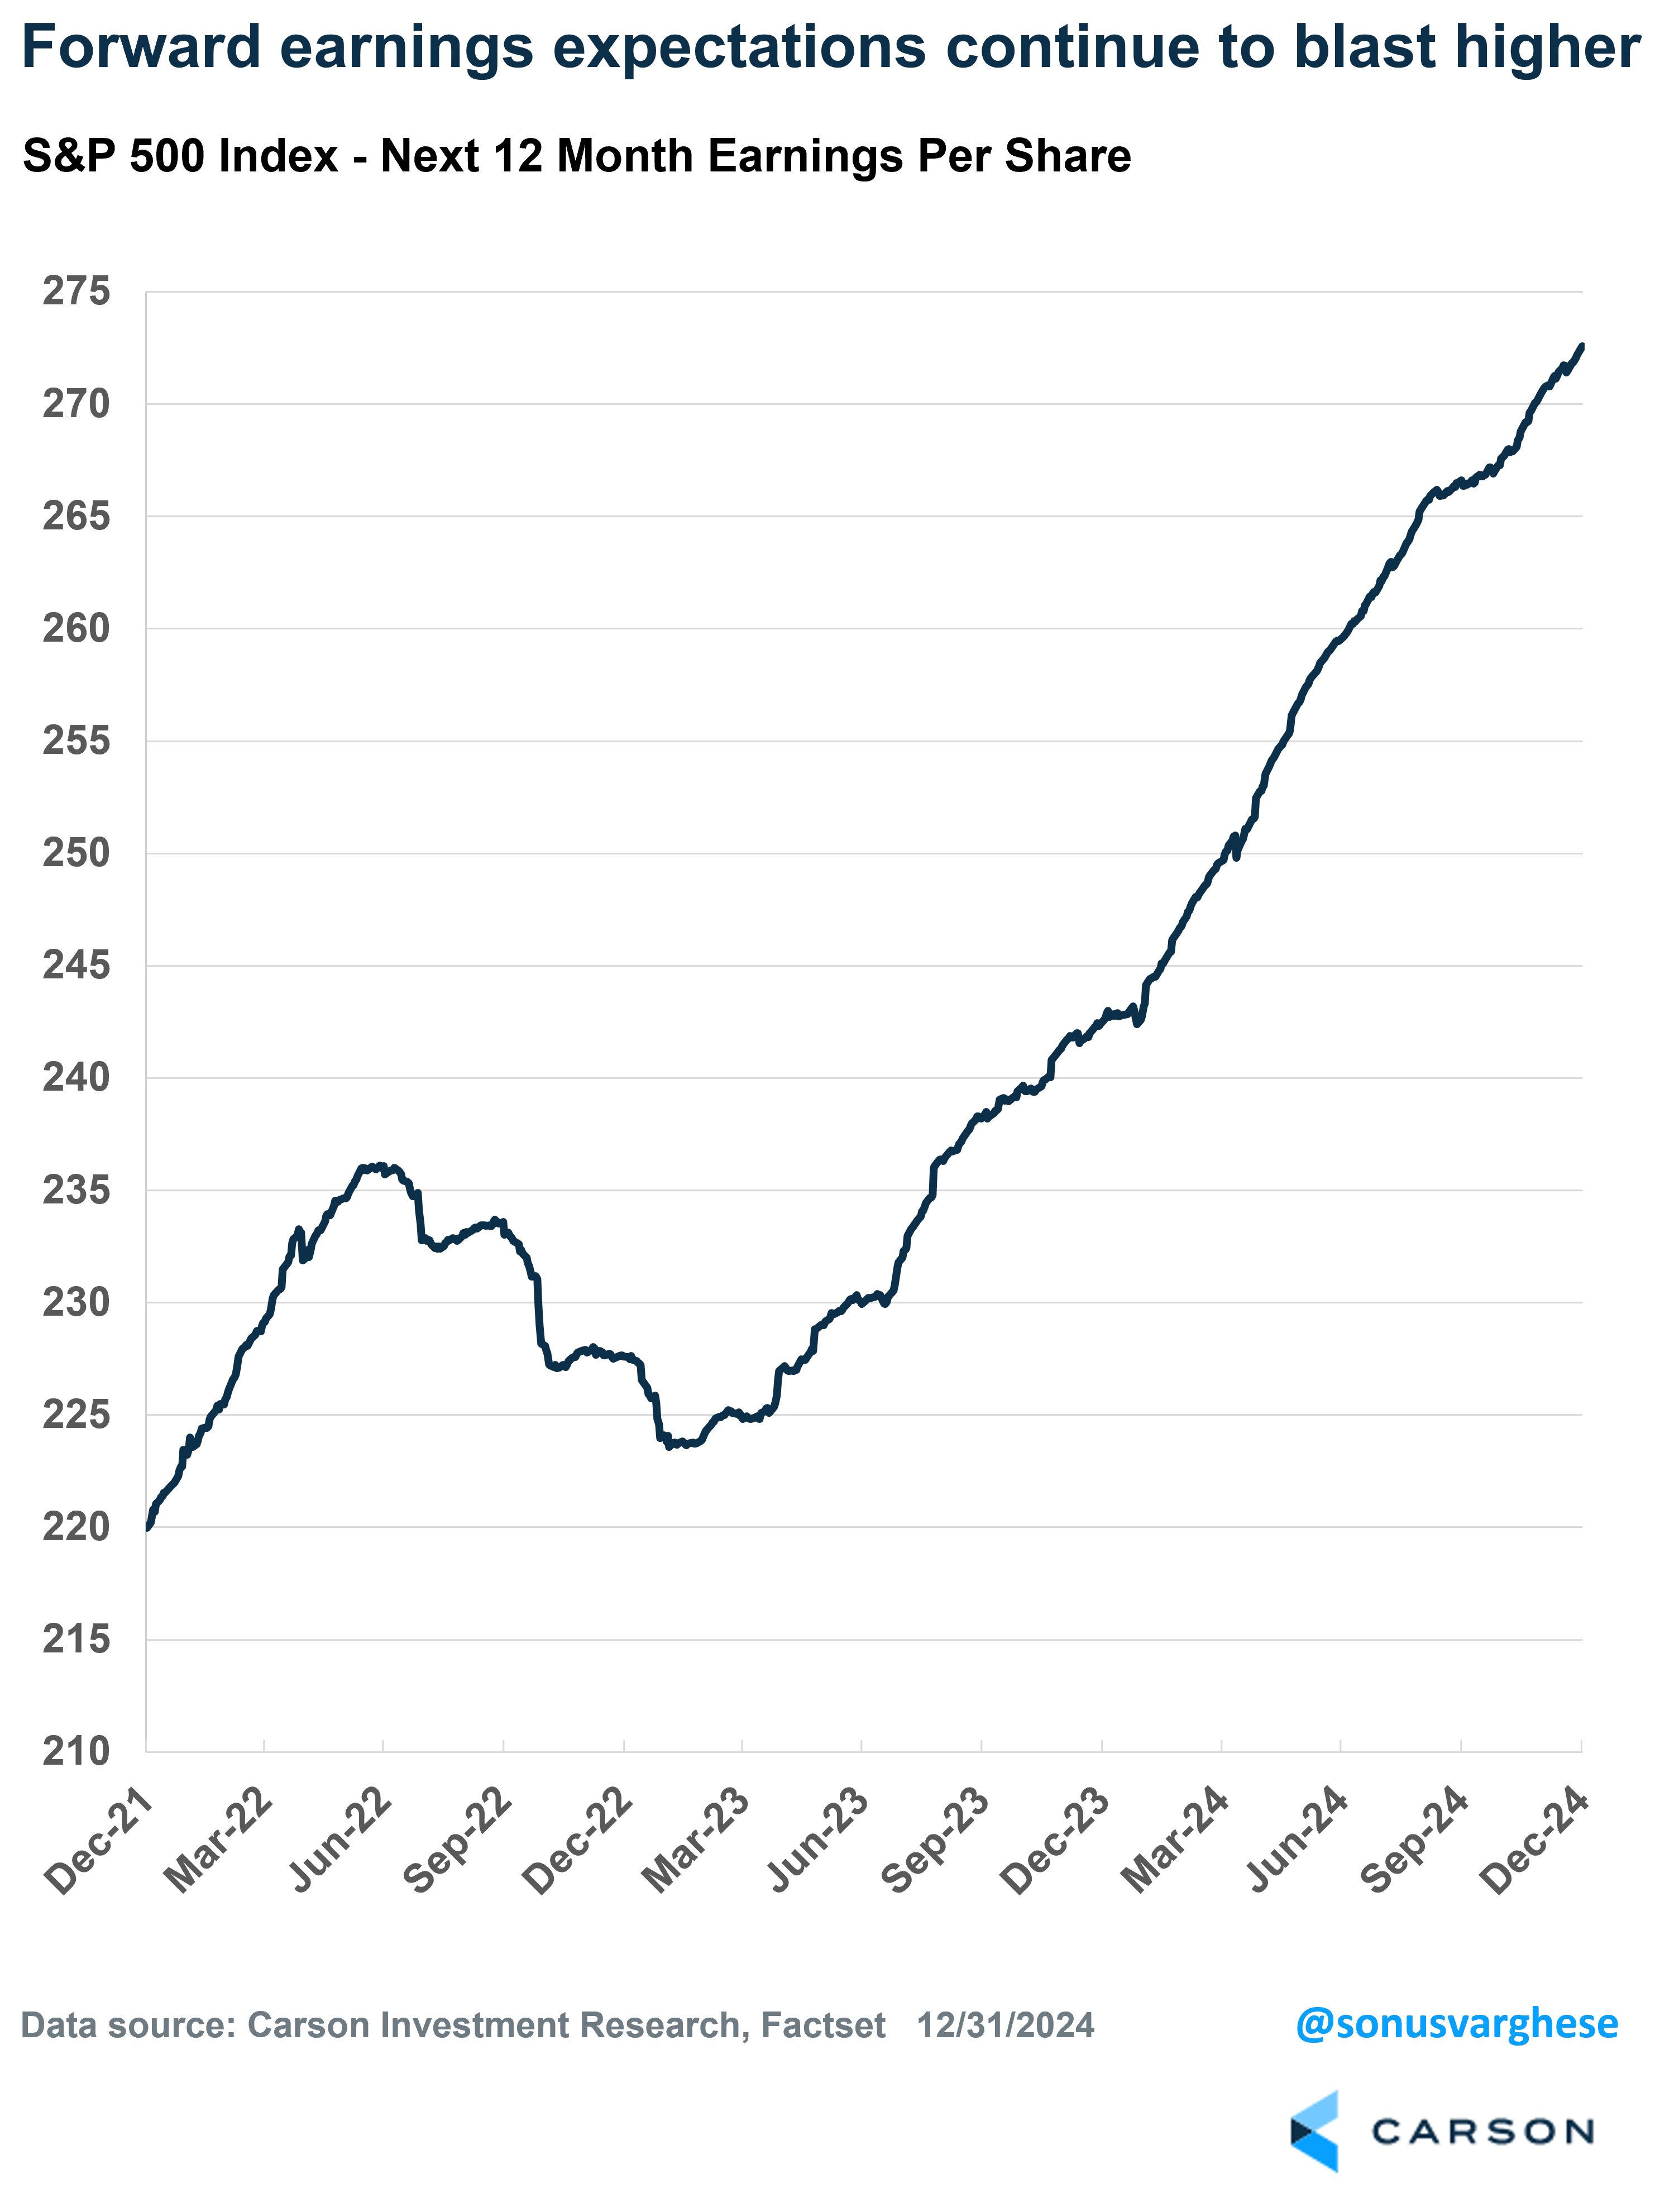
The S&P 500 followed up on 2023’s 26.3% total return with a 25% return in 2024. And unlike in 2023, this was largely a story of rising profits, and expectations of profit growth continuing. The S&P 500’s forward 12-month earnings per share ended the year at $272, a 12.4% increase from its value of $242 a year ago. That’s the largest year-over-year gain since 2021’s 34% jump (which came on the back of a 6% pullback in 2020).
Profits Drove Most of the Returns
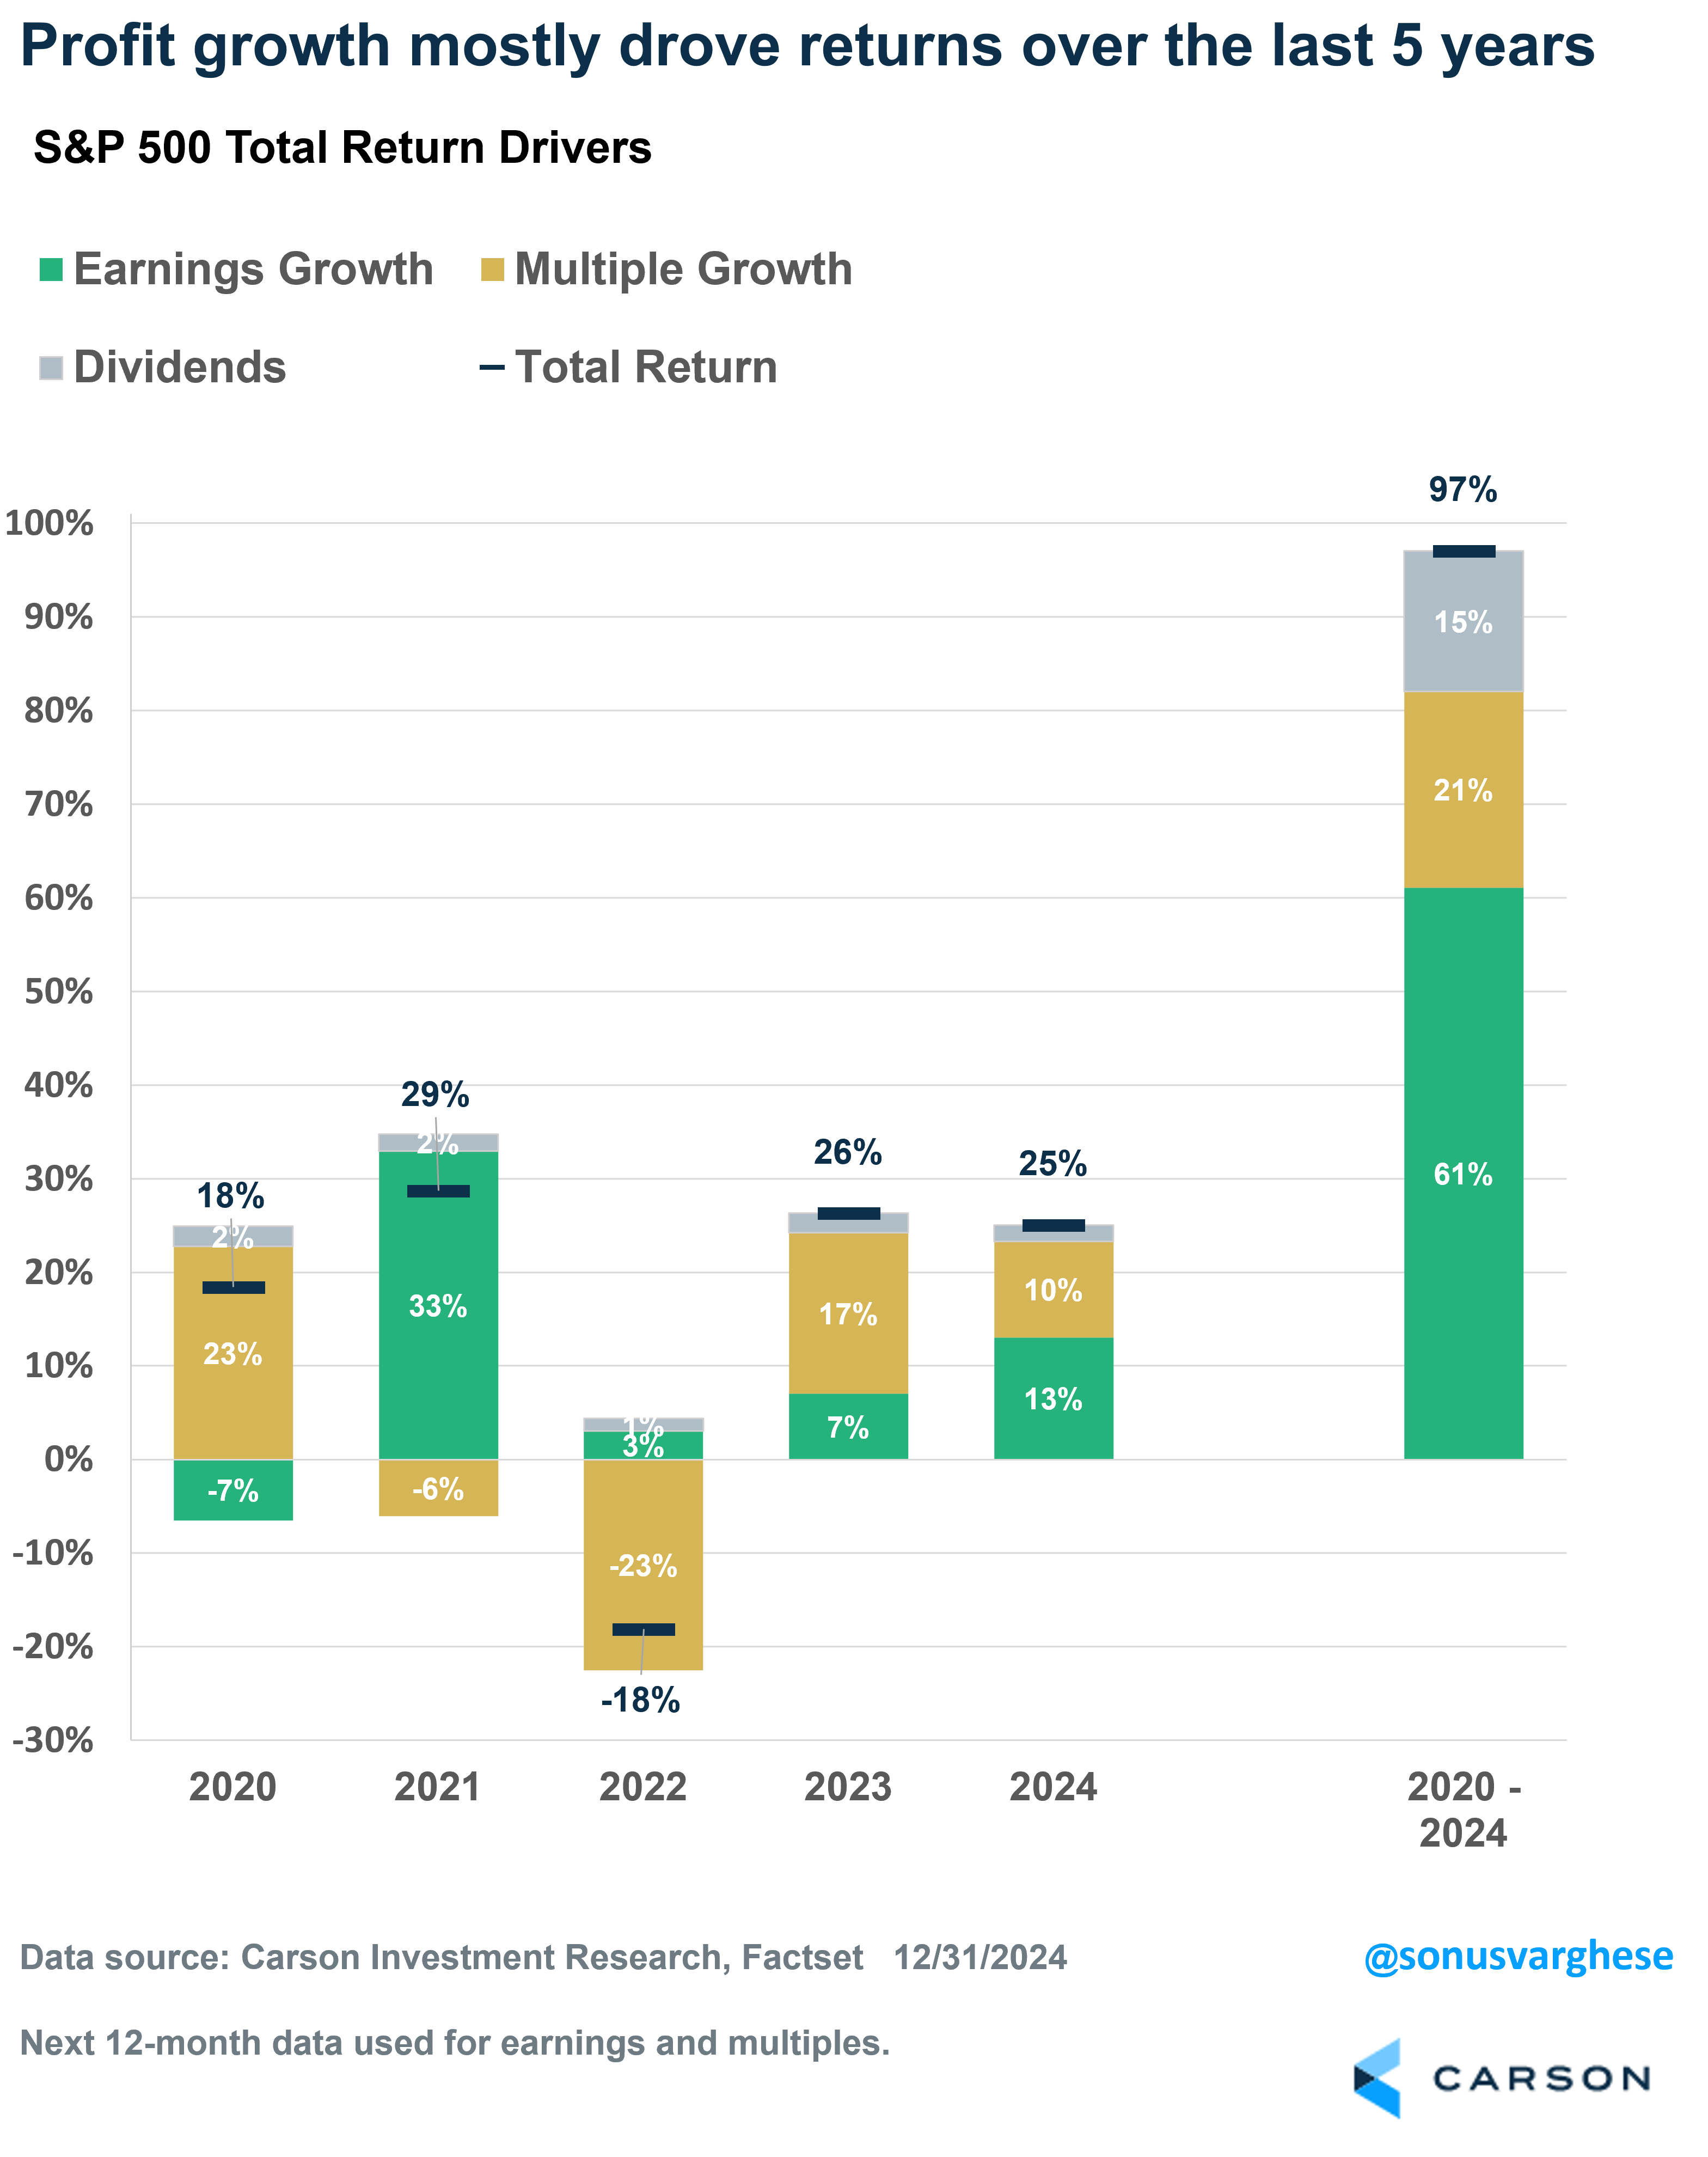
As I’ve noted in the past, we can separate the S&P 500’s total return into contributions from, 1) earnings growth, 2) multiple change (valuations), and 3) dividends. Here’s how the S&P 500’s 25% return in 2024 broke down:
- Earnings growth contribution: +13%-points
- Multiple growth contribution: +10.3%-points
- Dividends: +1.7%-points
In short, almost 15%-points of the index’s return in 2024 came from profits, both retained and distributed (as dividends to shareholders). Zooming back over the past 5 years (2020-2024), the S&P 500 has gained 97% — amid a global pandemic, two bear markets, 40+ year highs in inflation, and an ultra-aggressive Federal Reserve. That 97% return can be broken down into:
- Earnings growth: 61%-points
- Multiple growth: +21%-points
- Dividends: +15%-points
It was mostly about profit growth, but also dividends, which when reinvested and compounded year after year contributed almost the same as multiple growth.
An Even Better Story: Margin Expansion
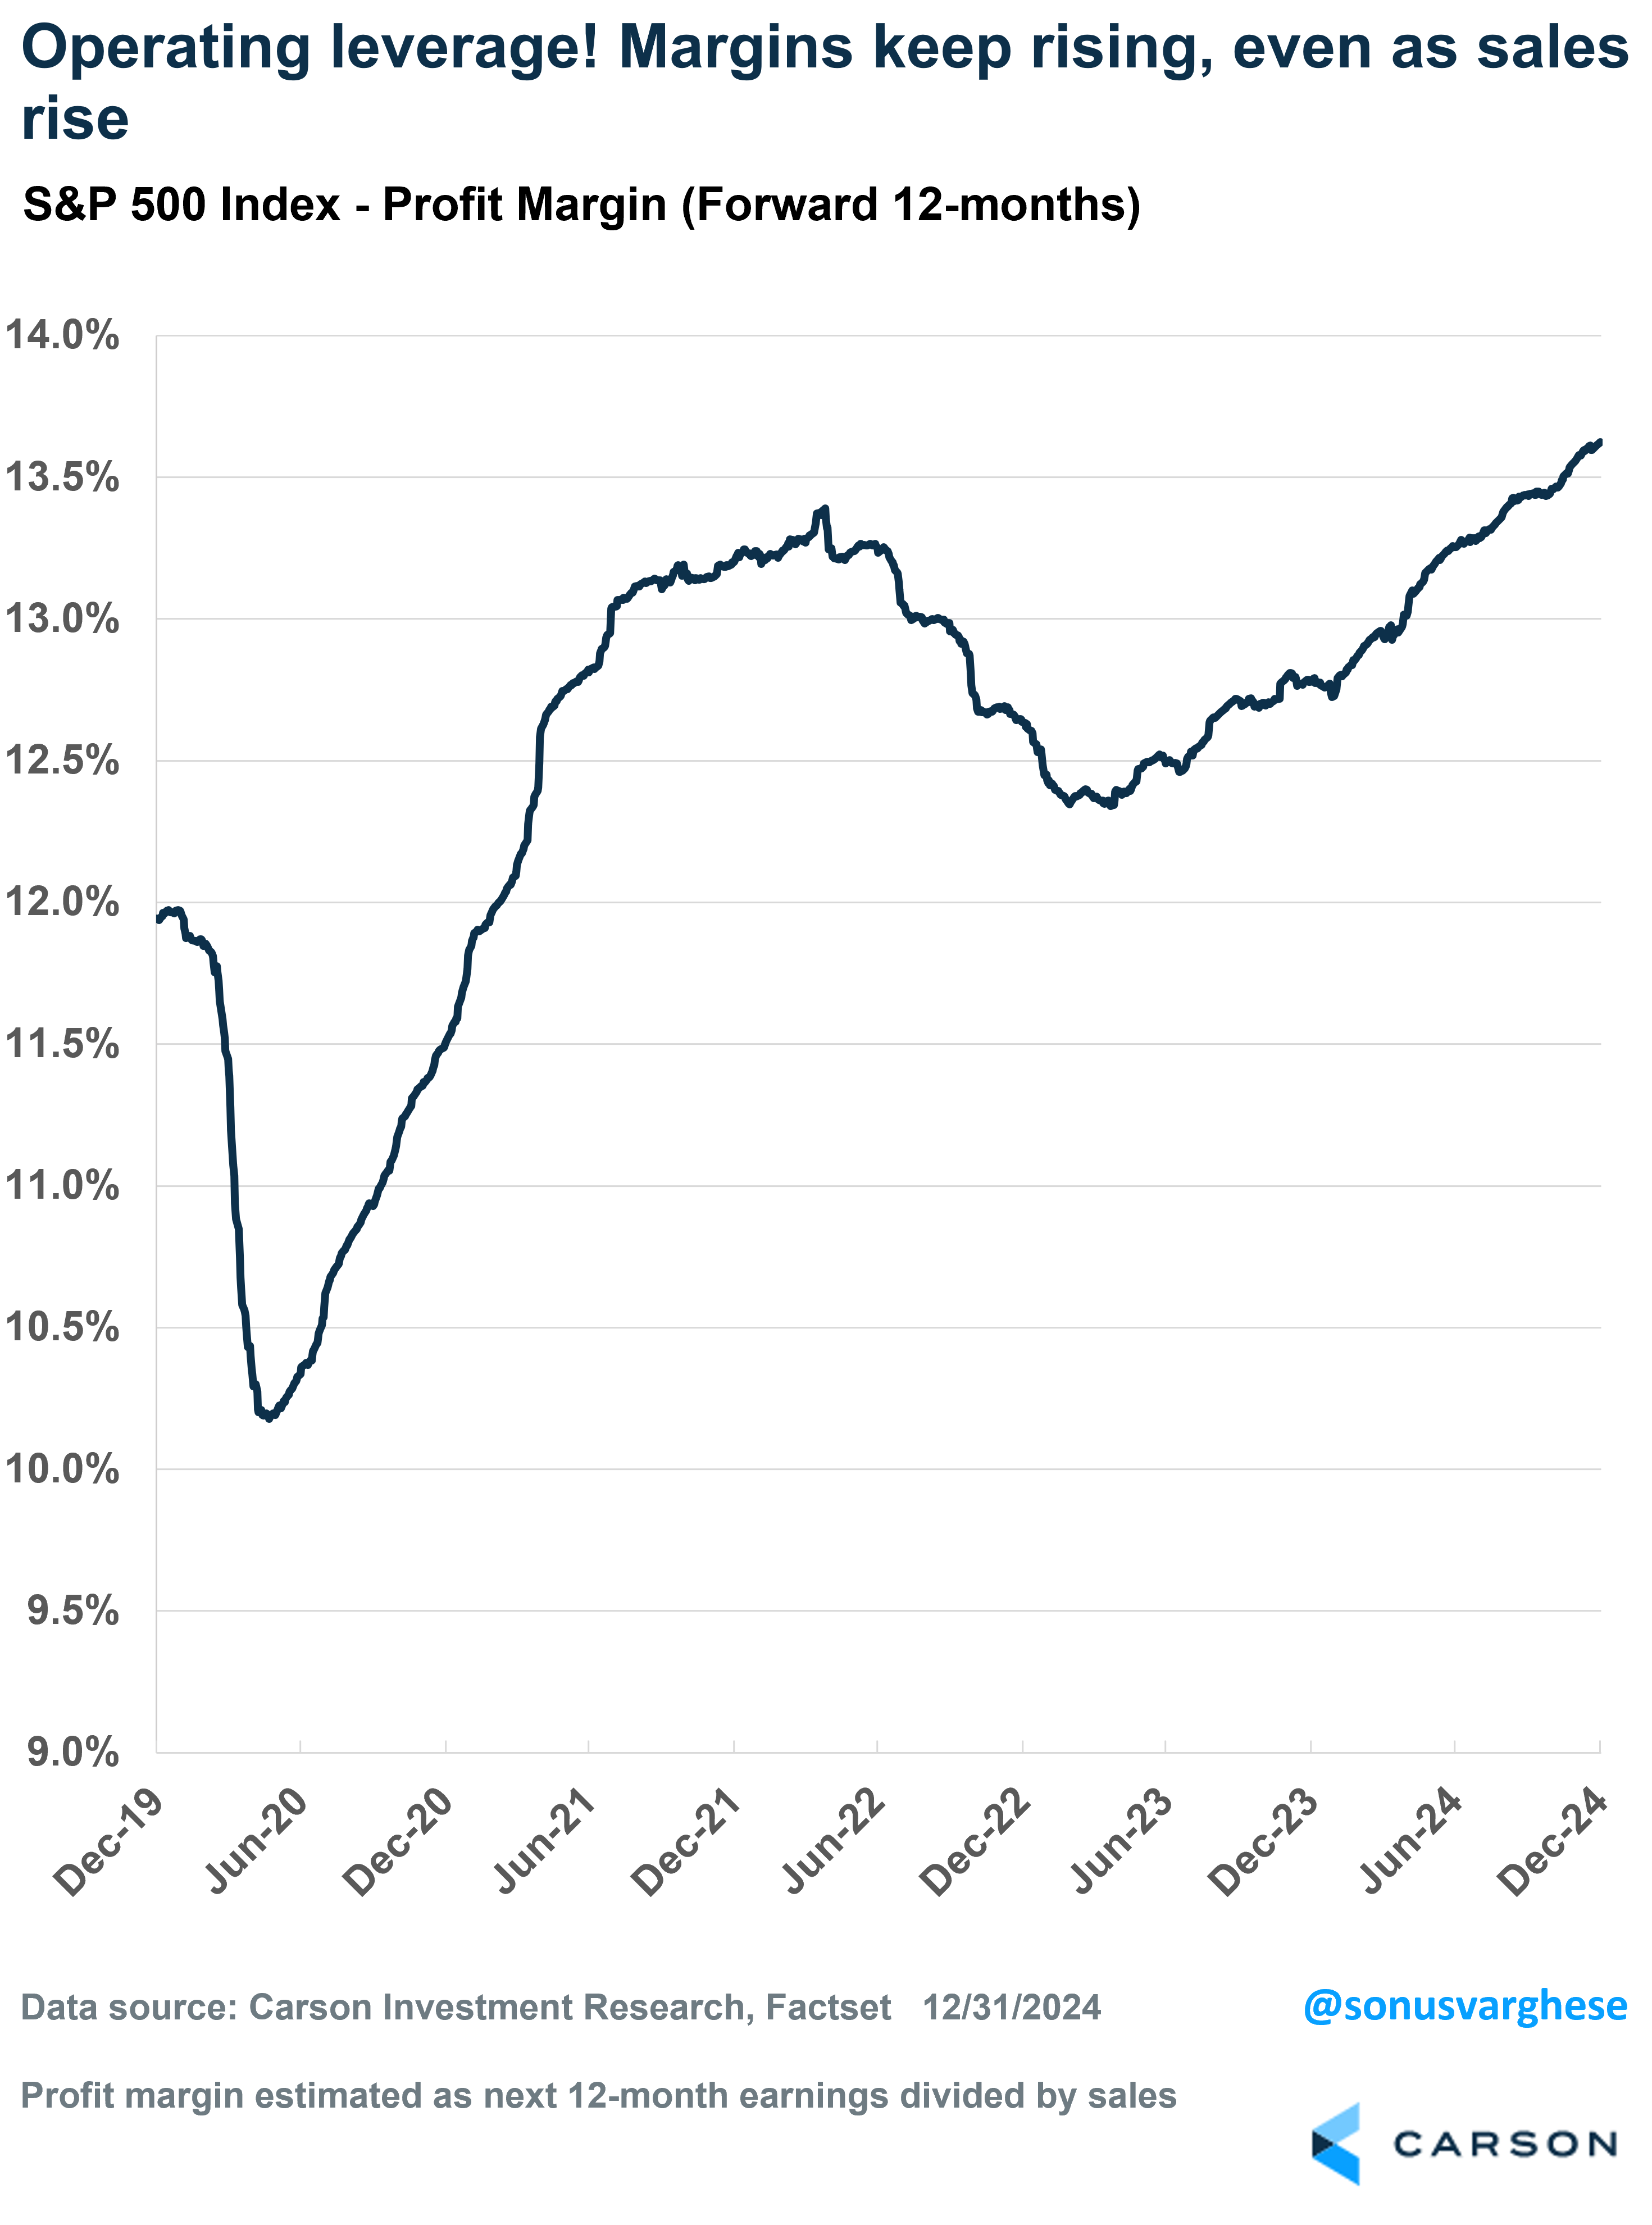
Margin expectations have continued to rise across 2024, finishing the year at 13.6%, the highest on record for this series. It was 12.8% at the end of 2023, and before the pandemic it was 11.9%. Below we’ll see how this has powered the S&P 500 in 2024 and drove most of profit growth (even more than sales).
The key here is “operating leverage” increasing after a tough 2022. Operating leverage allows firms to expand margins as sales grow. And corporate America now has a lot more operating leverage, thanks to a lot of cost cutting in 2022 — especially variable costs. 2022 was a year of low productivity, as firms felt the blowback of over-hiring and over-spending in 2020-2021. Sales grew but margins fell, and so corporate America pulled back. However, getting more conservative bore fruit in 2023, as sales grew and margins expanded, i.e. more “operating leverage.” This also showed up in rising economy-wide productivity. It continued into 2024 and is positive for earnings/margins going forward. Not to mention aggregate productivity.
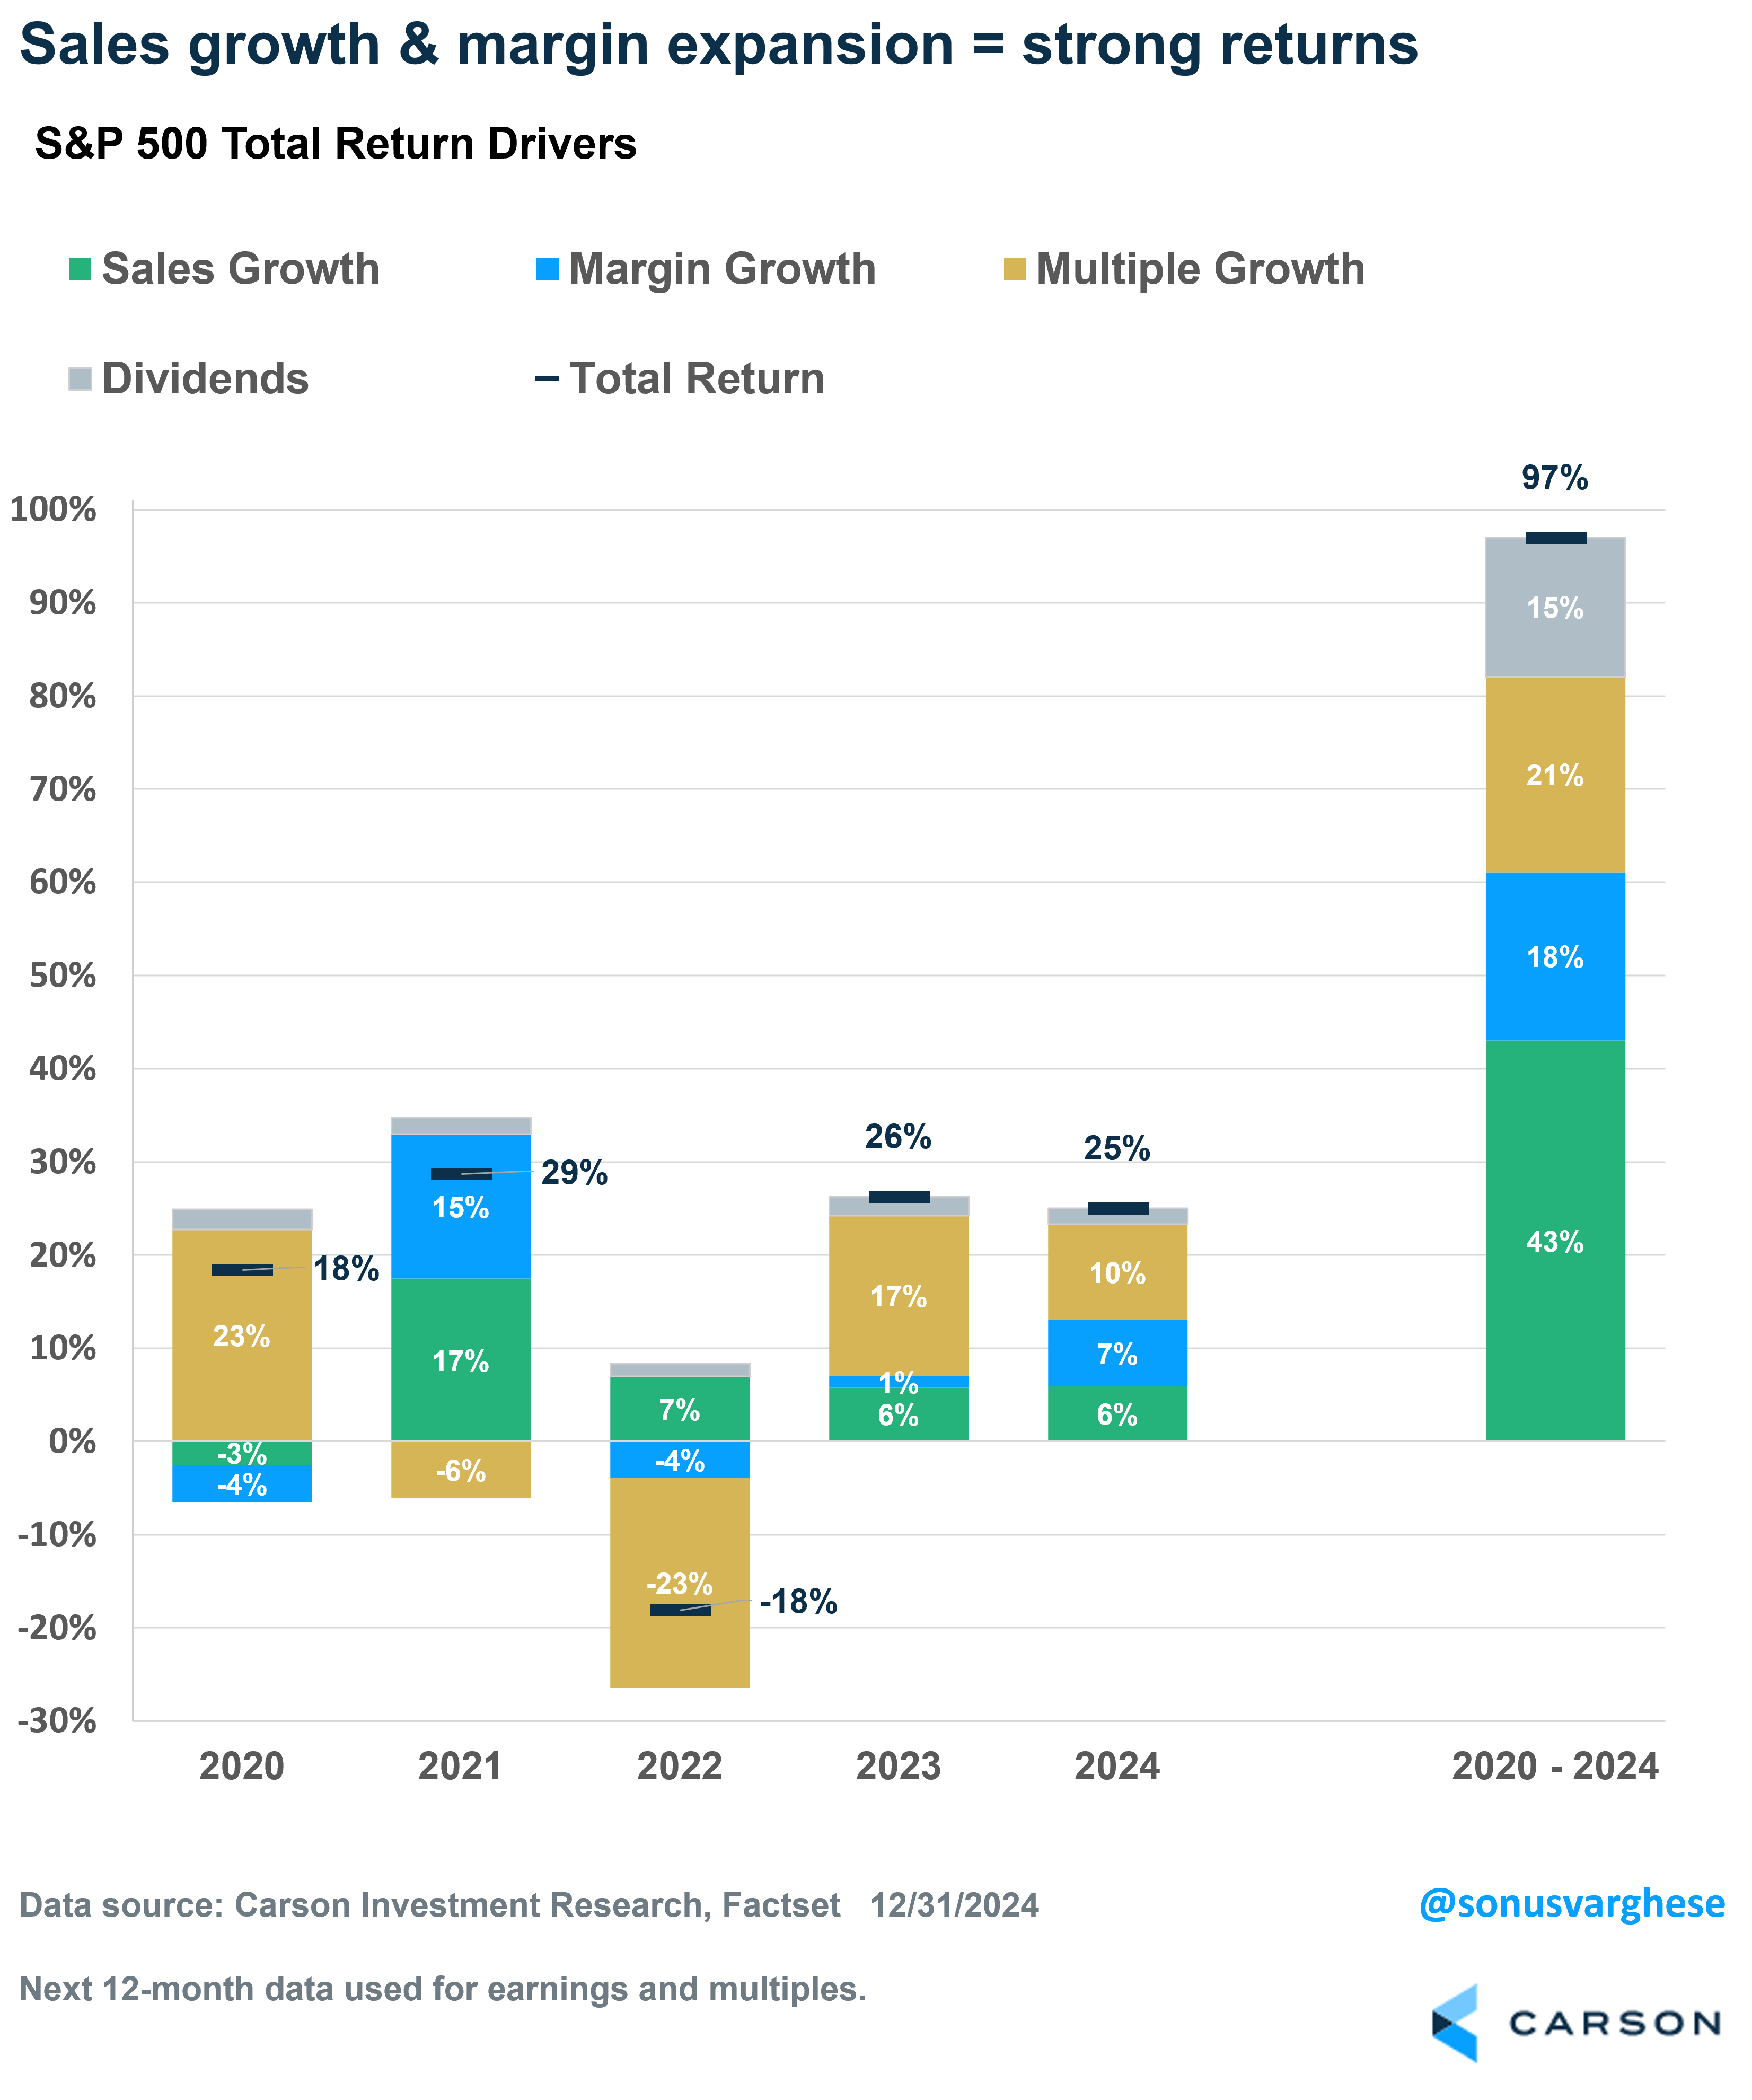
Coming back to the drivers of S&P 500 returns, we can separate the earnings growth component into two pieces: sales growth and margin expansion. With that, here’s the breakdown for the S&P 500’s 25% return in 2024:
- Sales growth contribution: +6%-points
- Margin expansion: +7% points
- Multiple growth contribution: +10.3%-points
- Dividends: +1.7%-points
Returns were powered by a really strong corporate sector and a strong economy. Sales are rising thanks to strong nominal GDP growth (~ 4.5 – 5%). But margins are also expanding thanks to operating leverage.
Here’s the full 5-year picture (2020 – 2024):
- Sales growth contribution: +43%-points
- Margin expansion: +18% points
- Multiple growth contribution: +21%-points
- Dividends: +15%-points
None of this is what you’d see amid a bubble. Yes, valuations are up, but it’s still below what we saw in 2020-2021. The S&P 500’s forward P/E ratio finished 2024 at 21.6x, almost exactly where it was at the end of 2021 (21.7x).
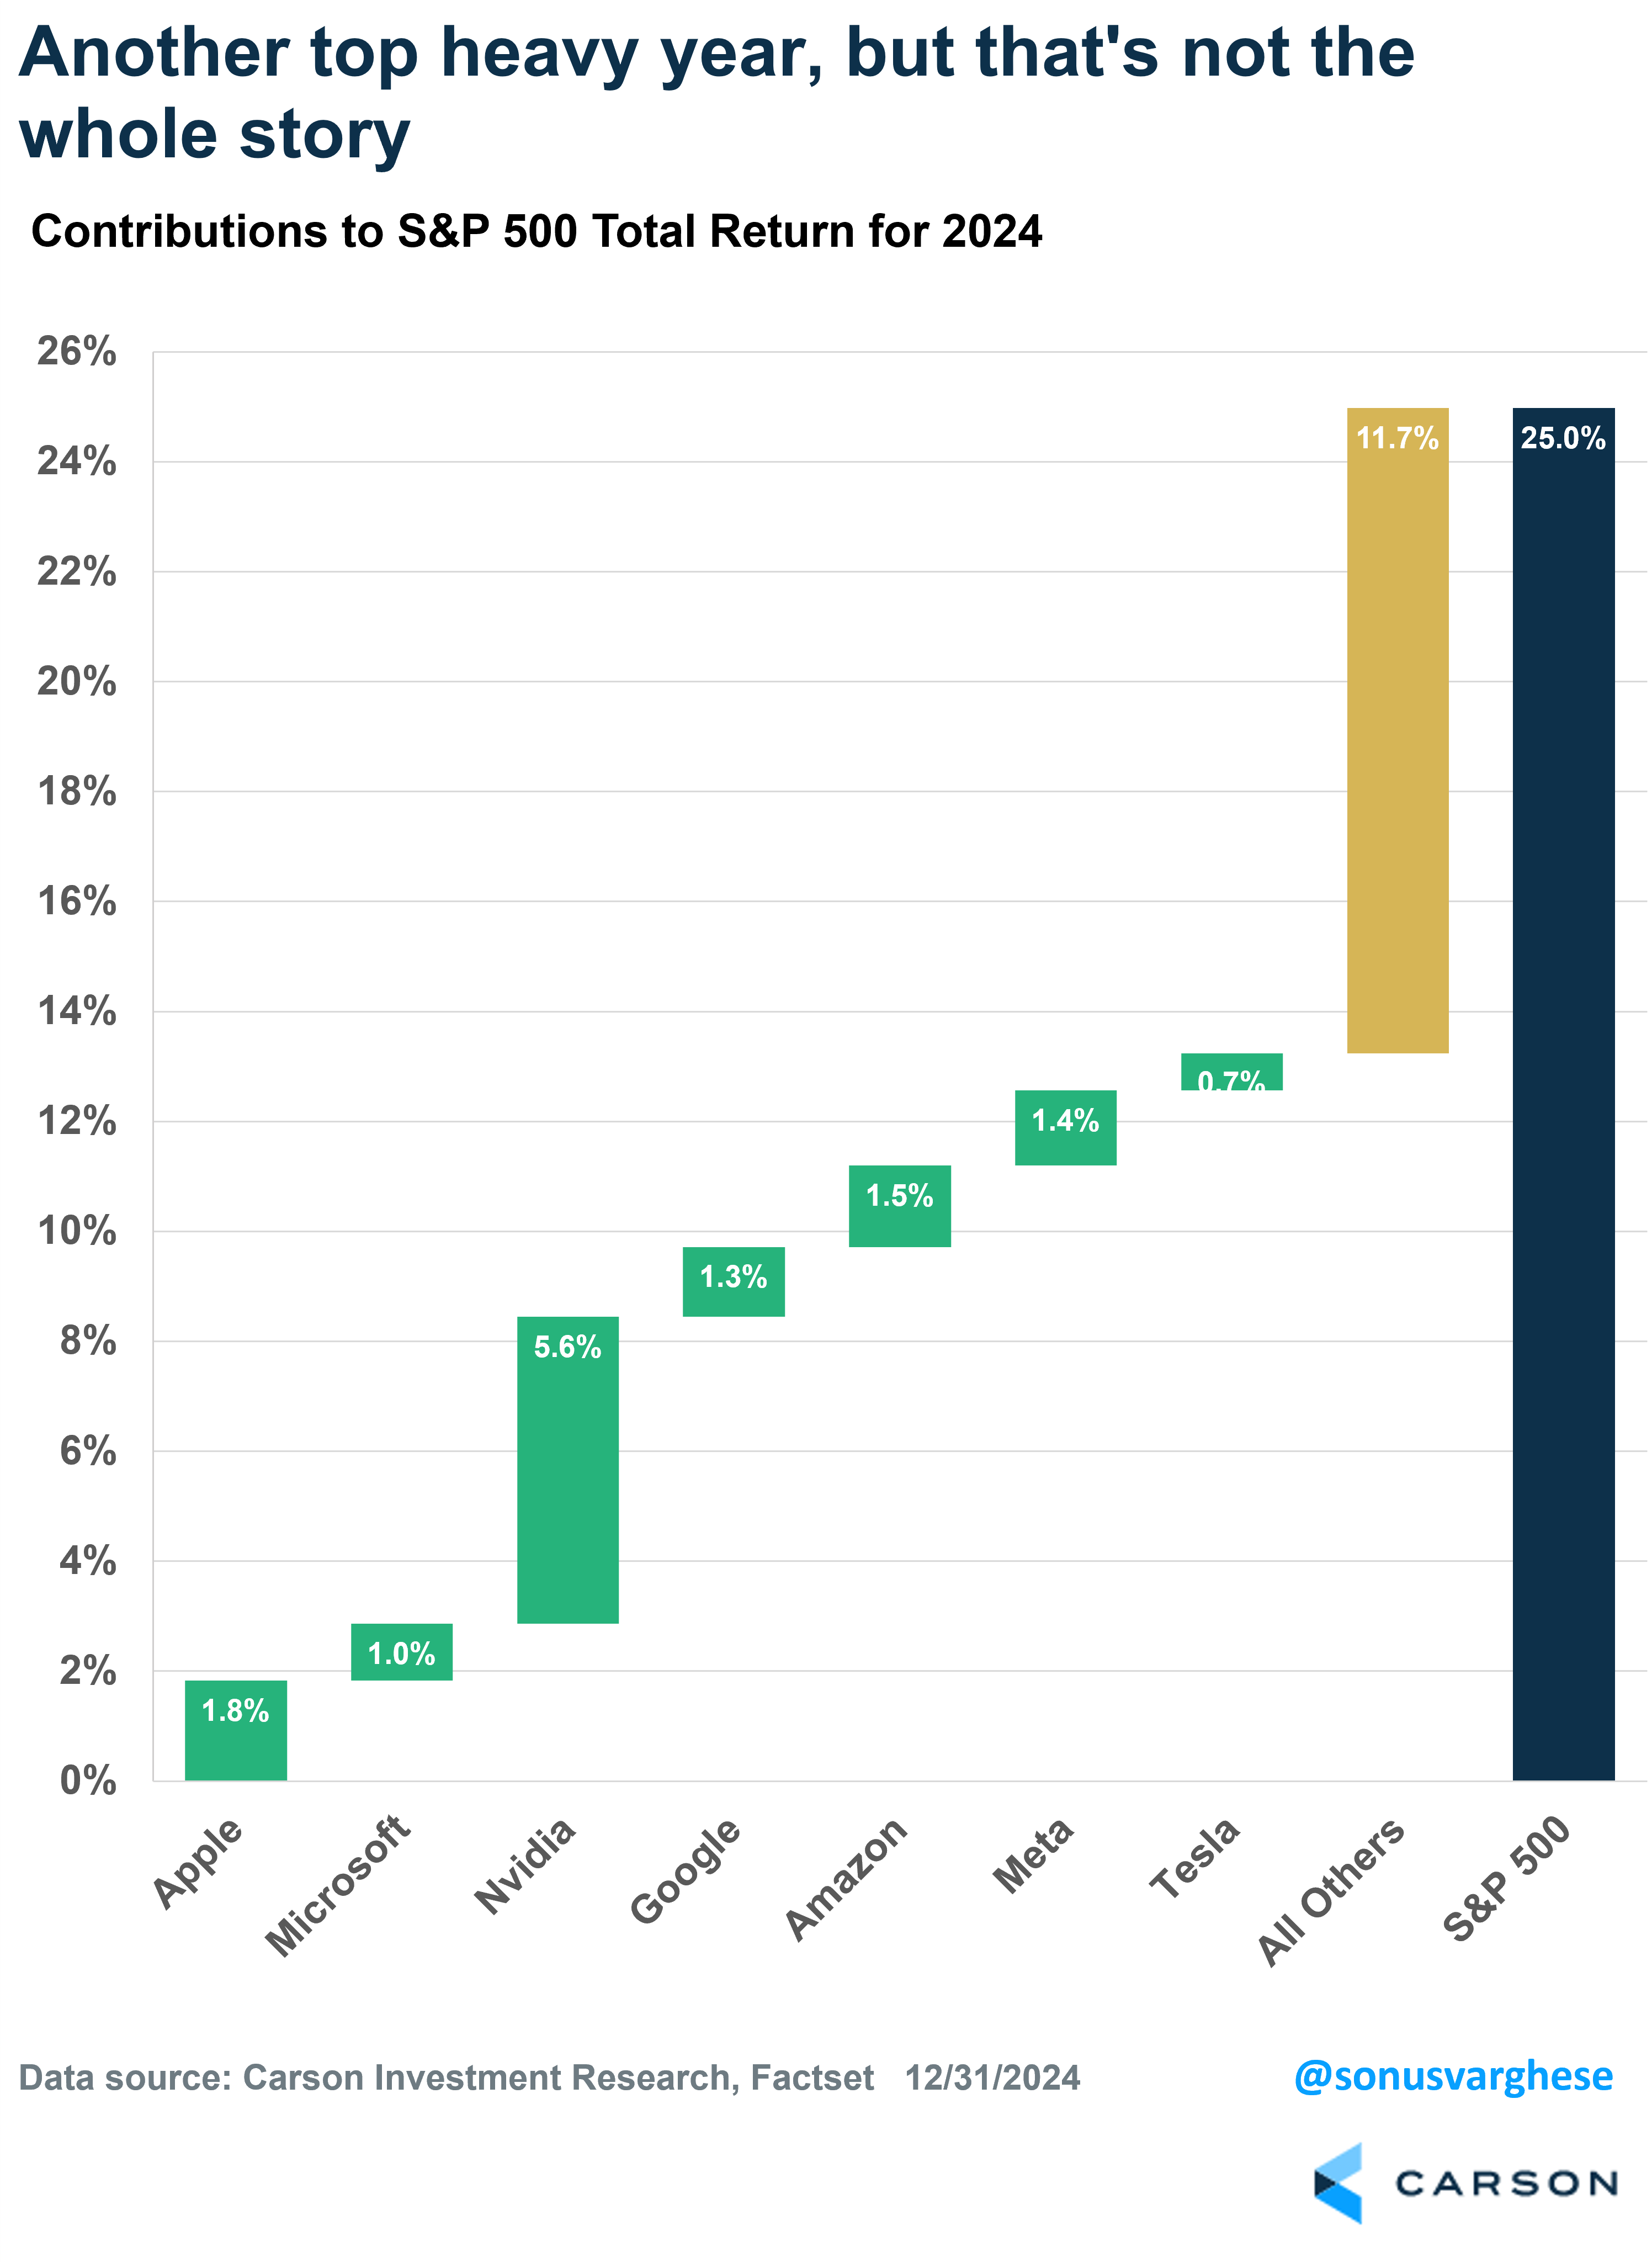
But on the topic of valuations, let’s break down the S&P 500’s 2024 returns by company contributions, or rather, the “Magnificent 7” versus everyone else.
Another Banner Year for “The Magnificent 7,” but That’s Not the Whole Story
All of the “Magnificent 7” (Apple, Microsoft, NVIDIA, Google (Alphabet), Amazon, Meta, and Tesla) had double-digit returns (triple for NVIDIA). Microsoft was the only laggard, with a 12% return, below the S&P 500’s 25% gain for 2024. Together, these seven contributed 53% of the S&P 500’s 25% return, or about 13%-points. The remaining 493 stocks added another 12%-points. That’s not for nothing. Even if the Magnificent 7 had contributed zero, the rest of the stocks would have taken the index return above its annual average of about 8-10%.
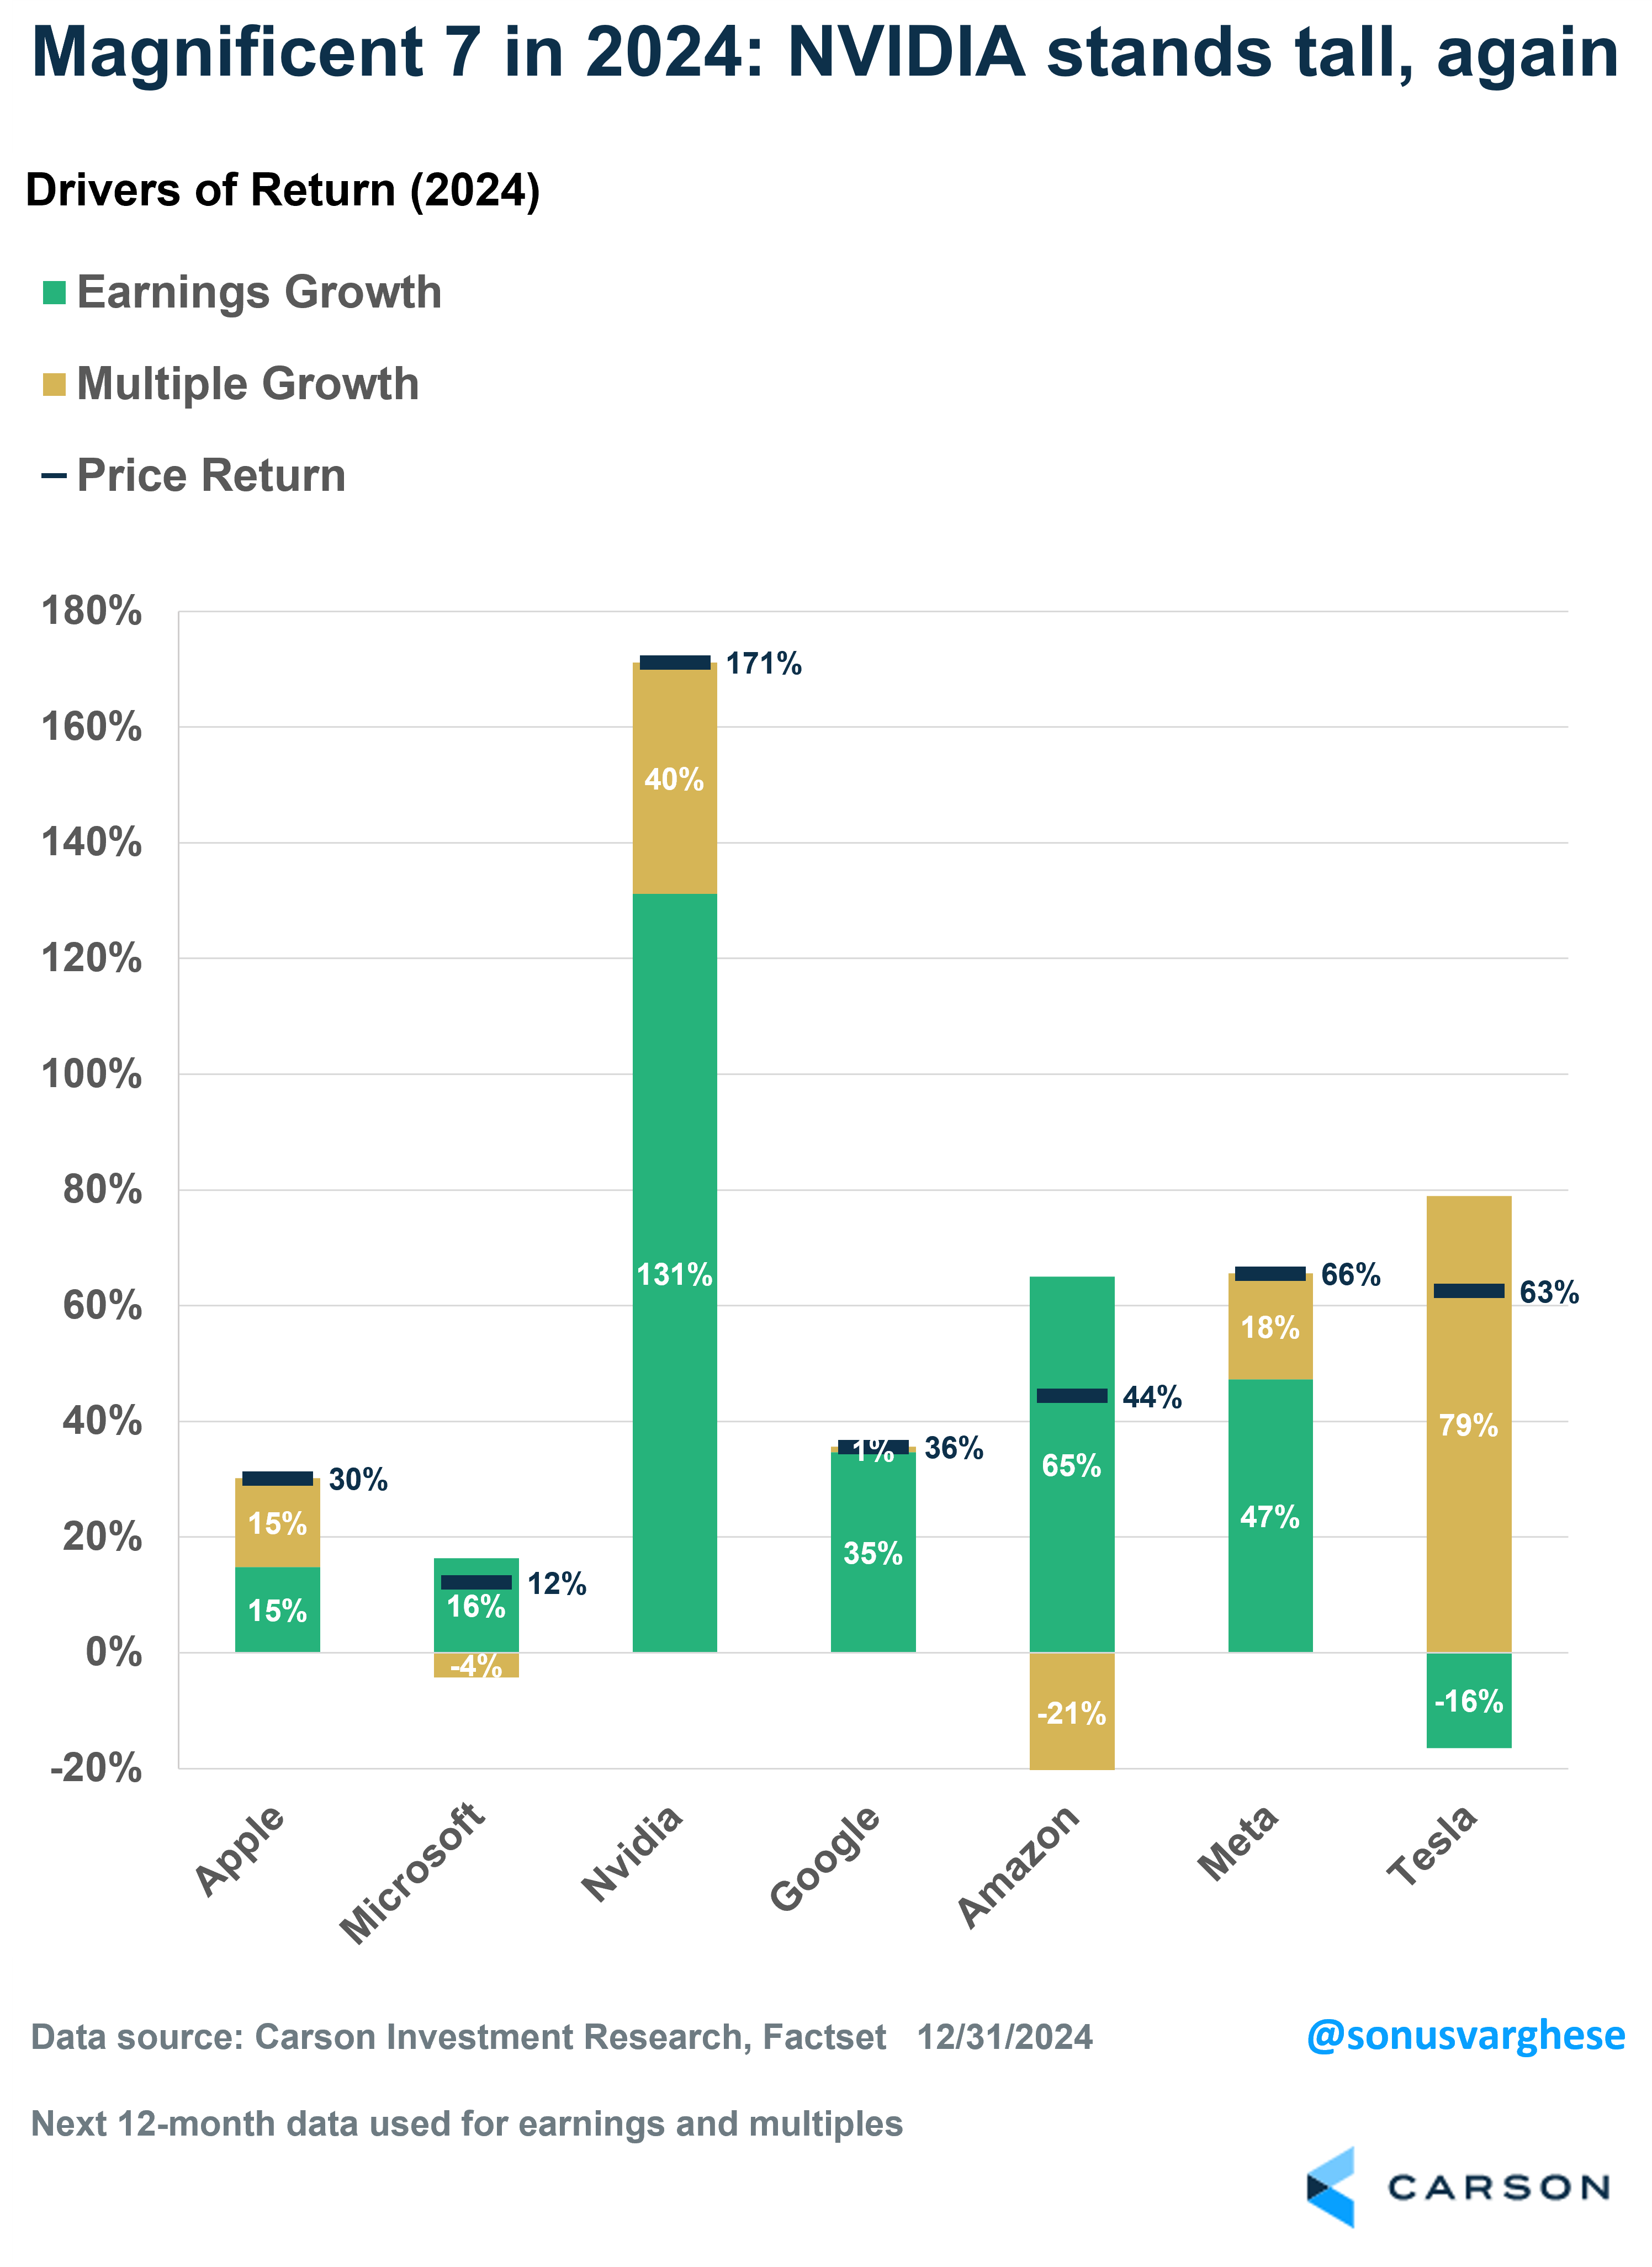
However, you want your leaders to lead, which they did, with aplomb since it was mostly on the back of profitability. For 5 of the 7, the majority of the returns were driven by profit growth (for Google and Amazon, it was entirely profit driven). And the one that stands out is NVIDIA, where profits contributed 131%-points to its 171% return in 2024. The two exceptions were Apple (just under half driven by profits) and Tesla (where the entirety of the gain came from multiple growth).
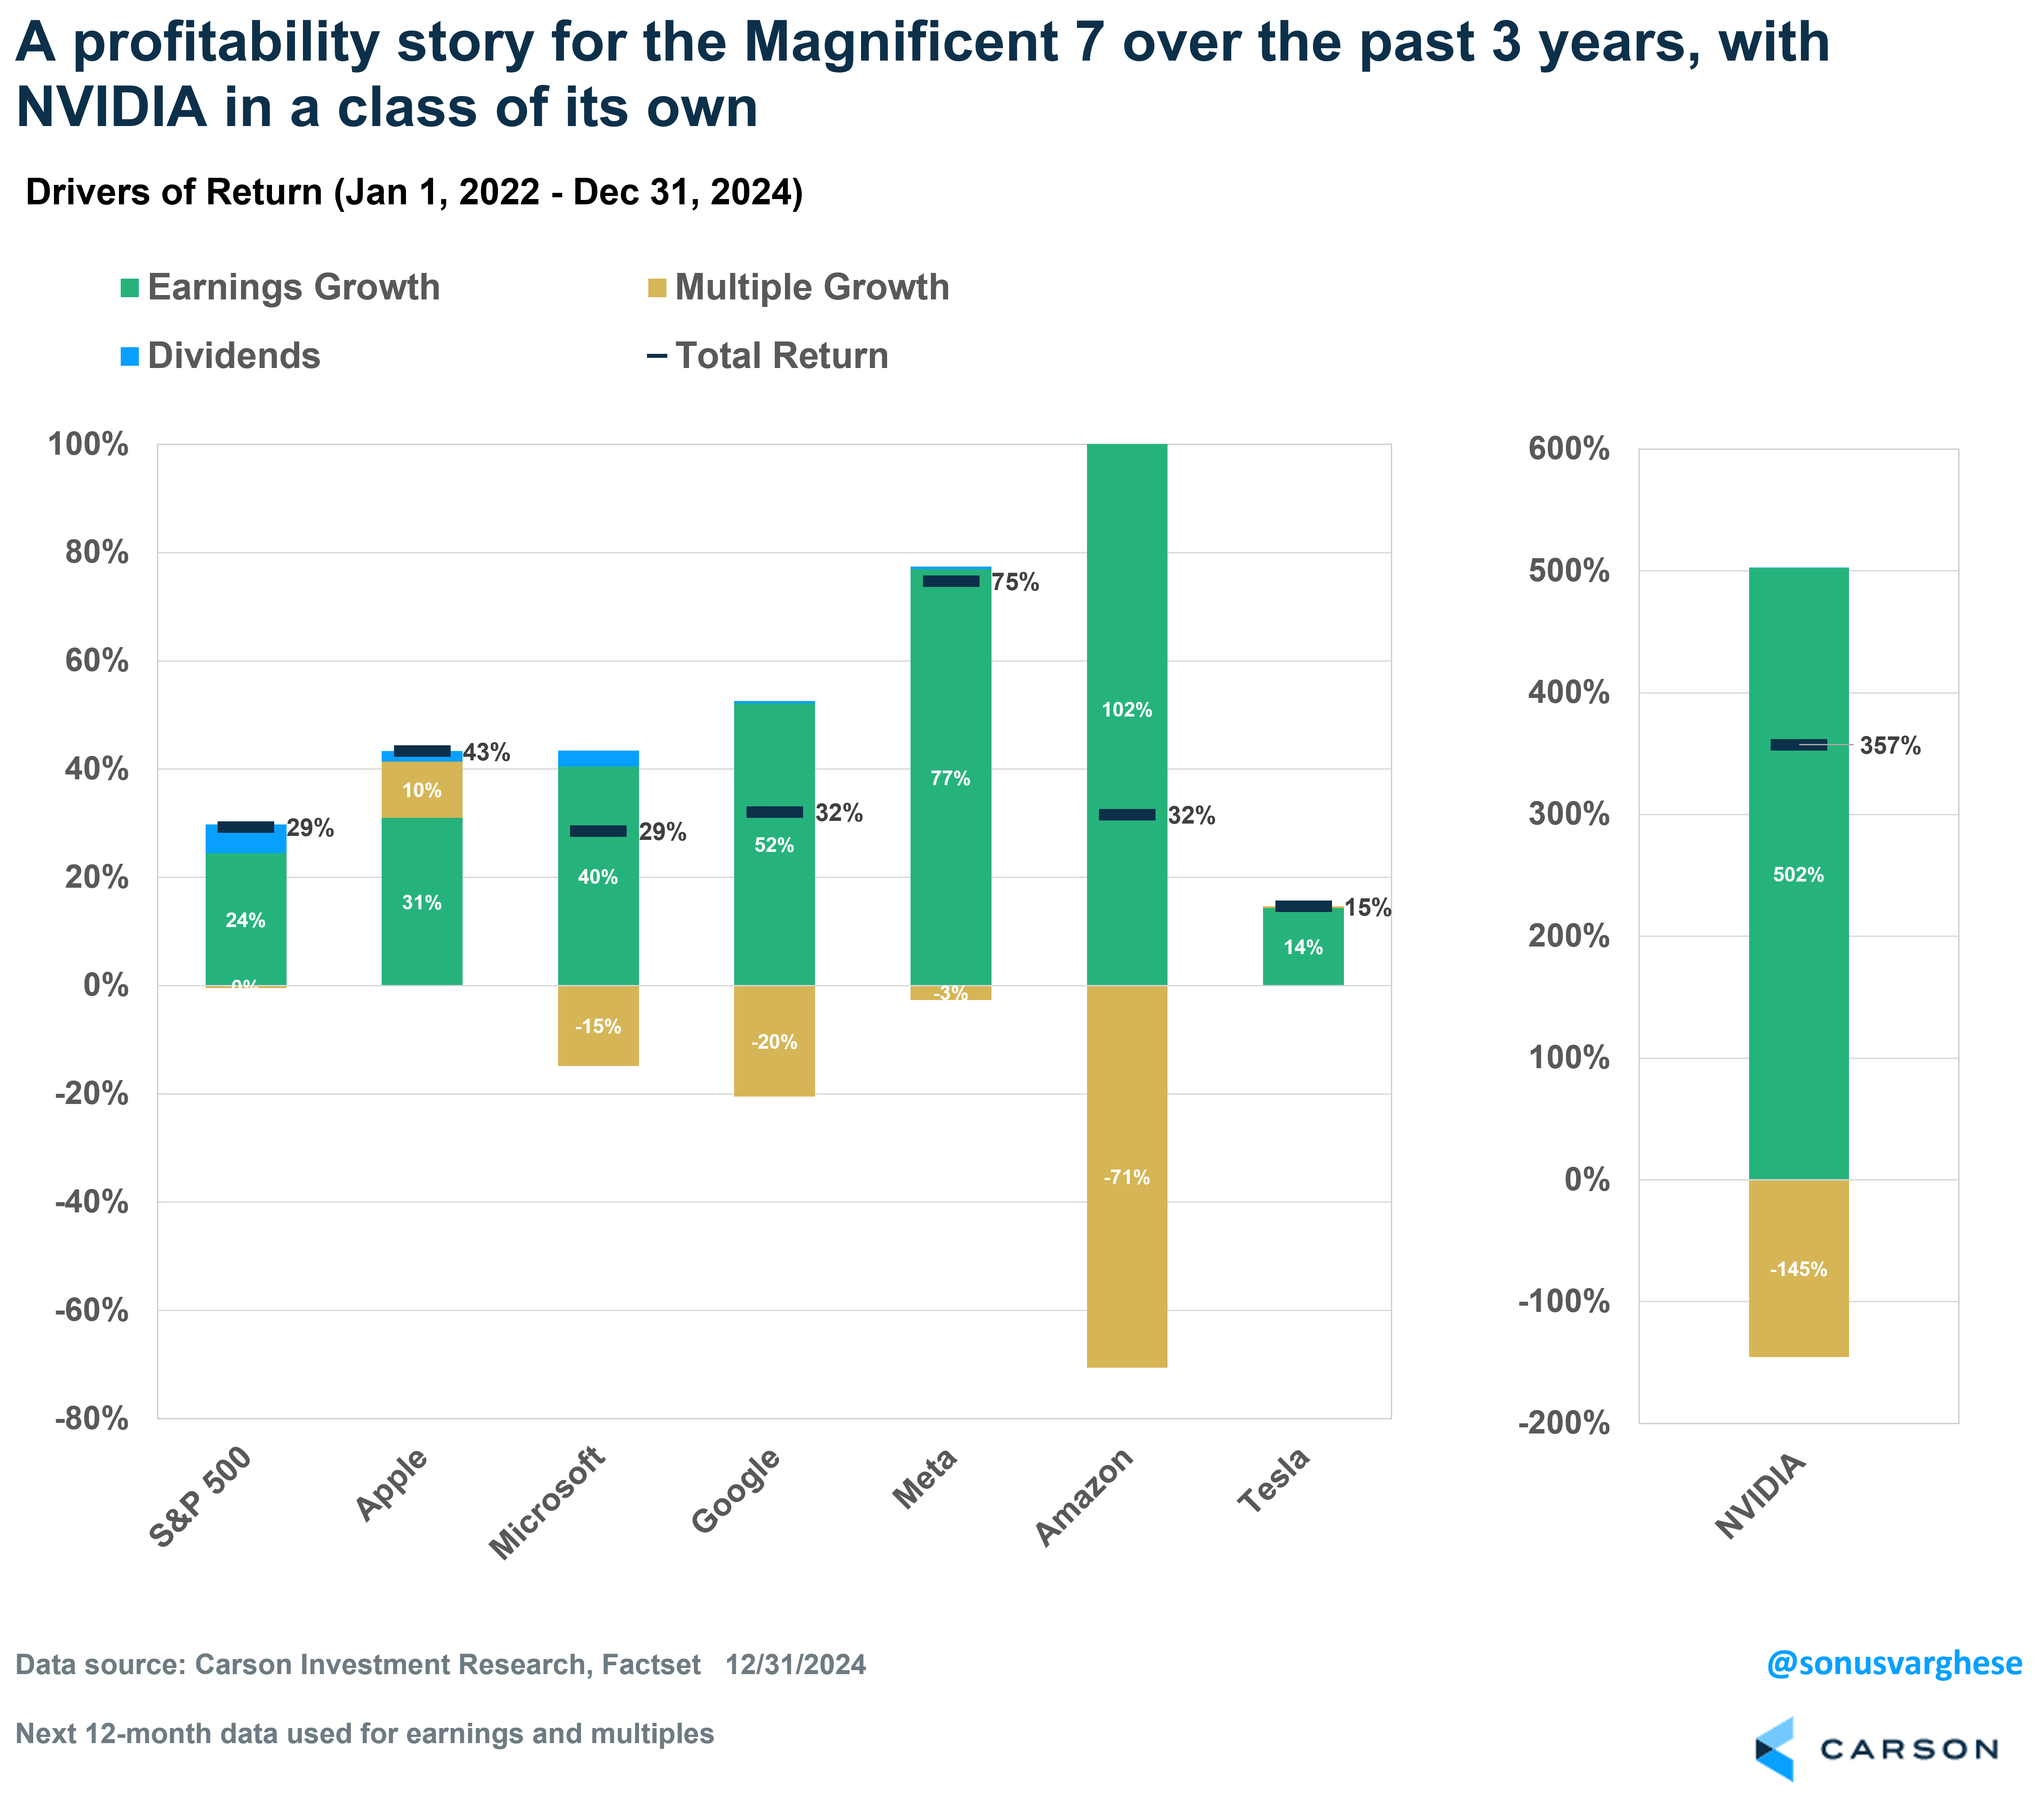
A Three-Year Lookback
We pretty much went through an entire market cycle over the past three years (2022-2024): a bear market followed by two huge years; the Fed hiking rates from 0 to over 5% and then pulling back; and an election to boot. The S&P 500 forward multiple (P/E ratio) also went through a cycle and is now back where they were at the end of 2021. Yet, over that time, the S&P 500 has gained 29% (cumulative total return), all of it from profit growth.
I thought it’d be interesting to look at the Magnificent 7 over this timeframe as well:
- 3 of the 7 had total returns in the vicinity of the broad index (Microsoft, Google, Amazon)
- Tesla was a notable underperformer with a 15% total return
- Apple and Meta did much better
- But the standout was NVIDIA, which gained 357%, with earnings contributing a whopping 502%-points and multiple contraction pulling that down by 145%-points.
In other words, profits were responsible for returns over the past three years, for the broad index and especially the leaders.
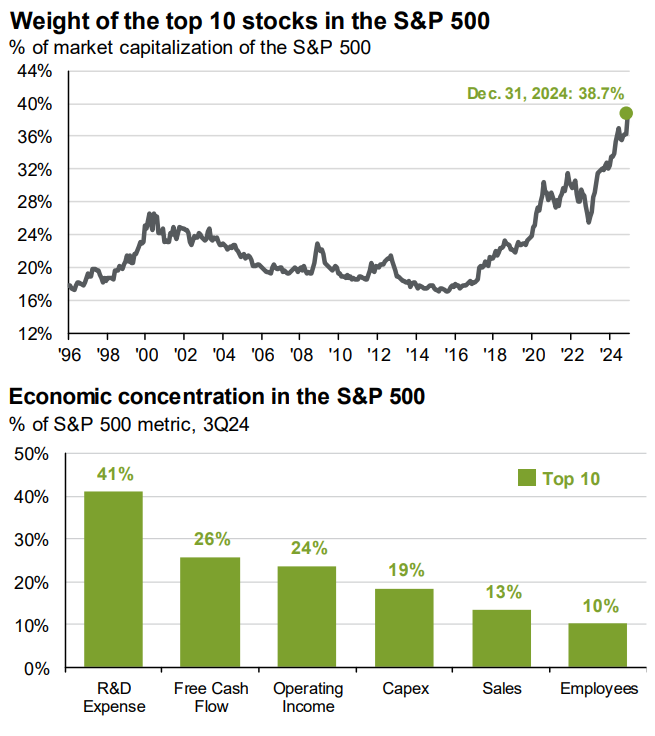
So You Think the US Stock Market Is Concentrated?
Of course, all this means the index has also gotten much more top heavy. This chart from J.P. Morgan’s Guide to the Markets has been getting a lot of purchase, with good reason. The Top 10 stocks now make up just under 40% of the index. They’re certainly profitable, but as you can see below, their free cash flow and profitability as a percent of the overall index are close to 25%.
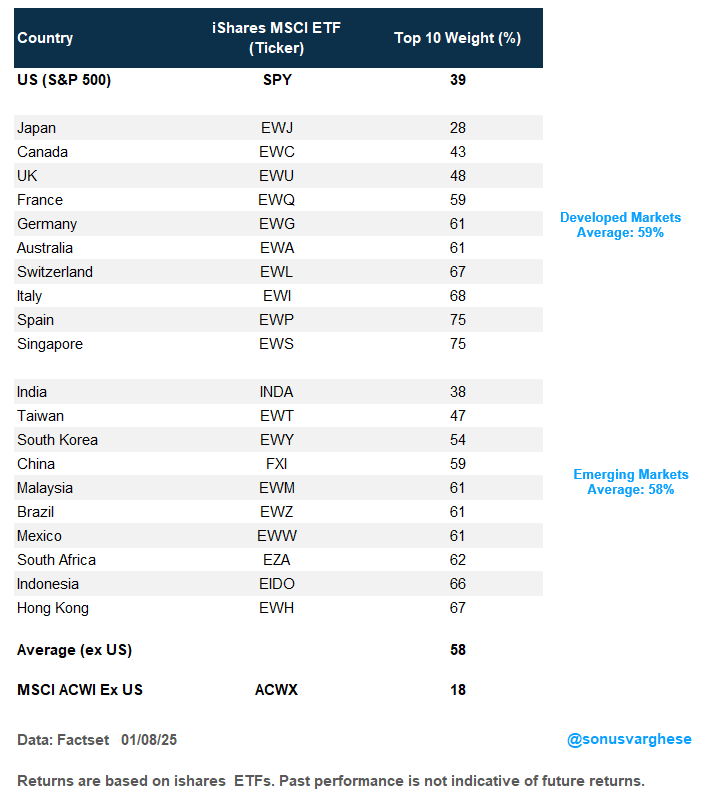
I’m not saying that’s a good look, but this level of concentration is not unusual. It’s actually very common if you look at the rest of the world. Of 20 major markets in the world (I proxied these using the iShares MSCI indices for these countries), US concentration levels are lower than all but two of them (Japan and India). The average concentration in the top 10 names across these 20 other countries is 58%, and the median is 61%, well above the US. And it’s similar whether you look at developed or emerging markets. In fact, in a lot of countries, financials tend to make up a larger portion of the index, making them much more cyclical than the US.
Stay on Top of Market Trends
The Carson Investment Research newsletter offers up-to-date market news, analysis and insights. Subscribe today!
"*" indicates required fields
At the same time, if you diversify broadly across the rest of the world, the top 10 weight collapses to 18% (using the MSCI ACWI ex US Index as a proxy). And that’s a good reminder that even in the US, there’s a lot of opportunity to diversify the equity buckets – from growth to value, and even from large caps to mid- and small-caps.
Carson’s Chief Market Strategist, Ryan Detrick and I revisited 2024 in our latest Facts vs Feelings episode, where we also talked about what we got right and what we got wrong. Take a listen.
For more content by Sonu Varghese, VP, Global Macro Strategist click here.
02587217-0125-A