
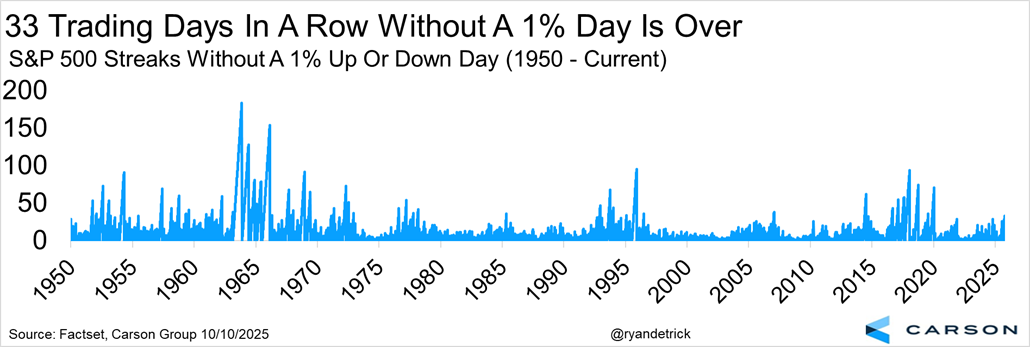
And just like that, volatility is back. This isn’t a big surprise though, as we just had one of the least volatile periods in years, as the S&P 500 went 33 trading days in a row without a 1% move either up or down. This was the longest streak since right before Covid. Then considering this recent tranquility took place during the usually volatile August and September, some October spookiness isn’t a big shock to us.
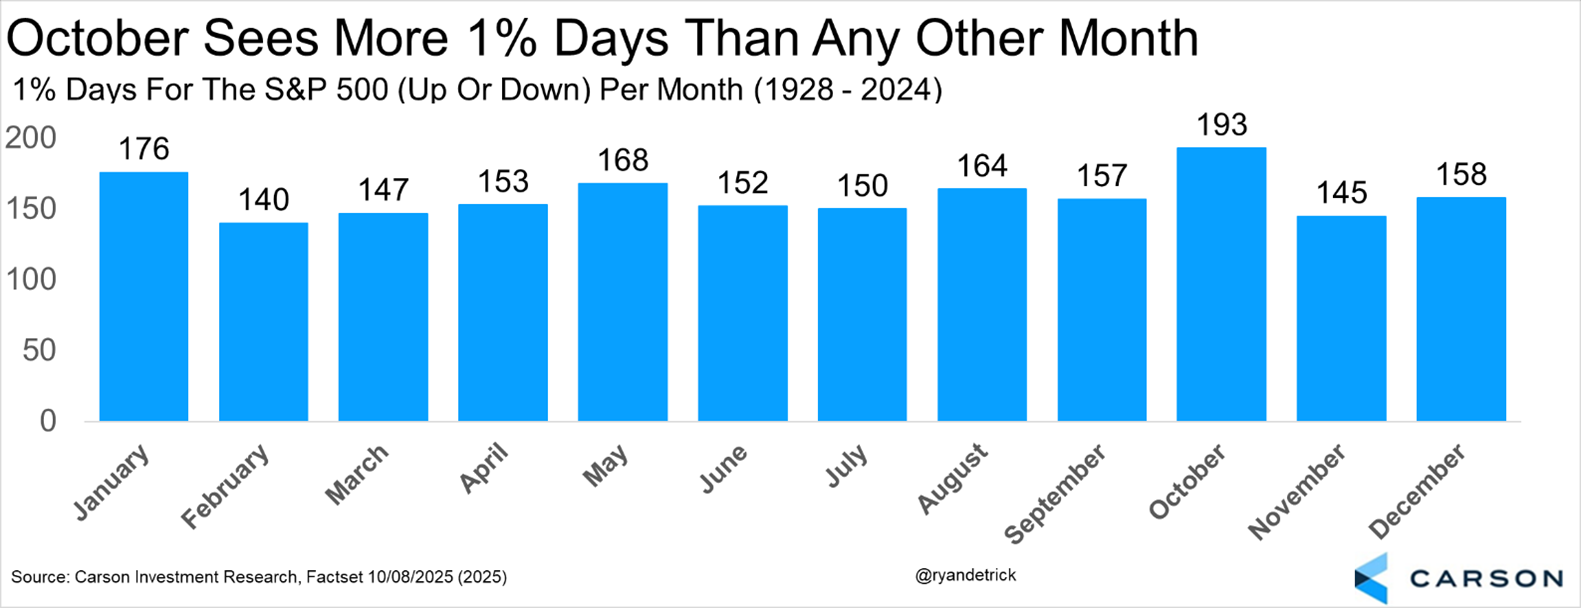
October Likes Big Moves
No month has seen more 1% up or down days than October and it isn’t even really close. To see some big moves this October so far is actually par for the course really.
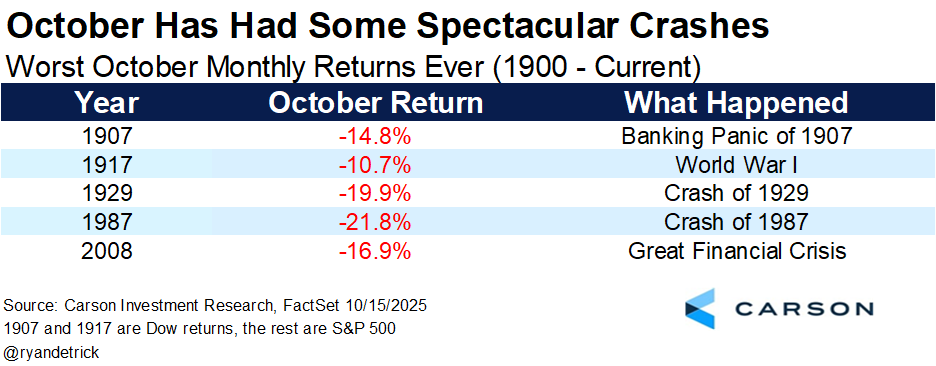
Taking this a step further, this month is known for some of the largest crashes in history. Most of us have heard about the Crashes of 1929 and 1987 and you’ll never forget October 2008 if you were there. But going back further shows this month also had huge declines in 1907 and 1917. I wish I had some grand reason why huge drops happen this month, but I don’t. The bottom line is they just do and as investors we should prepare for potential larger moves around now.
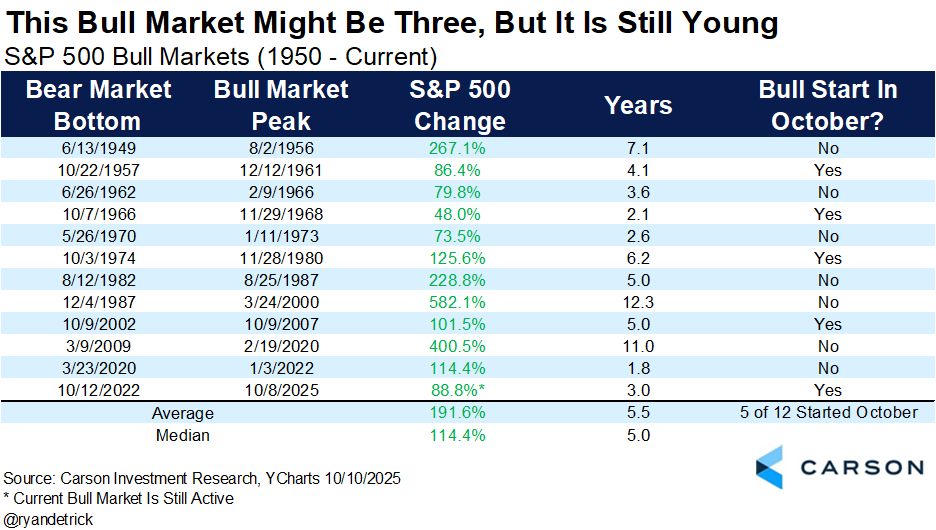
Lastly, October is also known as a bear market killer, as five of the past 12 bull markets started in this month. When we went on record three years ago that the bear market was over and a new bull had started, we strongly considered this in that analysis.
More On The Bull Market
I broke down the current bull market in The Bull Market Turns Three, but I wanted to touch on a few more interesting things about this bull market today.
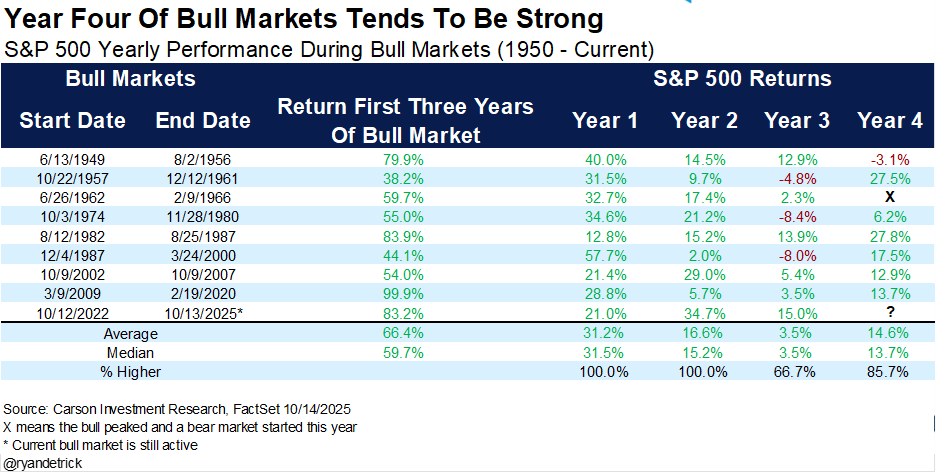
First off, only once has a bull market that made it to its third birthday and not made it to the fourth birthday, and that was 60 years ago. The past five bulls that made it this far all made it to at least year four and the past four all gained at least double digits during year four. It is interesting that this bull market gained 15.0% in year three, historically a weaker year in a longer bull market. Still, the bottom line is once a bull market makes it this far, they likely continue and that is something we still expect this time as well.
These next few charts came courtesy of Sonu Varghese, VP, Global Macro Strategist.
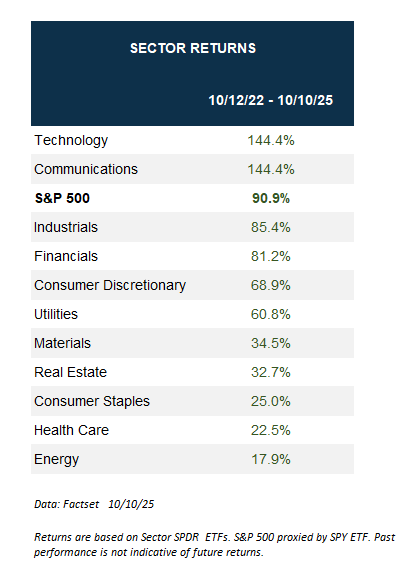
On a total return basis technology and communication services have led the past three years, while all other groups lagged. We are seeing this pattern change some this year, as things begin to broaden out (have you seen utilities?). Still, this is a big reminder that the large tech names have been the true leaders the past three years.
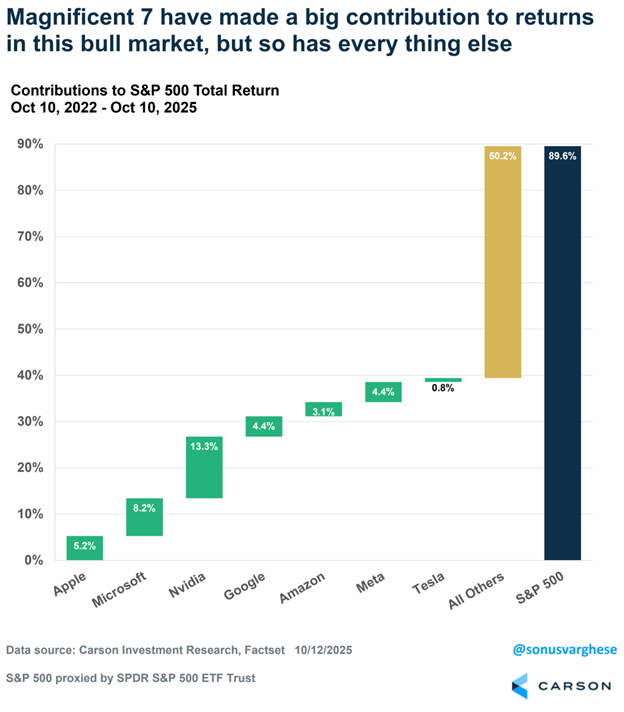
Looking at specifically the Mag 7 names, we found that more than 39% of the nearly 90% S&P 500 gain the past thee years came from the Mag 7, meaning the other 493 contributed about 50%. Yes, it was a top heavy bull market, but maybe not as top heavy as we thought when you see it like this.
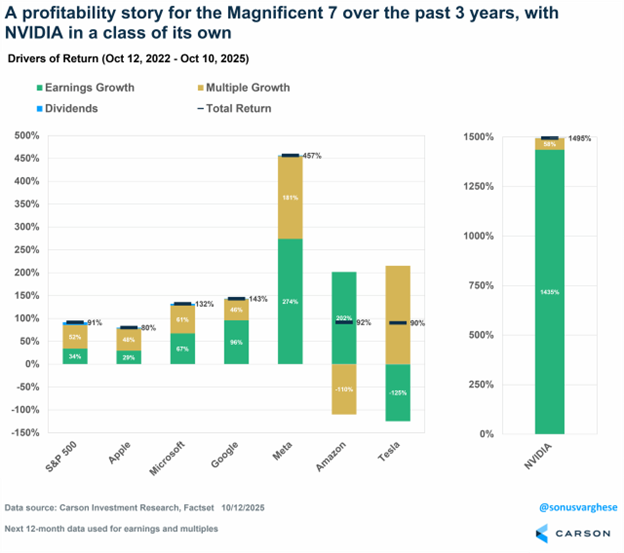
In conclusion, many claim this bull market is all about multiple expansion, which really isn’t true. We know the Mag 7 have been the true earnings stars and we’ve seen multiple expansion for sure, but we’ve also seen incredible earnings growth here as well. This neat chart shows where the Mag 7 price performance has come from and good deal of it have indeed been earnings and dividends! Telsa is the one that has seen all the gains come from multiple expansion, but check out NVIDIA. The stock is up nearly 1,500% the past three years and 1,435% of that has come from earnings! That might surprise many investors to hear, but it justifies the rally in our opinion.
As always, thanks so much for reading and following what our team is saying. It isn’t lost on us that you can get your market research for many other places and we are honored you take the time to listen to what our team is saying.
For more of our latest thoughts on the economy, bull market, government shutdown, AI, and more, be sure to check out our latest Facts vs Feelings podcast below.
8503089.1.-15OCT2025
For more content by Ryan Detrick, Chief Market Strategist click here
