Last week, Treasury Secretary Scott Bessent said that the Treasury was doing their buyback program (of 10- to 30-year treasuries) because yields on the long end of the curve didn’t reflect fundamentals. Via Yahoo Finance:
“We have a big toolkit. Part of it is signaling here to show that we believe yields don’t reflect the underlying fundamentals of this Iran conflict. We will get on the other side of this.”
This begs the question: are yields reflecting fundamentals?
One approach is to look at nominal GDP and where interest rates should land relative to it. Interest rates compensate investors for real returns plus expected inflation. Nominal GDP growth combines the same forces: real growth plus inflation.
Nominal GDP growth is essentially nominal income growth in the economy (gross domestic income should equal GDP, except for measurement issues). Over time, nominal rates should move with nominal GDP growth, assuming some equilibrium. Three reasons:
- Monetary policy: a 4% policy rate means very different things in an economy growing at 4% versus 6%. If the Fed keeps rates unchanged while nominal GDP is elevated, policy is essentially getting easier, as incomes rise relative to borrowing costs
- Debt dynamics: If borrowing costs are 4% while nominal GDP grows 6%, then the debt is easier to service (including for the government). What matters is the interest rate relative to nominal income growth.
- Bond market dynamics: A 4% medium-to-long-term Treasury yield when nominal GDP is growing 6-7% is likely too low unless investors expect growth and/or inflation to collapse. Faster nominal growth usually means more credit demand and higher inflation.
Of course, this doesn’t mean interest rates should exactly match nominal GDP growth, but think of it like a magnet.
Rather than look across all of history, I thought it’d be interesting to compare today with the late 1990s tech boom, an obvious analogy. Mathew Klein over at the Overshoot has a great piece along these same lines.
Nominal GDP Growth is running close to late-1990s pace, but not rates
Nominal GDP (real GDP growth + inflation) averaged 4% annualized from 2010-2019 and has picked up since 2020 (thanks to higher inflation). Here’s a comparison of nominal GDP growth since 2024 with 1995-1999:
- Over the last 10 quarters (2024 Q1 – 2026 Q2), nominal GDP growth averaged an annualized pace of 5.5%
- Over the five years from 1995-1999, nominal GDP grew at an annualized pace of 5.8%
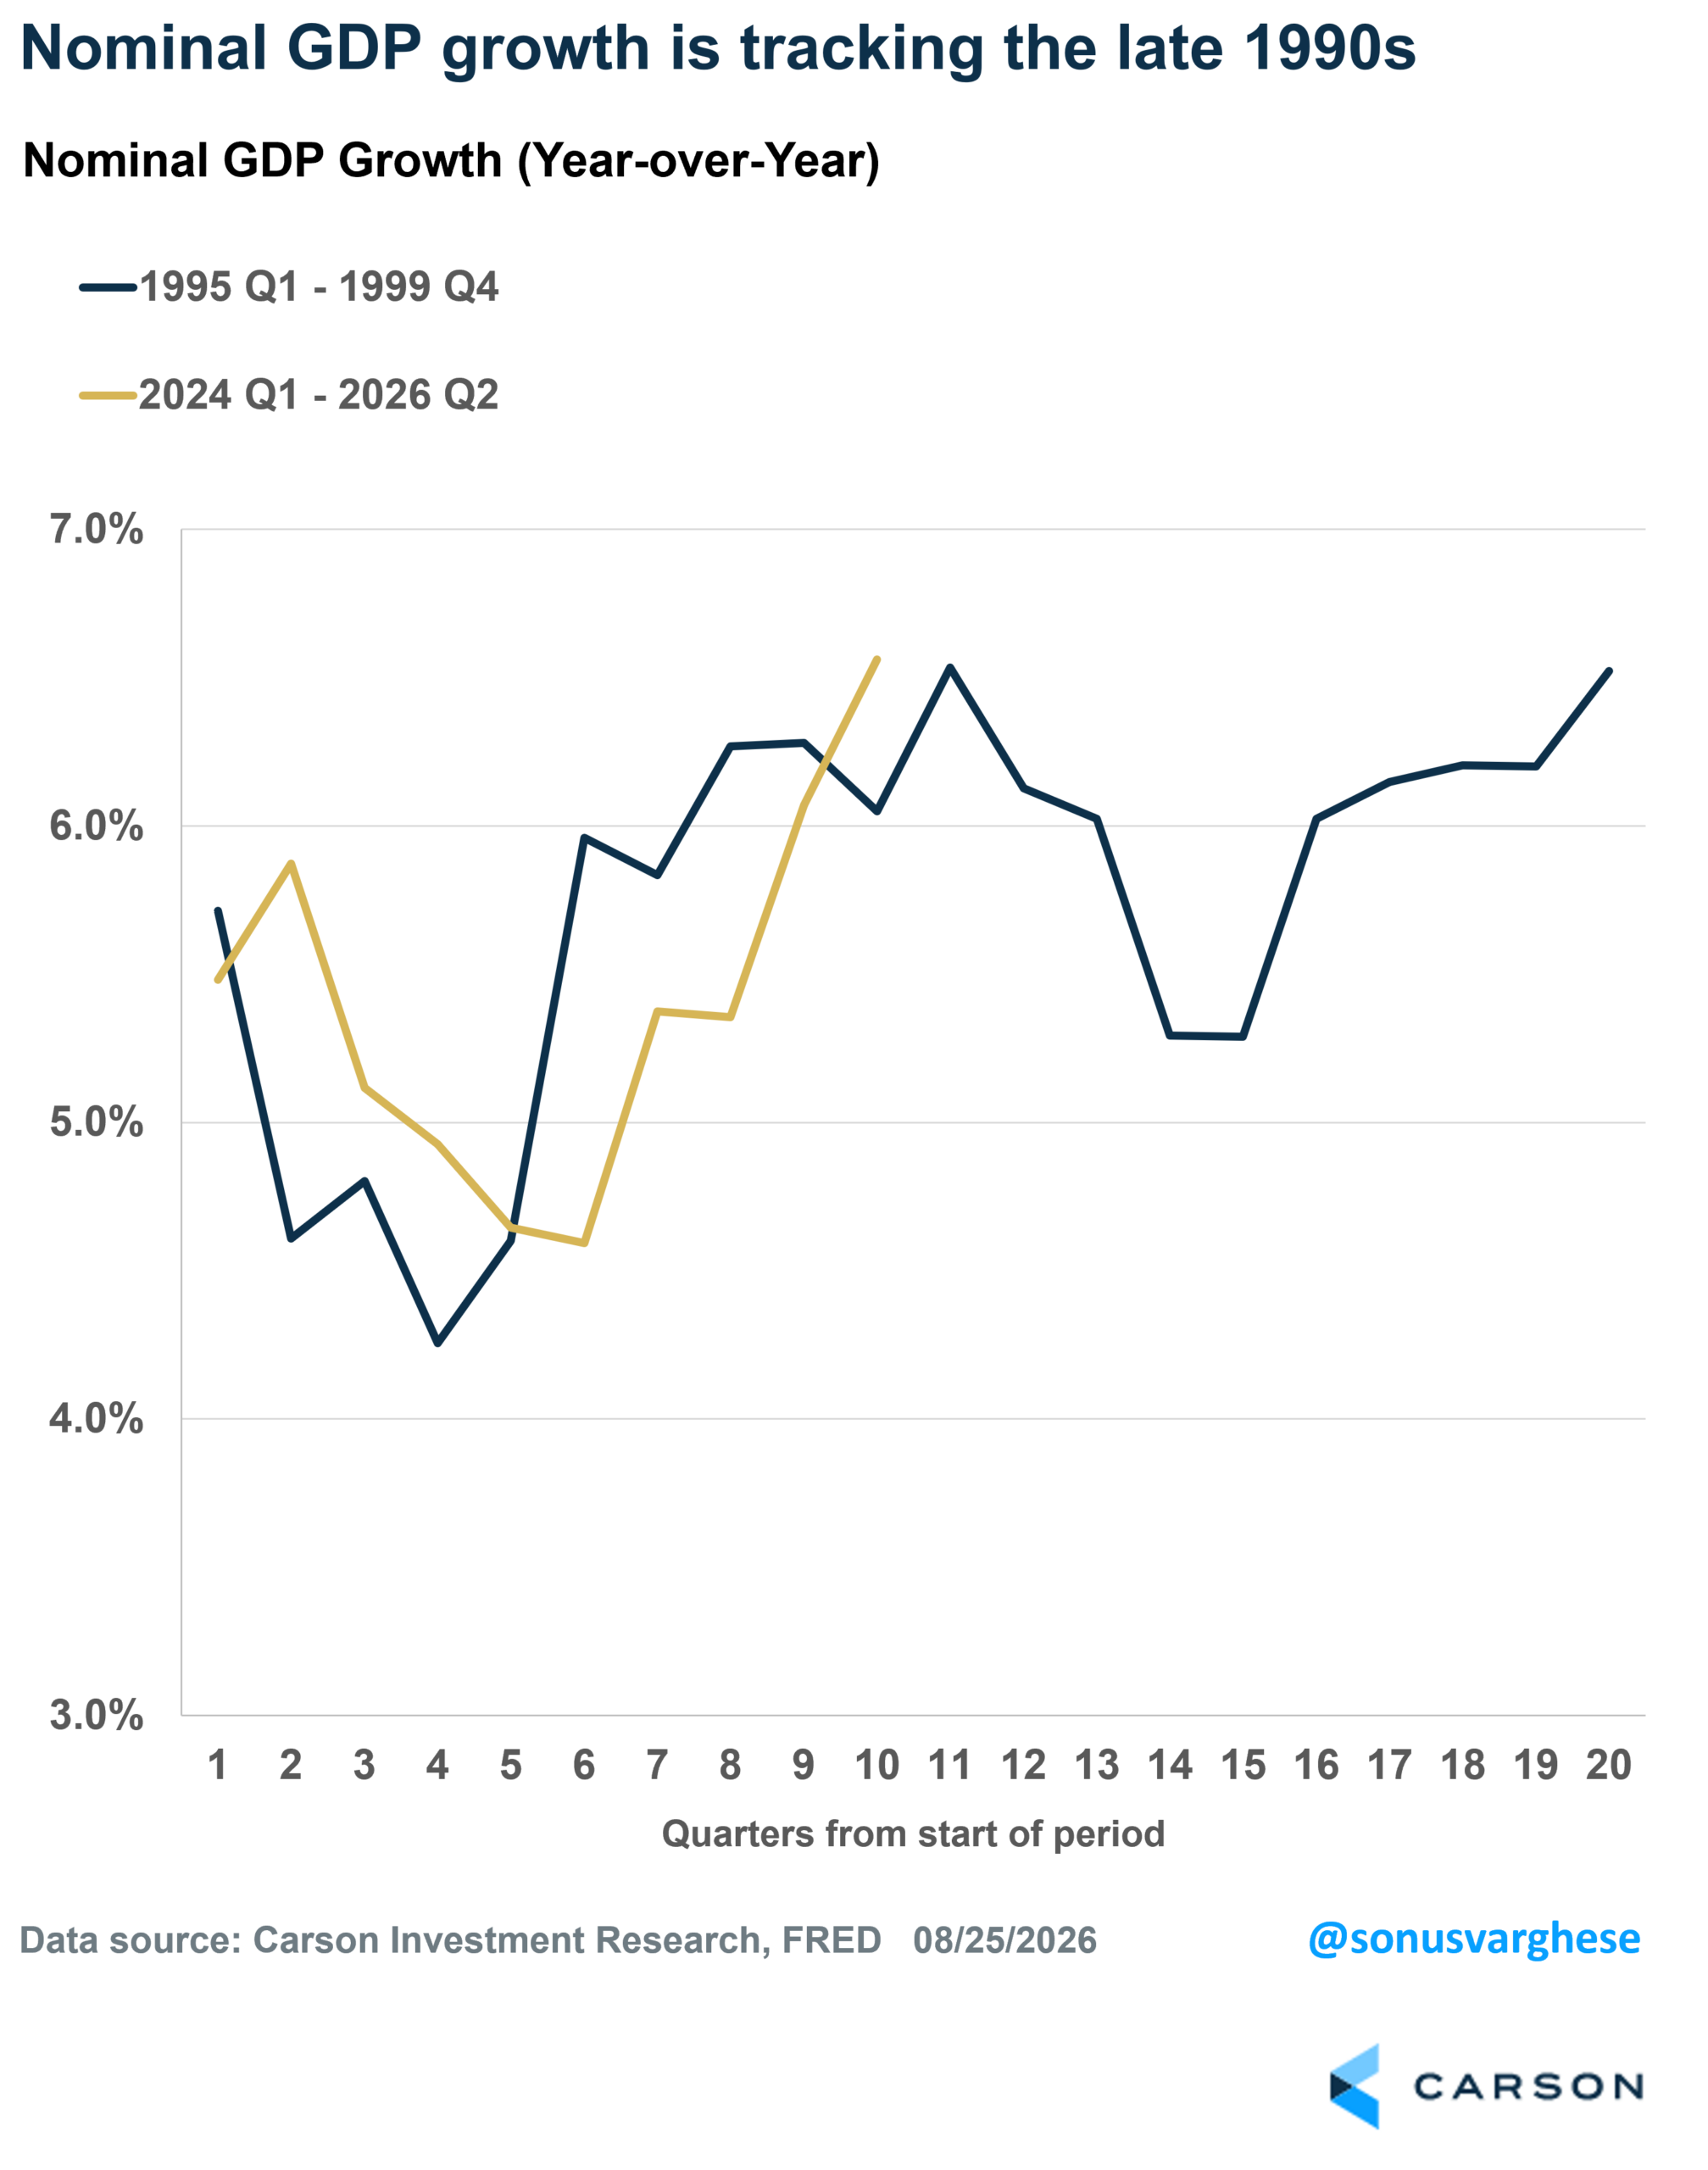
In short, nominal GDP is running close to the 1990s pace. In fact, 6.5% year-over-year growth in 2026 Q2 matches the highest pace we saw back in the 1990s (Q3 1997).
And right now it’s mostly an inflation story, in contrast to the mid-to-late 1990s.
- Real GDP growth from 1995-1999 averaged 4.2% annualized, roughly twice the pace of the prior 10 quarters.
- Inflation (using the GDP deflator) averaged 1.6% annualized in the 1990s, versus 3.4% from 2024 onward.
Productivity growth has also eased. It clocked in at 2.1% annualized from 2024-2026 (Q2), above the 2005-2019 pace of 1.5% but below the 2.7% pace from 1995-1999.
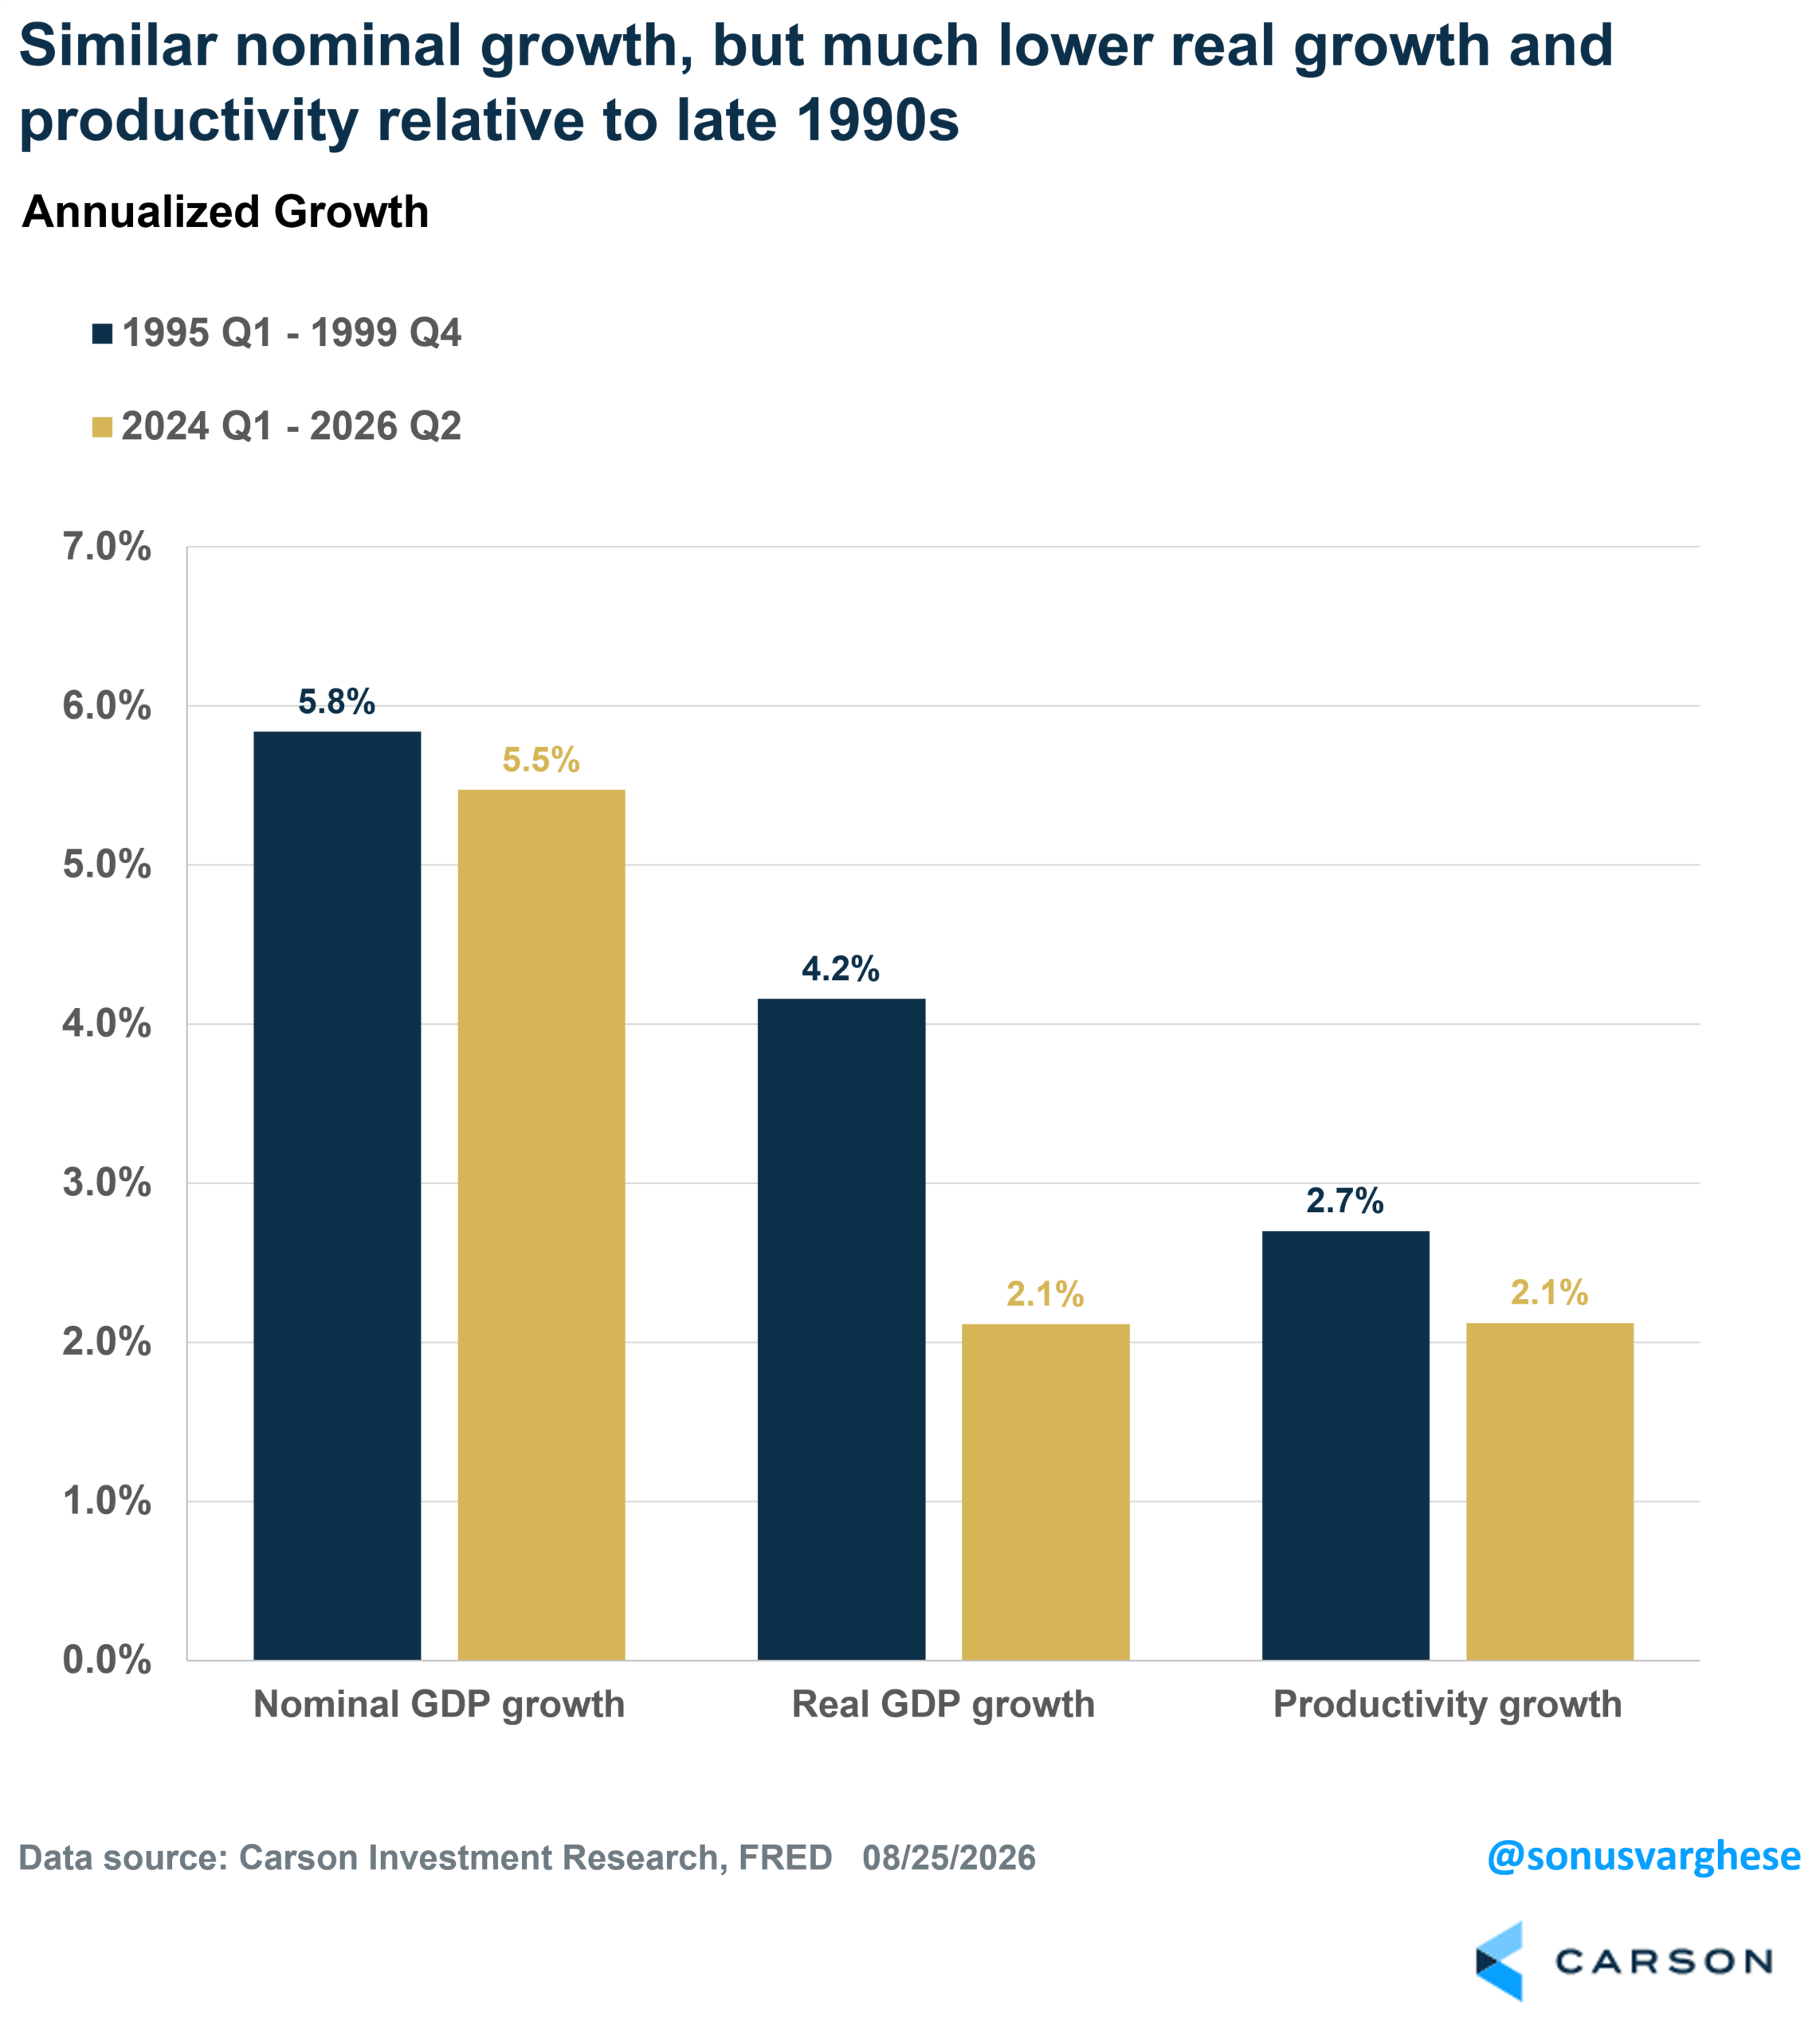
The late 1990s had low inflation and strong real growth, supported by productivity and labor force growth. We have almost the opposite now: labor force growth is at a standstill and real output is below trend. But inflation is running hot, pushing nominal GDP growth toward late-1990s levels.

Stay on Top of Market Trends
The Carson Investment Research newsletter offers up-to-date market news, analysis and insights. Subscribe today!
"*" indicates required fields
That gets to the key question: how do the levels of interest rates compare?
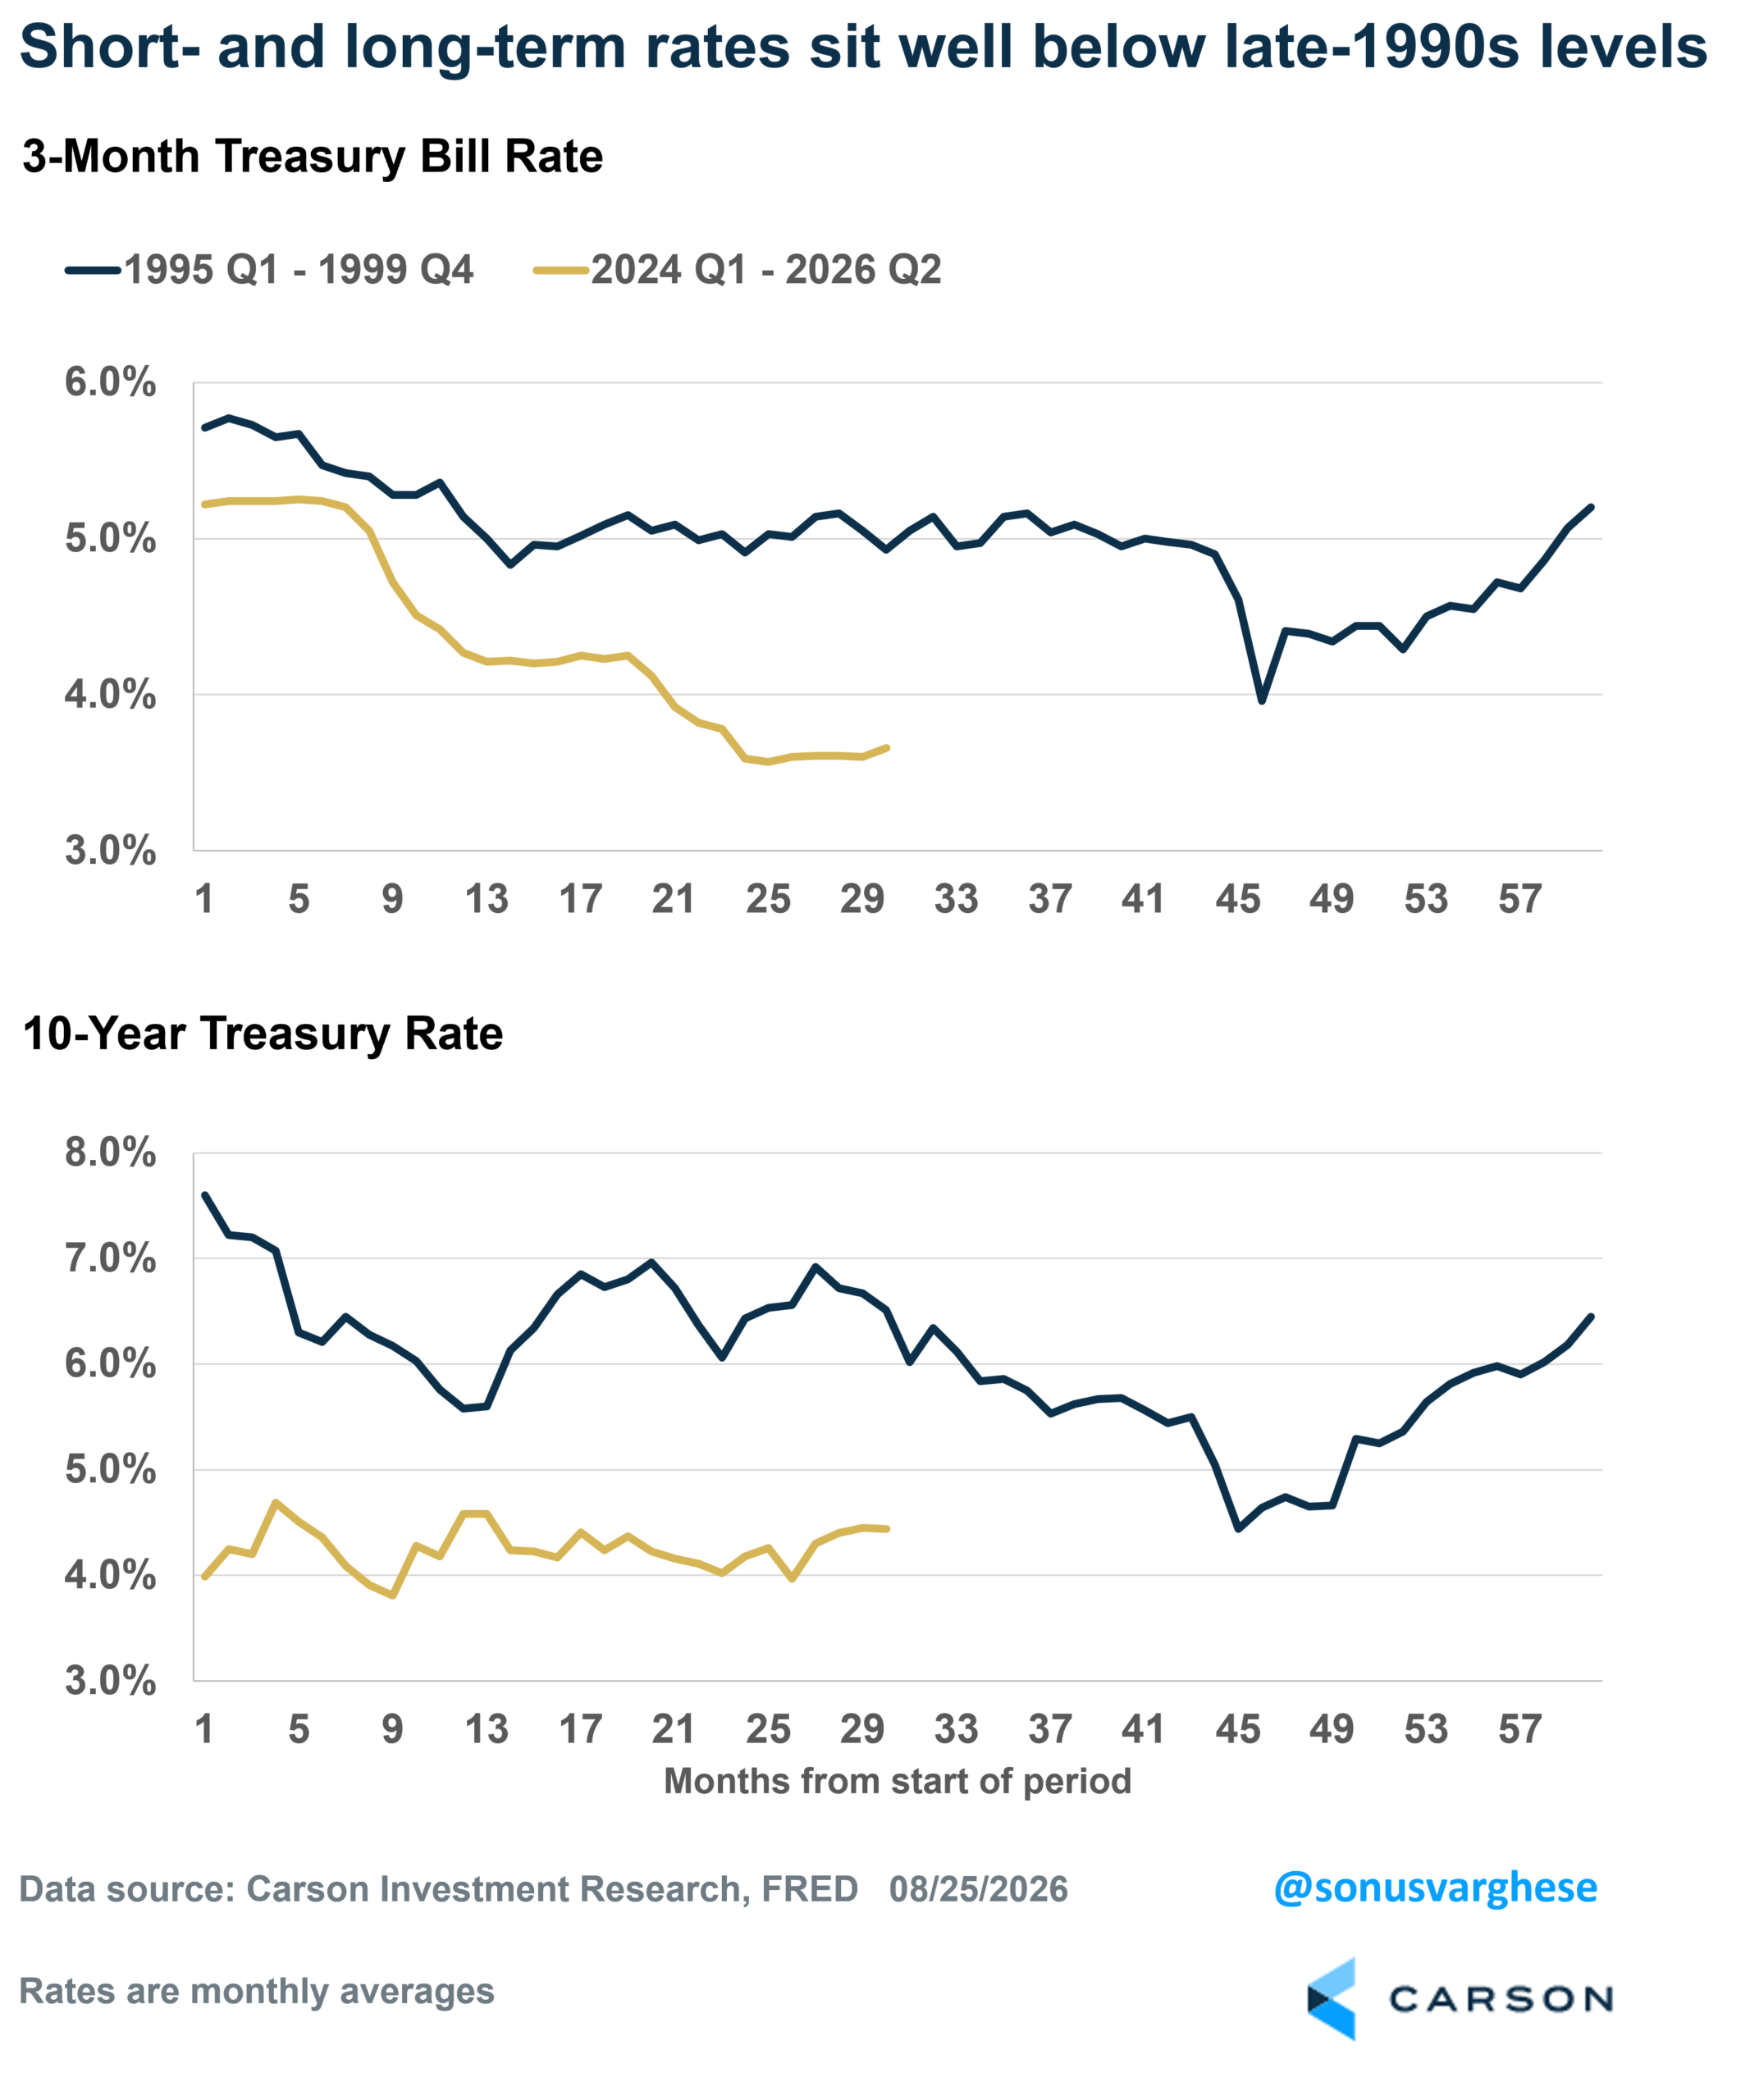
The short answer is that rates at both the short and long end are lower than in 1995-1999.
- Three-month rates (a proxy for the policy rate) are below late-1990s levels, and the gap widened after the Fed’s rate cuts over the past two years.
- Ten-year yields are also much lower. The 10-year fell to 4.16% in 1998 after Long-Term Capital Management collapsed, but rebounded to 6.4% by the end of 1999.
Here’s a look at the overall averages
- From 1995-1999, the three-month rate averaged 6%, compared to 4% from 2024-2026 (Q2)
- From 1995-1999, the ten-year yield averaged 6%, versus 4% in the recent period
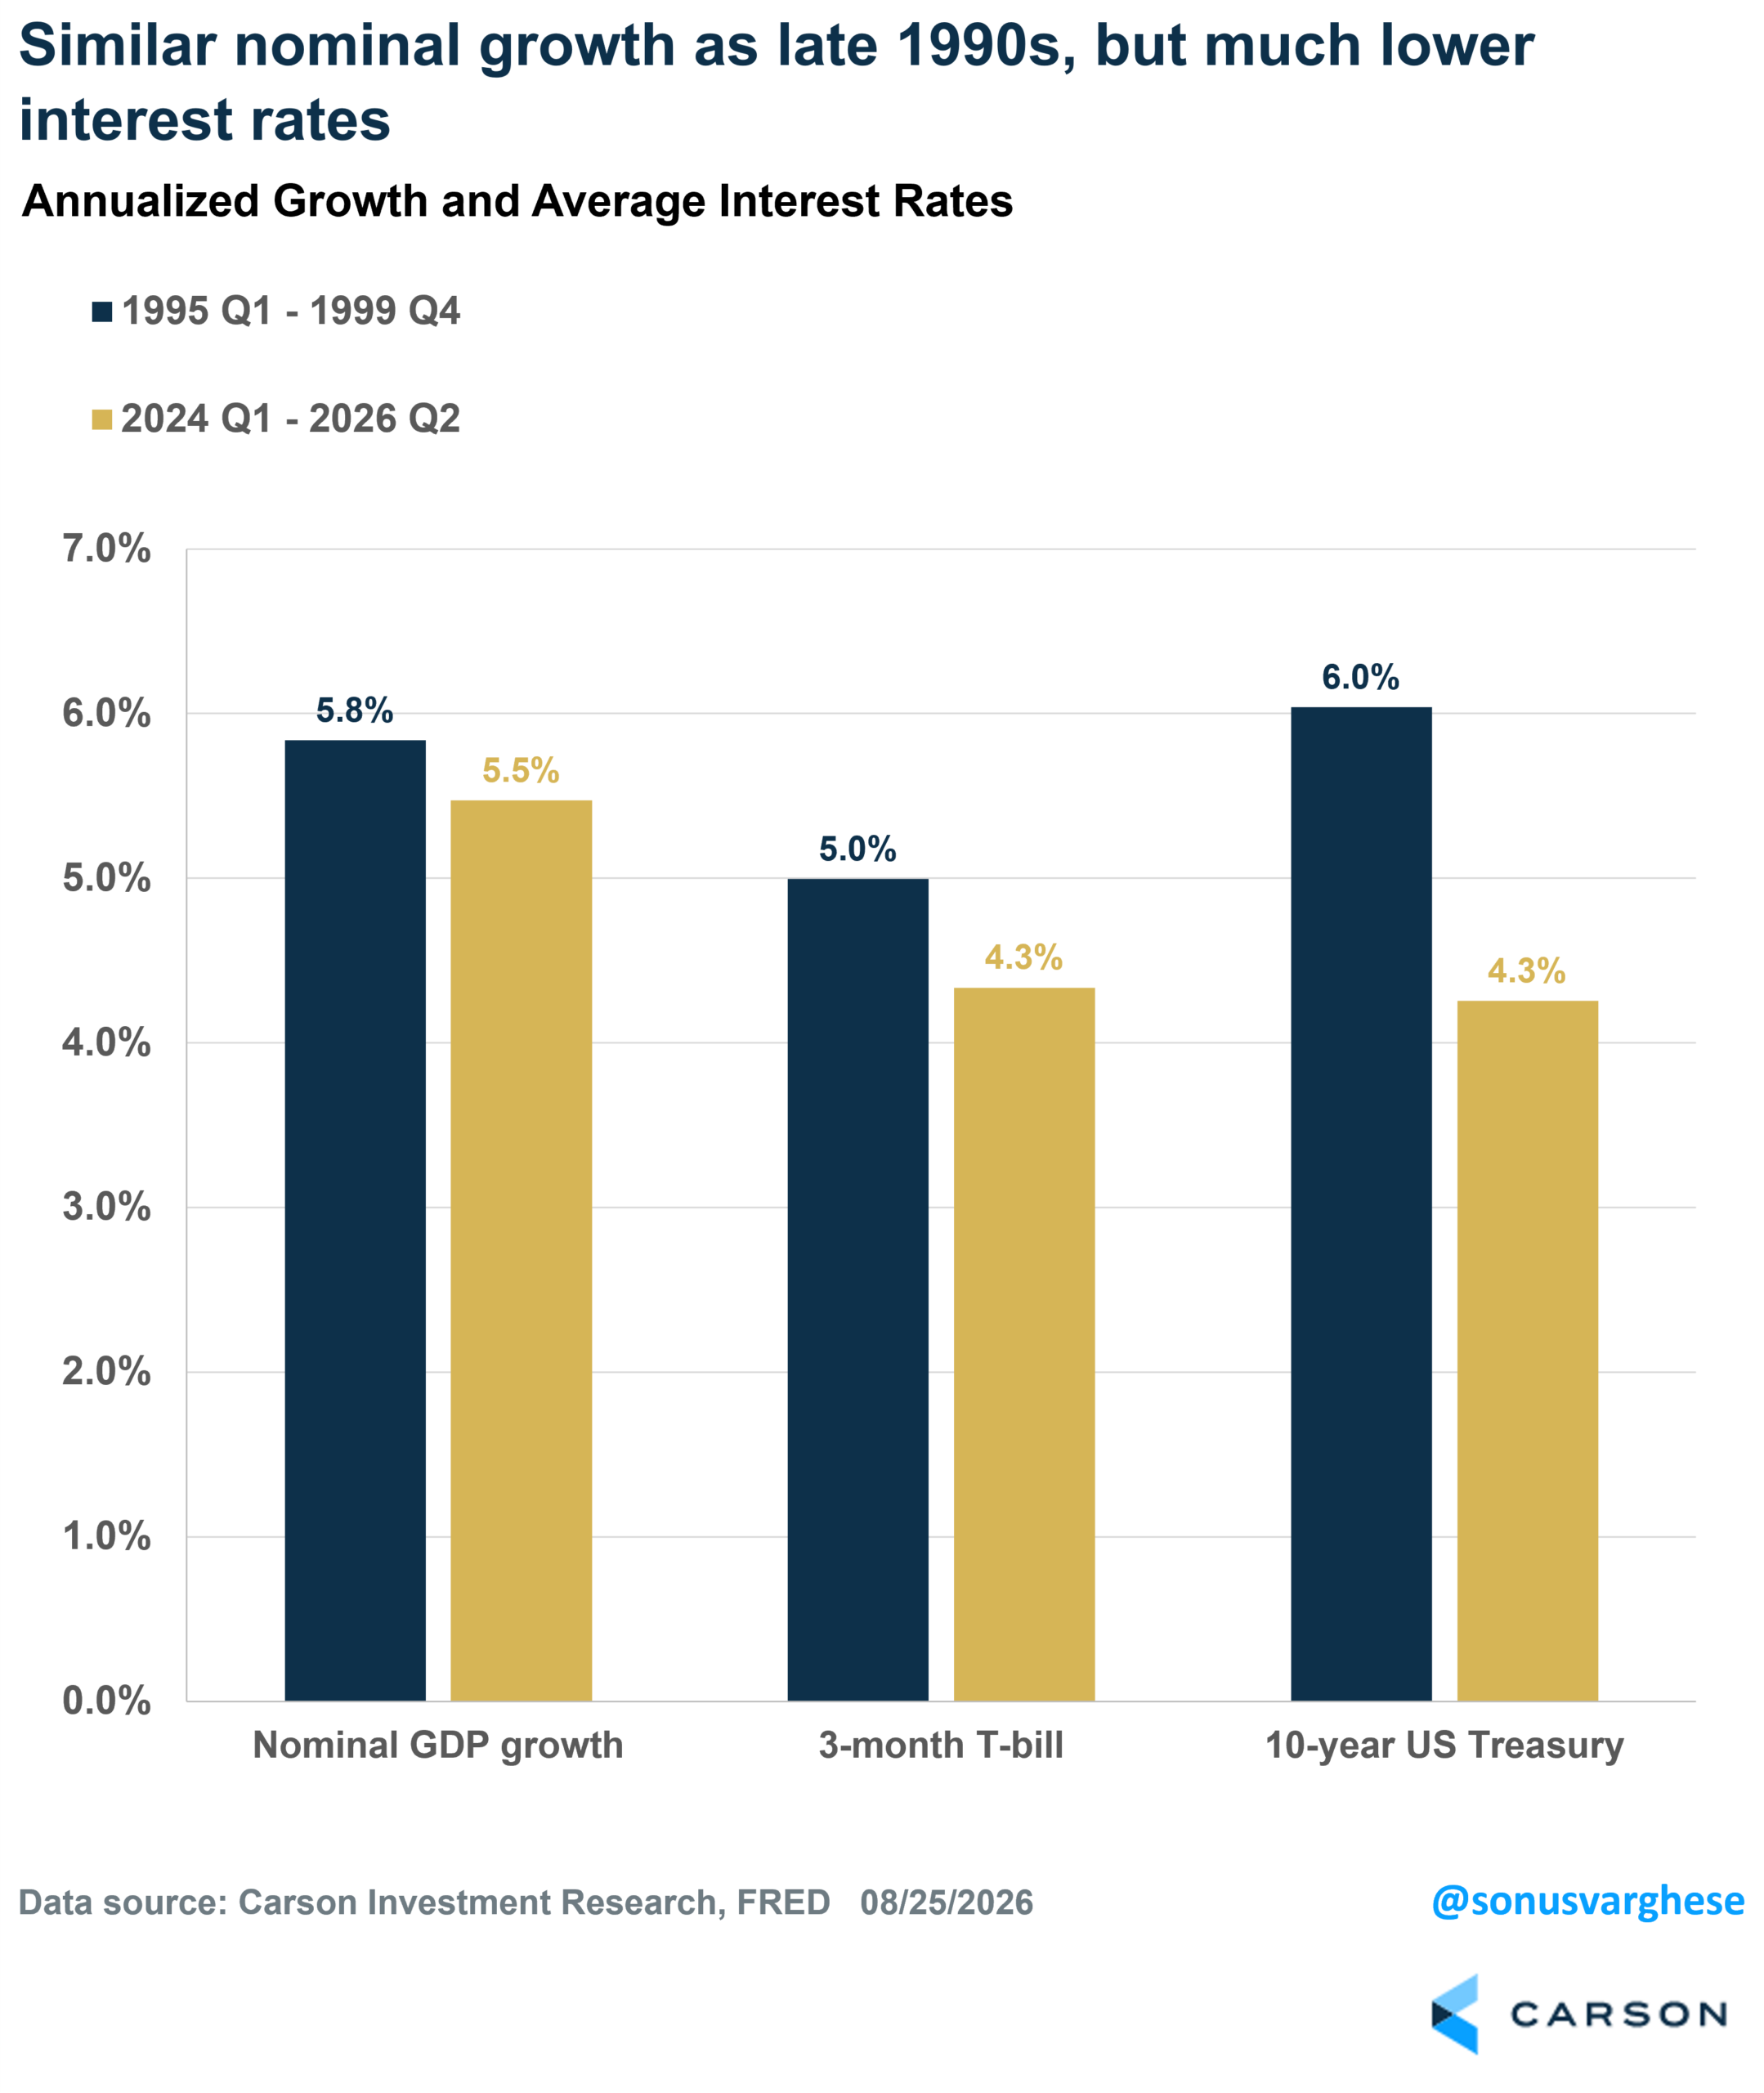
In other words, the Fed is running policy pretty easy despite nominal GDP growth near 6%, similar to the mid-to-late 1990s and above the 2010-2019 trend of 4%. The reason is elevated inflation, which doesn’t look headed back to 2% anytime soon.
You could argue long-term yields are finally “normalizing,” but they remain well below 1990s levels. The fiscal backdrop is radically different: a budget surplus of almost 1% of GDP in 1999 versus a deficit near 6% today, while the primary balance swung from +4.5% to about -2%. That means much more Treasury supply and upward pressure on yields. Meanwhile, AI is increasingly competing with the government for credit. As I wrote in my prior blog, the AI capex boom needs enormous capital, and financing is shifting from free cash flow to debt.
Long-end yields could stay below 1990s levels if investors expect inflation and growth to pull back significantly. If that doesn’t materialize anytime soon, as we expect, yields could be pulled higher. Probably with a whole lot of kicking and screaming.
Klein also points out that real interest rates (nominal rates minus expected inflation) are not especially high now, relative to the late 1990s. But he raises another possibility: rates weren’t high enough in the late 1990s. Quoting from his piece:
“But there are also good reasons to think that monetary policy in the last productivity boom was too loose, thereby undermining the sustainability of the investment surge and (partially) sowing the seeds for the subsequent housing debt bubble and financial crisis. From this perspective, rates would need to rise even more. “
Greenspan raised rates from 4.75% in August 1999 to 6.5% by July 2000. That helped prick the bubble, but likely came too late, and stocks endured a lost decade. He then reversed quickly, cutting rates to 2% by the end of 2001 and 1% by 2003. As Klein notes, that helped lay the seeds for the housing bubble.
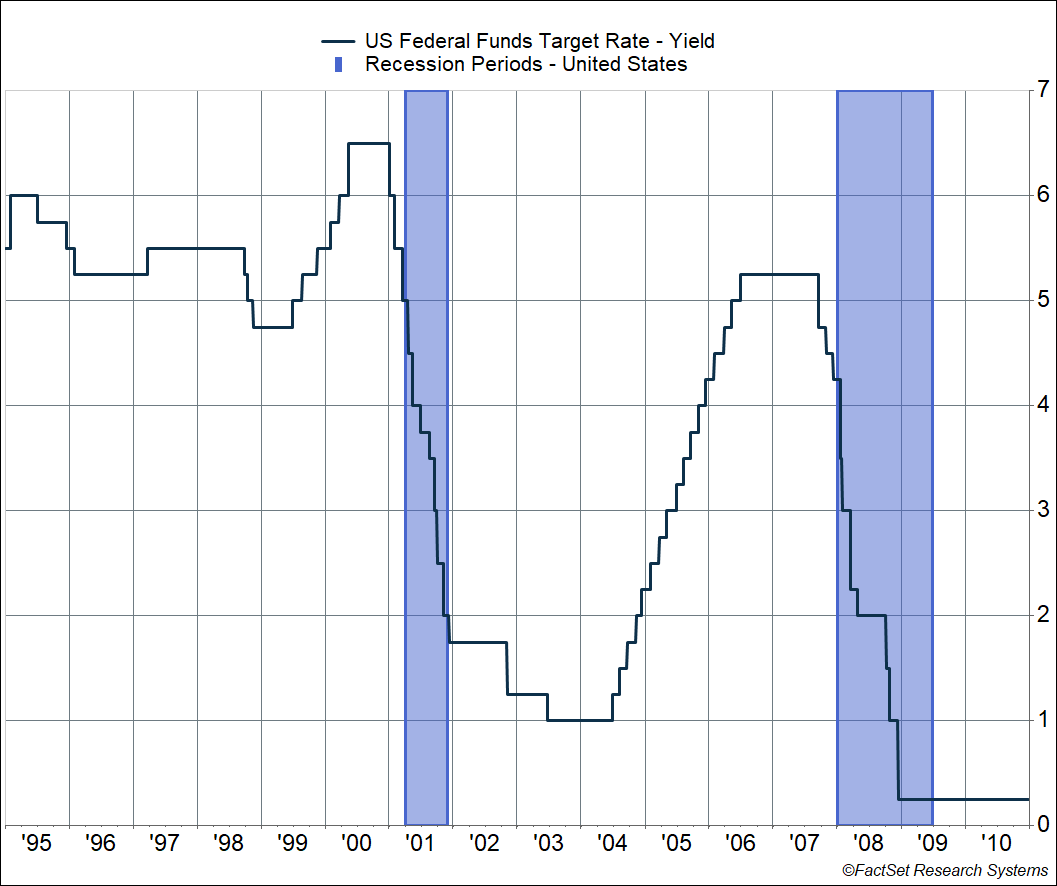
All this to say, you could make a case for even higher rates from two angles.
- Current short- and long-term rates are well below late-1990s levels despite similar nominal growth. There’s also much more demand for credit, from government deficits and the AI buildout.
- Rates in the 1990s may not have been high enough, which is why we got the bubble, the bust, and a lost decade.
Higher rates may not be costless, but I’ll take near-term volatility over a boom that keeps getting larger, only to crash and leave a long hangover. It may already be too late to put a damper on what’s happening. So, we ride the wave, but try to avoid a wipeout.
Ryan and I talked a lot about this in our latest Facts vs Feelings episode. Take a listen:
For more content by Sonu Varghese, Chief Macro Strategist, click here.
9095920.1. – 26AUG26A