
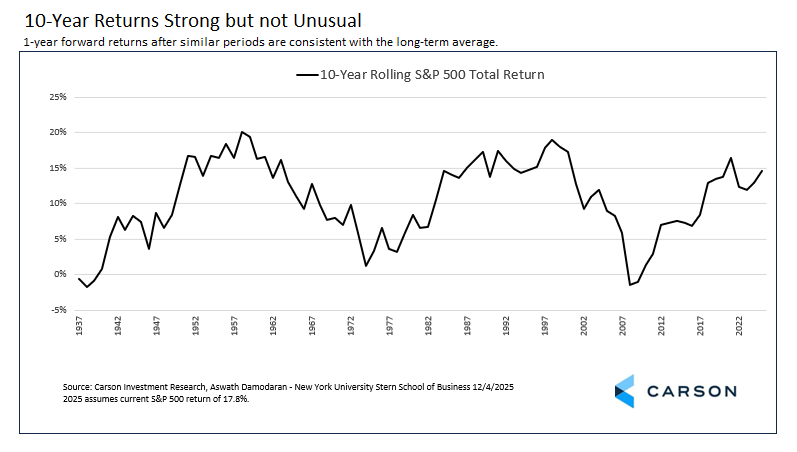
- The S&P 500 could still top 20% three years in a row, something that’s only happened one other time since 1929.
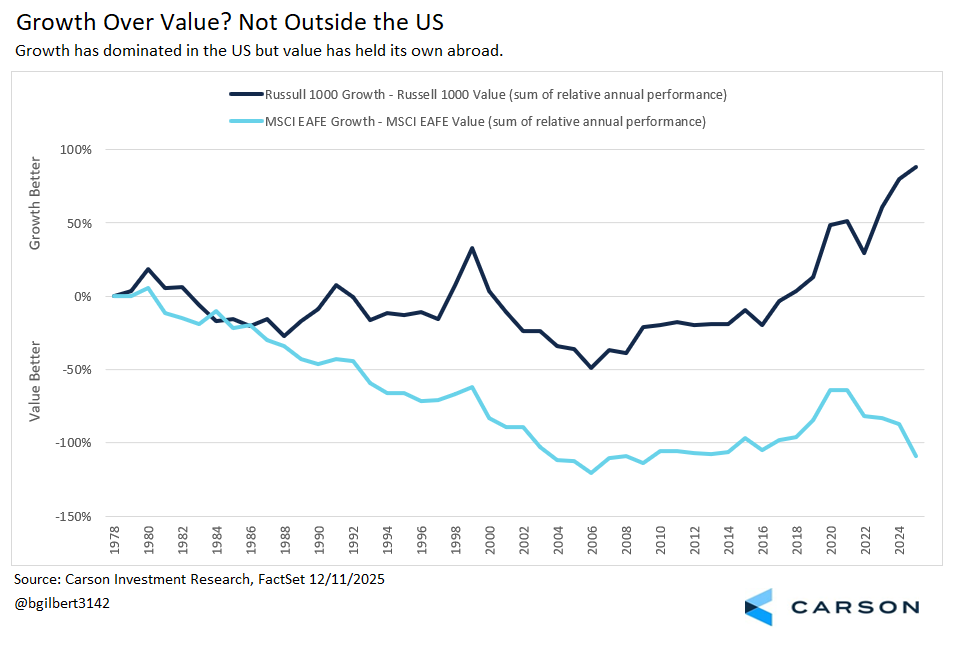
- The EAFE Value Index is ahead of the Russell 1000 Growth Index by almost 20%-points—the last time EAFE Value outperformed in a year both were higher was 2006.
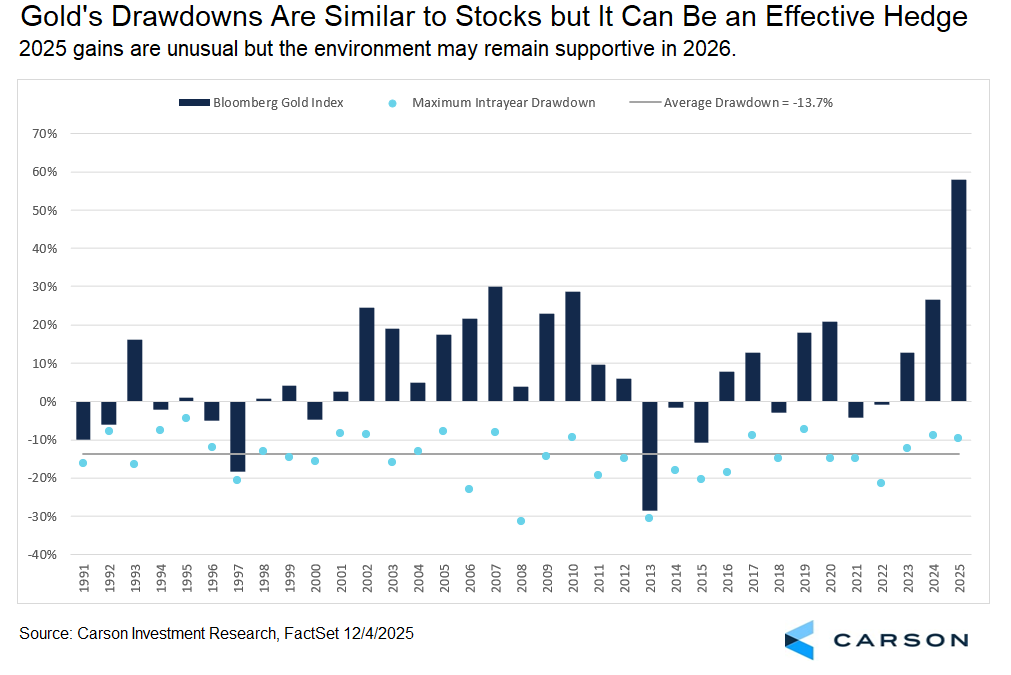
- The Bloomberg Gold Index is up 58%, its best year (by a wide margin) since 1979.
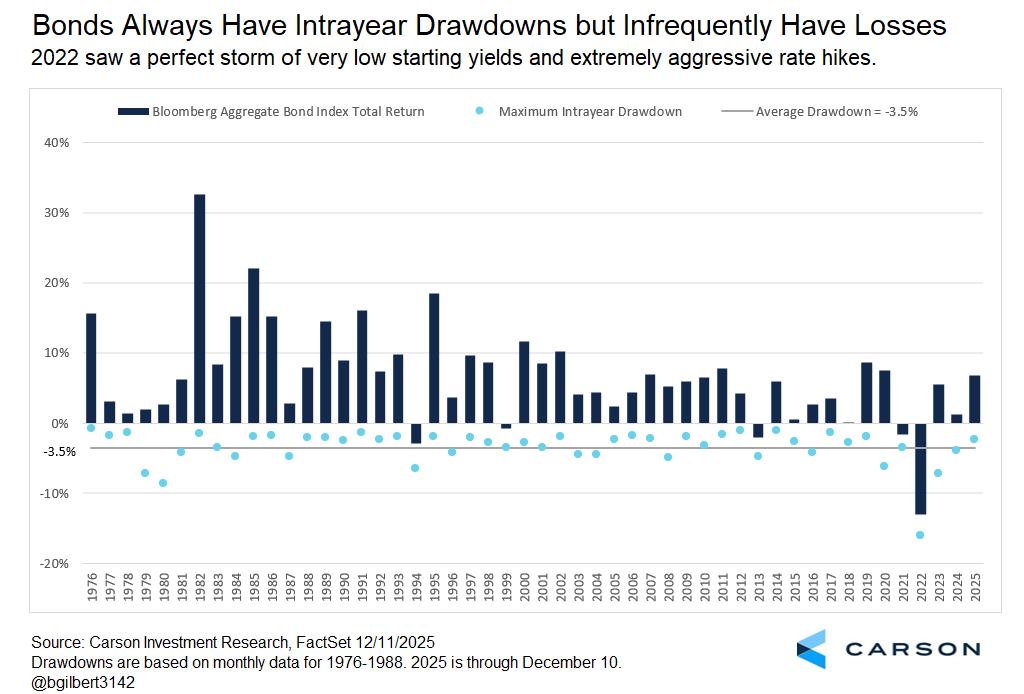
- The Bloomberg US Aggregate Bond Index is having its best year since 2020 and outpacing 1-3 month Treasury bills by almost 3%-points.
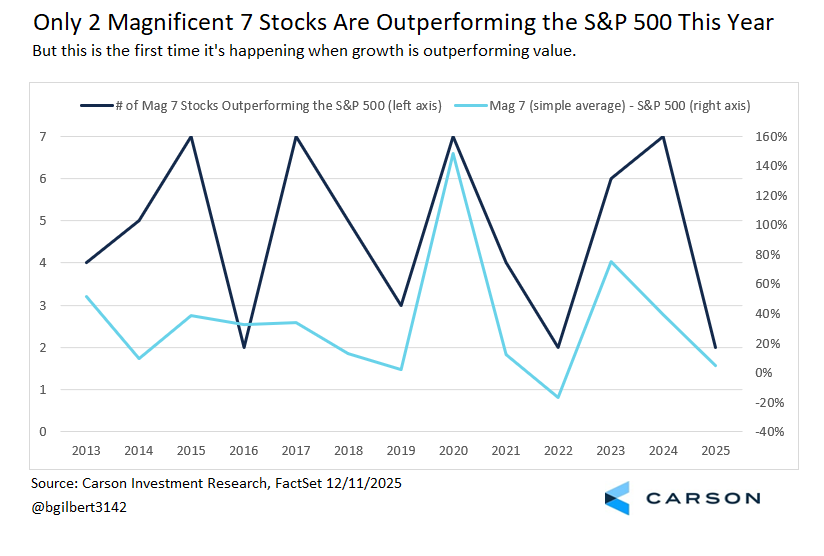
- Only two “Magnificent 7” stocks are currently beating the S&P 500, which would tie the worst count in the 13 years all seven have been around for a full calendar year.
As the market year starts to wind down, we thought it would be fun to take a look at some noteworthy numbers we may see by the end of the year, with a quick takeaway for each on what it might mean for 2026.
The S&P 500 May Top 20% Three Years in a Row
As of close on December 3, the S&P 500 was up 17.8% year to date on a total return basis. If it stays above 15%, it will be the third consecutive year of a more than 15% gain. Given that’s not too much higher than average you would think that would be fairly common, but it’s actually not although I wouldn’t call it rare. Going back to 1928 (by ending year), it happened once in the 1940s (4-year streak from 1942–1945); once in the 1950s (4-year streak from 1949–1952), once in the 1990s (5-year streak from 1995–1999); and once in the 2020s (2019–2021).
There’s also a chance we could finish the year up above 20% making it three consecutive years above 20%. That’s only happened once, a 5-year streak from 1995–1999.
Returns the year after a 3-year streak are about average, 8.3% for a >15% streak and 13.4% for a >20% streak, but that’s over a small sample (with some crossover). The key point is there’s nothing to indicate returns are poorer than usual after three years of solid gains. It just depends on the return environment, which we think will be favorable in 2026 (see Carson Chief Market Strategist Ryan Detrick’s recent Thinking About 2026).
Digging deeper, if the S&P 500 closed the year at the current 17.8% level, its 10-year annualized return would be 14.7%. That’s strong but only good for the 25th best rolling 10-year return starting with the 1928–1939 period, and one-year returns following similar periods are also consistent with long-term averages. Again, look to the return environment. For the 10 rolling 10-year periods that were most similar (five better and five worse), the average return in the next year was 25.3% with all 10 positive. Expand that out to the most similar 20 rolling 10-year periods (10 higher and 10 lower) and the average return the next year was 22.0% and 19/20 were higher. We don’t necessarily expect those kinds of numbers, but it tells you that the strength over the last three and ten years isn’t something to worry about in itself. If anything, the historical data tells you that momentum is a powerful thing.
International Value Equities Thrash US Growth
I don’t think there are a lot of people out there who were forecasting that the MSCI EAFE Value Index, an index of non-US developed market value stocks, would almost double up the Russell 1000 Growth Index, especially in a strong year for the US index, but that’s exactly what we would have if the year ended today. The EAFE Value Index is up 38.8% as of Wednesday’s close, the Russell 1000 Growth Index is up 20.0%. That’s not just because of a few names in the EAFE Value Index–the largest holding in the index has just a 2.6% weight and there’s also a fair amount of sector diversity in the top 10 holdings, including health care, staples, financials, energy, materials, utilities, and consumer discretionary (although financials do appear four times). Let’s push this even one step further—if the year ended today this would be the fourth year in a row that EAFE Value beat EAFE Growth. That hasn’t happened for the US value and growth indexes since a seven-year stretch from 2000–2006. That may say more about the state of EAFE Growth companies (top names ASML, Astrazeneca, Novartis, and SAP) compared to their US counterparts than the strength of EAFE Value.
Below is an additive chart of the relative performance of the Russell 1000 Growth and Value Indexes (comparing just the two US style indexes) and the EAFE Growth and Value Indexes (comparing the two EAFE Indexes). The takeaway is that the entire idea of “growth” and “value” has been distorted in the US (not necessarily in a bad way) by tech giant dominance, which has pulled smaller cap style indexes in its wake. But style has been much more balanced outside the US. Don’t give up on value whole cloth—context matters. There hasn’t been a real style edge in developed markets outside the US, and in some ways that may be a purer representation of those quirky but ubiquitous style boxes.
You can also see that value has been implicitly shunned in the US (perhaps not without reason) compared even to the 1995–1999 tech bubble. The first three years of the tech bubble (1995–1997) the Russell 1000 Value Index actually outperformed the Russell 1000 Growth Index. Yes things were quite different in 1998 and 1999 and there were some high-flying extremes outside these two major indexes, but it puts the extraordinary run by US growth companies since 2006 in context.
Gold Glitters
As of December 10, the Bloomberg Gold Index is up 58% year to date. If the year ended today, that would be the best return since 1979 (using spot prices) and it’s not even close. (The next best year would be 2007, when the gold spot price climbed 31.9%, a far cry from what we’re seeing this year.)
Stocks have performed well so far this year. Bonds have too relative to their recent history. If investors were buying stocks and bonds, what was pushing gold prices higher? Gold has certainly seen its share of demand and there are a number of reasons. Geopolitical risk certainly played a role. Fed and broad central bank cutting in the face of persistent inflation has as well. Central banks have also been diversifying their reserves by buying gold although be careful with that one—there have been some distortions from looking at the value of gold reserves (which is impacted by prices) rather than unit purchases. But the buying has still been meaningful.
When we added gold to our portfolios in March 2023, we saw some upside but were really thinking of gold compared to bonds and the potential diversification benefit. We did not expect the outsized gains gold has produced, but we won’t complain.
Gold is almost as volatile as stocks are, but its history of a low correlation to stocks and low correlation to bonds—especially during inflationary periods—means its contribution to risk in a typical portfolio is much lower than as a standalone asset. Especially as a bond diversifier, we continue to see the potential value of a modest allocation to gold, for risk mitigation in the current environment as much as for its return potential. But don’t expect that “potential” to be anything like what we’ve seen in 2025.
The Carson Investment Research newsletter offers up-to-date market news, analysis and insights. Subscribe today! "*" indicates required fields![]()
Stay on Top of Market Trends
Who’s Afraid of Bonds? 2025 Has Been Great
The most tepid of my “unusual things markets did in 2025” is a very solid year for bonds so far—7.0% for the Bloomberg US Aggregate Bond Index (“Agg”) as of Wednesday’s close, which is the top of end of our expectations from our 2025 Outlook. If the year ended today, that would be the best return for the index since 2020 (+7.5%). It would also just about double the annualized return for the decade from 2010 to 2019 (+3.7%) and solidly outpacing the return for short maturity Treasuries this year (+4.1% for the Bloomberg US 1-3 Month Treasury Bill Index).
In terms of risk and return bonds generally operate on a different scale than stocks, but when you miss out in a diversified portfolio due to a high cash allocation it can have an impact on portfolio returns. When looking at bonds strategically, we never tire of highlighting that yields are strong predictors of returns over the life of a bond, because you know that the price will be par at maturity. Except for reinvesting coupon, it doesn’t matter what rates do between now and then. Over the entire period to maturity, the gravitational pull of par will dominate rate changes. But the story is different tactically. In the short term, price changes due to changes in yield dominate the slower moving pull of par. Nevertheless, the yield to maturity is still a good starting point for expected returns and yields have been attractive.
We don’t expect core bond returns to be as strong next year and short-term yields would still be relatively attractive even with additional rate cuts, but we also think the fear of the 2022 bond losses has persisted longer than merited. Since its inception in 1976, the Bloomberg US Aggregate Bond Index has had five years with a loss. Yes, it will happen again and probably a little more frequently than the historical record since we are far from the nosebleed starting yields of the 80s, but gains 90% of the time isn’t a bad track record.
The “Magnificent 7” Have Only Been Pretty Good
The “Magnificent 7” are a group of tech and tech-adjacent megacap stocks that currently make up about 35% of the S&P 500. It consists of Alphabet (Google’s parent company), Amazon, Apple, Meta Platforms (formerly Facebook), Microsoft, NVIDIA, and Tesla. As a group, all seven have existed as publicly traded companies since May 18, 2012 when Facebook went public. (Apple, the grandaddy of the Mag 7, went public in 1980.)
A blog for another day, leadership in the S&P 500 does change and even over their shared existence some of these stocks were much smaller than they are today. (They became the Mag 7 by going through an extraordinary period of stock gains.) In fact, at the end of 2012, only three current members (Apple, Alphabet, and Microsoft) were in the S&P 500’s top 10 for market cap and the seven largest at that time included Exxon, Walmart, Berkshire Hathaway, and Chevron.
This year, a simple average of the Mag 7 is still beating the S&P 500, outpacing the index by 4.5%-points. But if the year ended today, that would only be the 11th best year of the 13 years they were all around for a full calendar year. And yes, they did underperform one year, in 2022, the best year for value stocks relative to growth since 2008 as investors fled to lower risk stocks.
Looking at it in terms of the number of Mag 7 stocks outperforming the S&P 500, In 2016 and 2022 only two did, but this could be the third year. The difference with those years? In 2016, the Russell 1000 Value Index outperformed the Russell 1000 Growth Index 17.3% to 7.1%; in 2022 it was -7.5% to -29.1%. This year, the growth index is outperforming the value index 20.0% to 16.0%, a relatively narrow spread granted but still a year when growth has been in favor.
Now you may look at the chart below and say, “Yes, but it’s bouncing around. Doesn’t that mean next year is likely to be better?” It’s certainly a possibility but the breadth weakness of the Mag 7 in a year growth is outperforming value may be telling us something. It’s not that these aren’t good companies—I’m not making a judgement about that here one way or the other. But it may be that investors have already priced in a lot of economic dominance among these companies, and even if there’s more upside from AI, there may also be winners and losers among this group, not to mention the potential for new names to appear.
Every year is extraordinary in its own way and there are many other things I could have highlighted here, not least of which was the incredible S&P 500 gains off its April 4 closing low. If there’s a theme here it’s been a good year for diversification even in a context of overall stock gains: gold, international value, bonds, amid less dominance by the Mag 7. That’s a lesson worth taking into 2026.
For more content by Barry Gilbert, VP, Asset Allocation Strategist click here.
8663240.1. – 12DEC25A
