
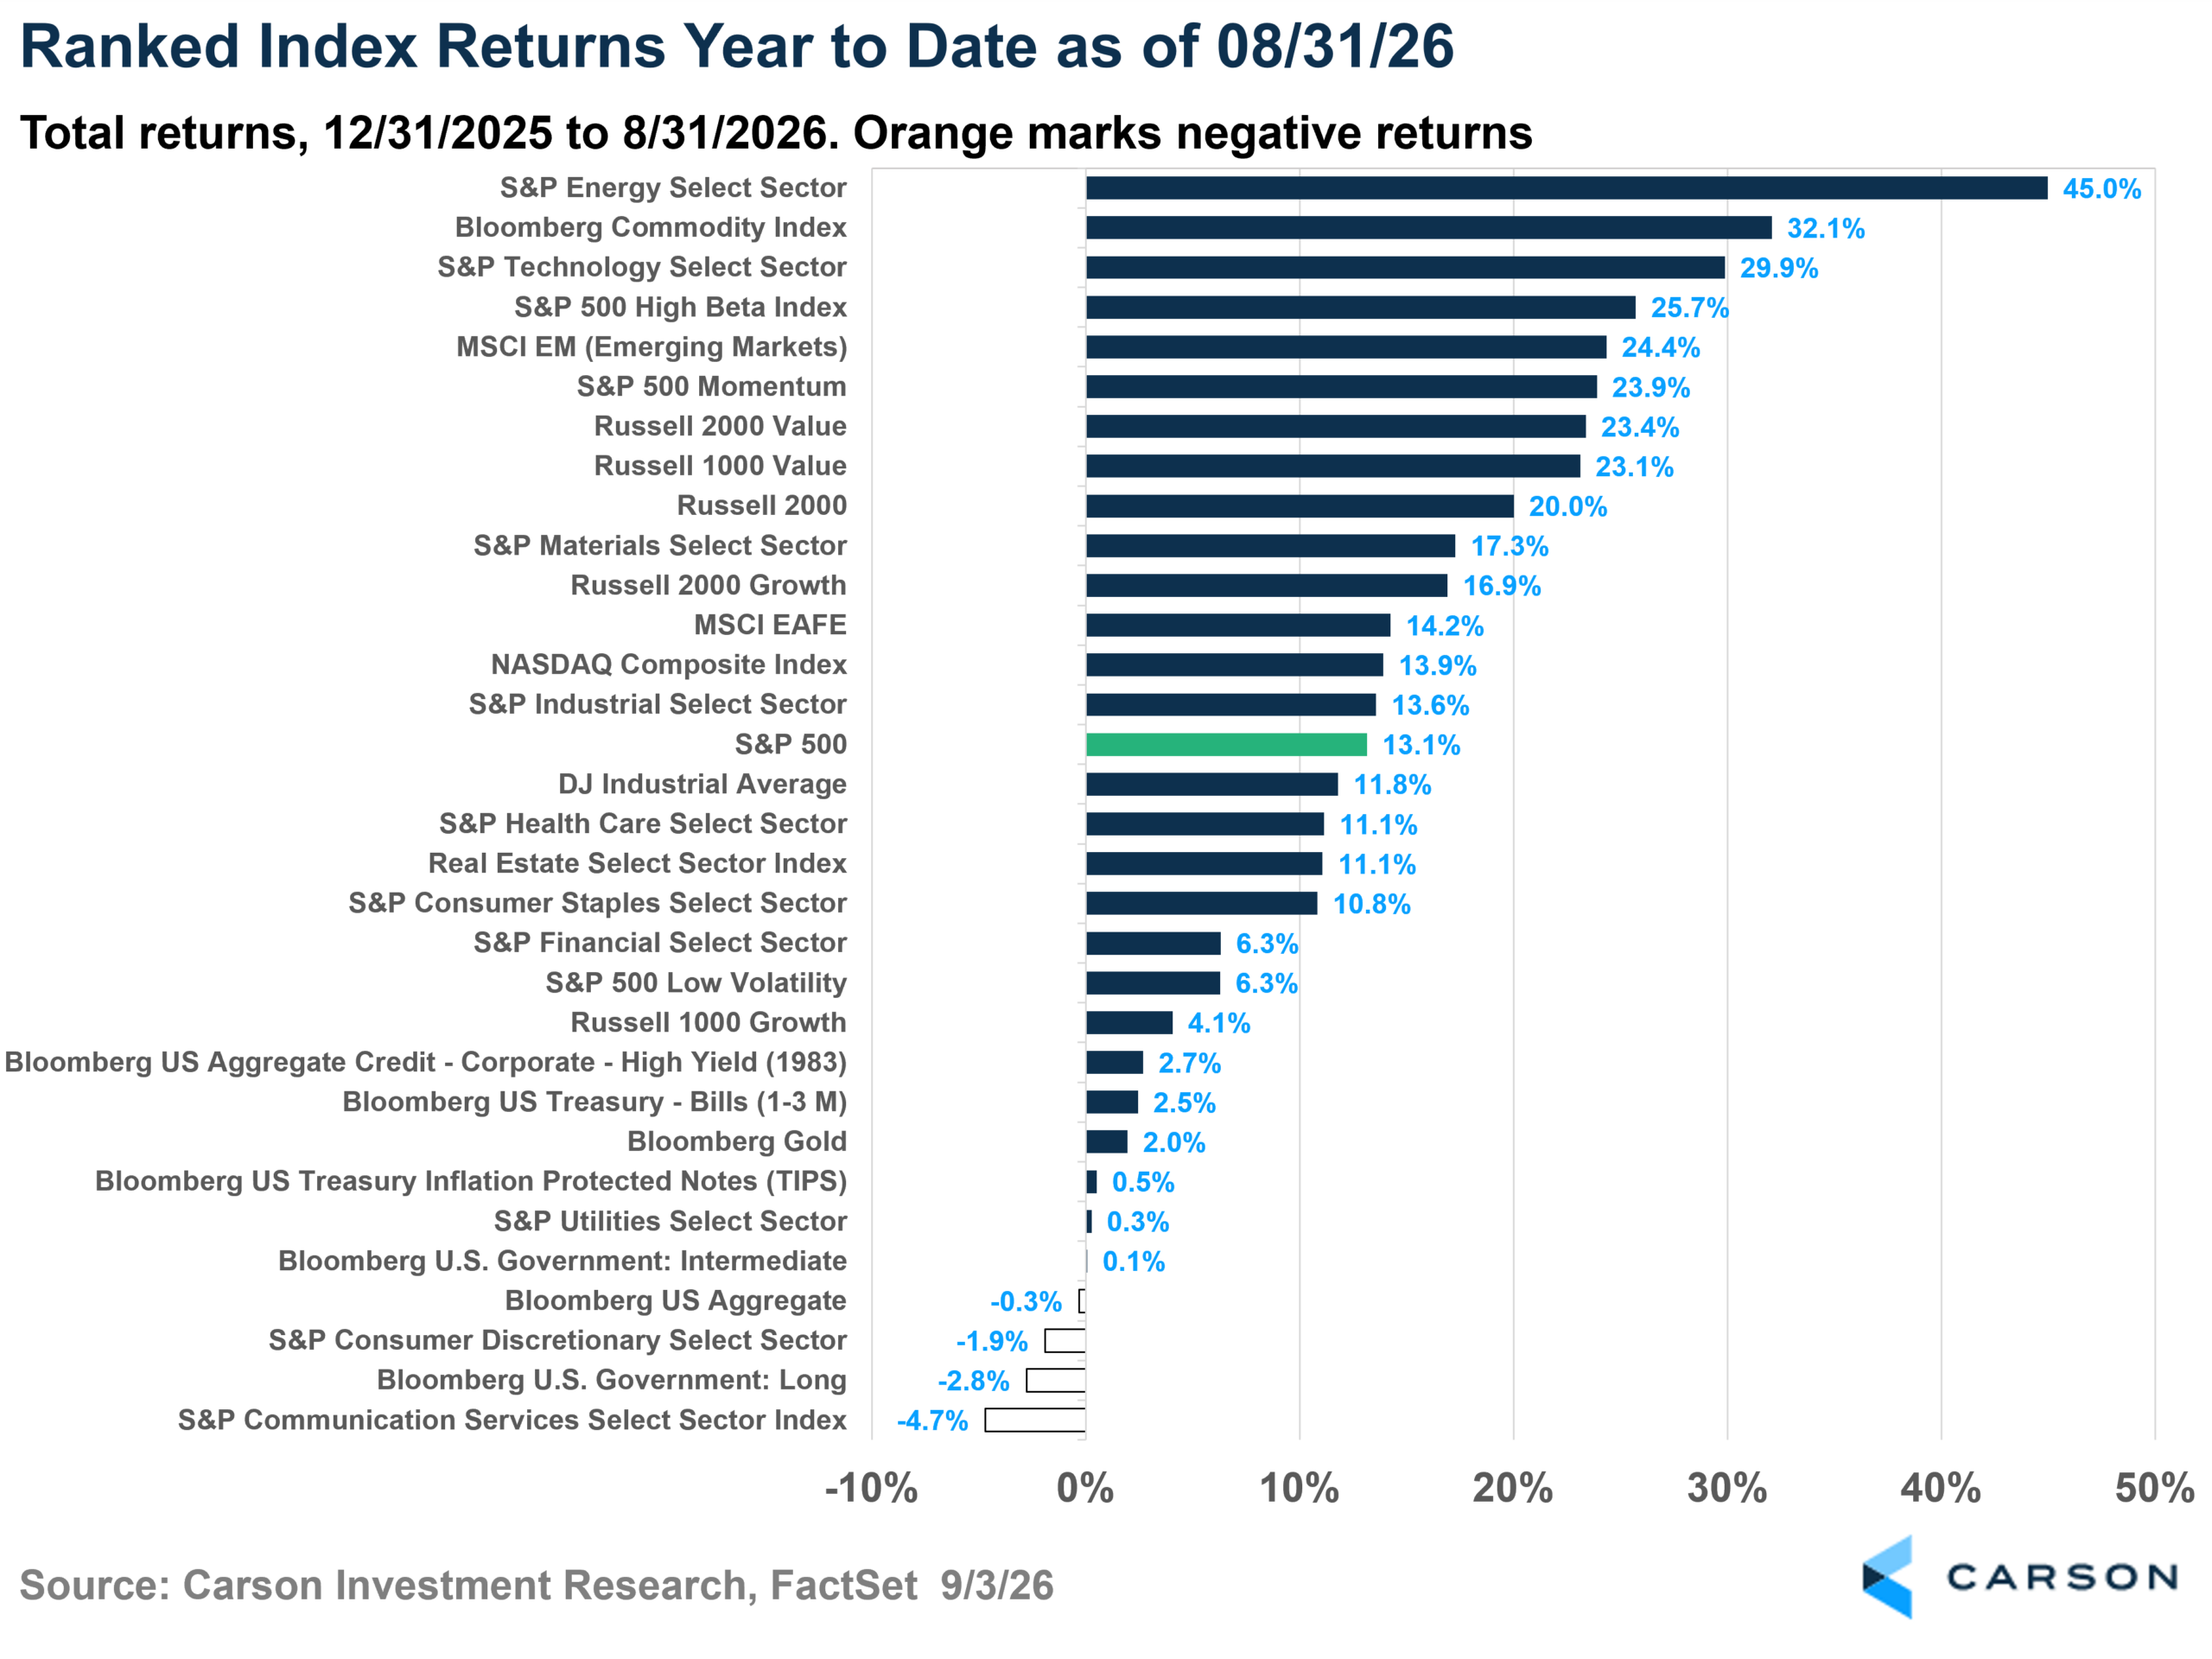
The S&P 500 climbed 2.7% in August, snapping two straight months of modest losses and lifting the index to a 13.1% total return for the year. If 2026 ended right here, that would be a fairly ordinary year. But there is a lot of the year left, and the more interesting story is the texture underneath the number.
Energy and technology have been the two best sectors of 2026, energy up 45% and technology up 30%. In August, they finished first and second on the sector leaderboard. That sounds like confirmation of the year’s trend; however, it may be closer to the opposite. For the first seven months, when energy zigged, technology zagged. The two ran a correlation of −0.75 over that stretch, and August was the first month all year that both landed in the top two together.
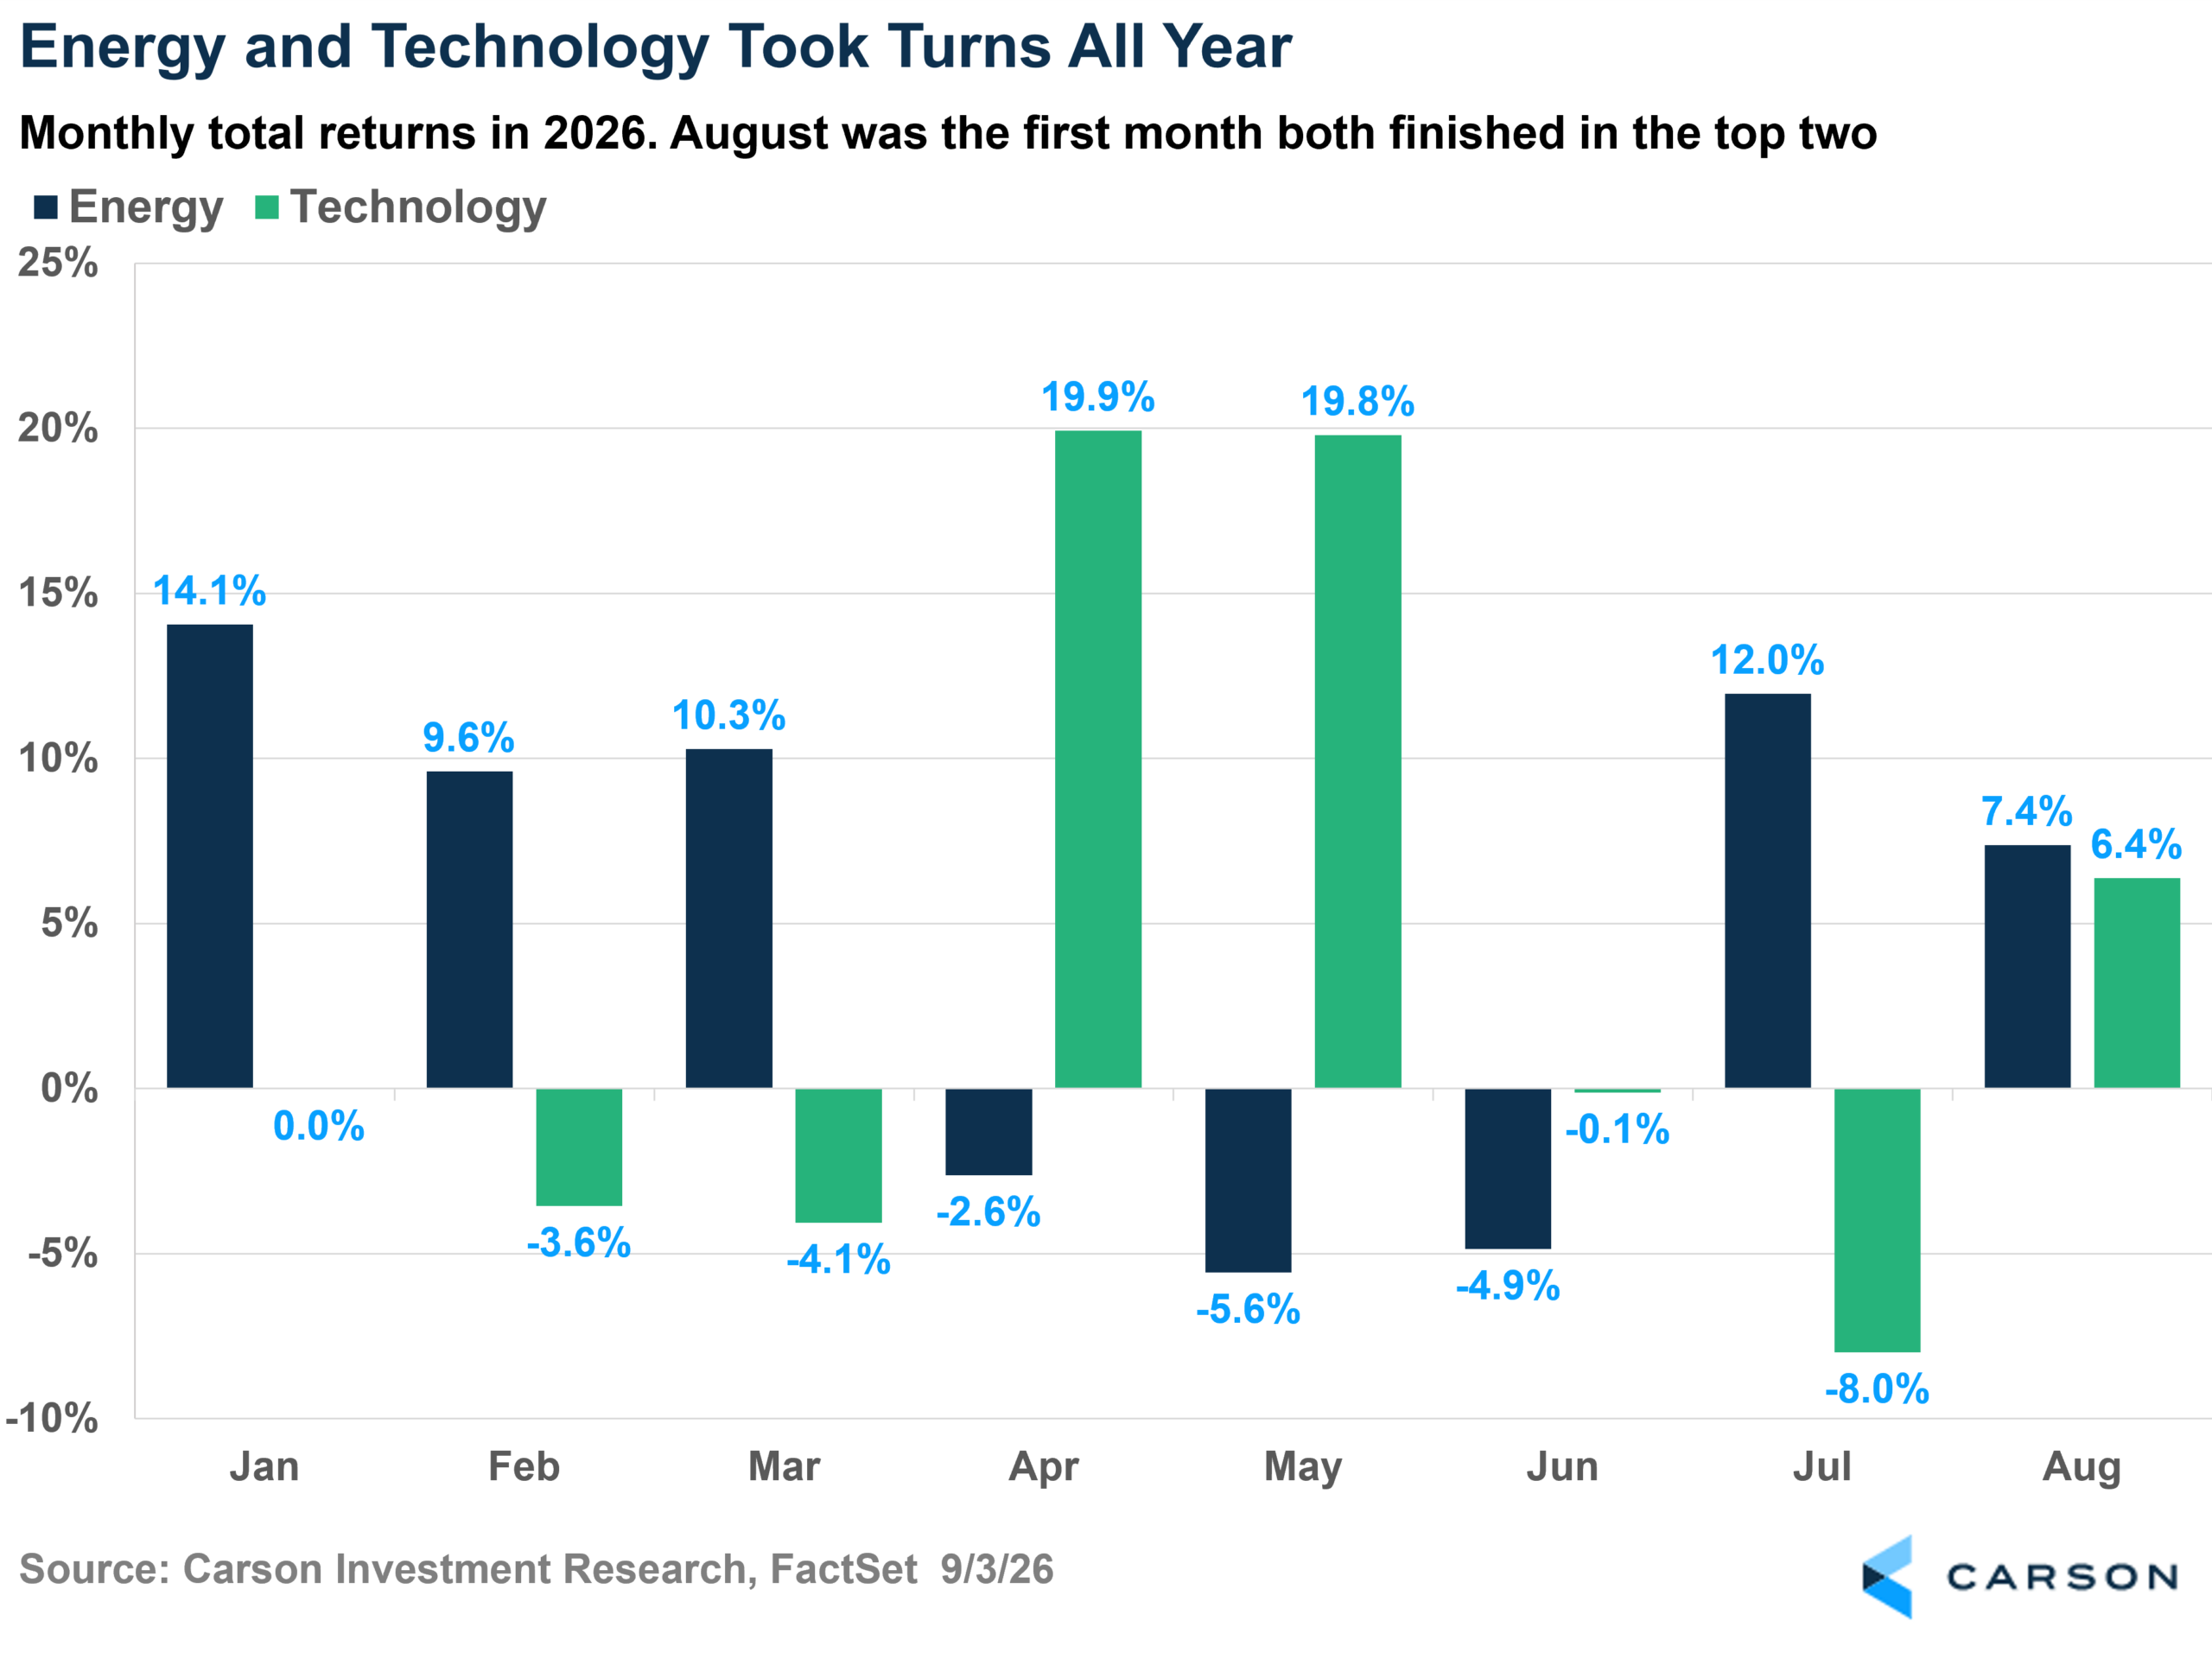
A −0.75 correlation between two sectors is unusual. Over the full history of our sector data, 176 months back to January 2012, energy and technology actually run a positive 0.30 correlation with each other. Only one earlier seven-month stretch, the window ending May 2017, was more negative than what we just went through.
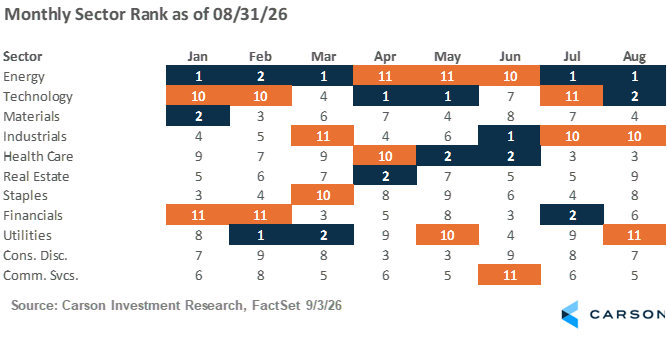
Energy has been the more extreme of the pair. Treat it as a rough proxy for oil prices and the risk premium around the Middle East conflict, and it finished either in the top two or bottom two of the 11 sectors every month of 2026. Top two five times, in January, February, March, July and August. Bottom two three times, in April, May and June. That eight-month streak is the second longest in our database, tied with utilities’ run from January to August 2014. The only longer one belongs to technology, which spent 12 straight months at one extreme or the other from December 2024 through November 2025, seven times in the top two and five times in the bottom two.
Technology has been nearly as polarized this year, landing in the top or bottom two in six of eight months. Top two in April, May, and August; bottom two in January, February, and July. There has been very little middle ground in this market.
So the two sectors spent the year pulling against each other and both still ended up at the top of the leaderboard. Two separate and powerful stories, AI capital spending and geopolitical energy risk, have been taking turns.
Technology Had a Good Month, But a Different Month
Zooming inside the technology sector, August was not simply a continuation of a strong year. It was a rotation of its own. On an equal-weighted basis, the industries that led technology in August were almost exactly the industries that had lost ground over the first seven months.
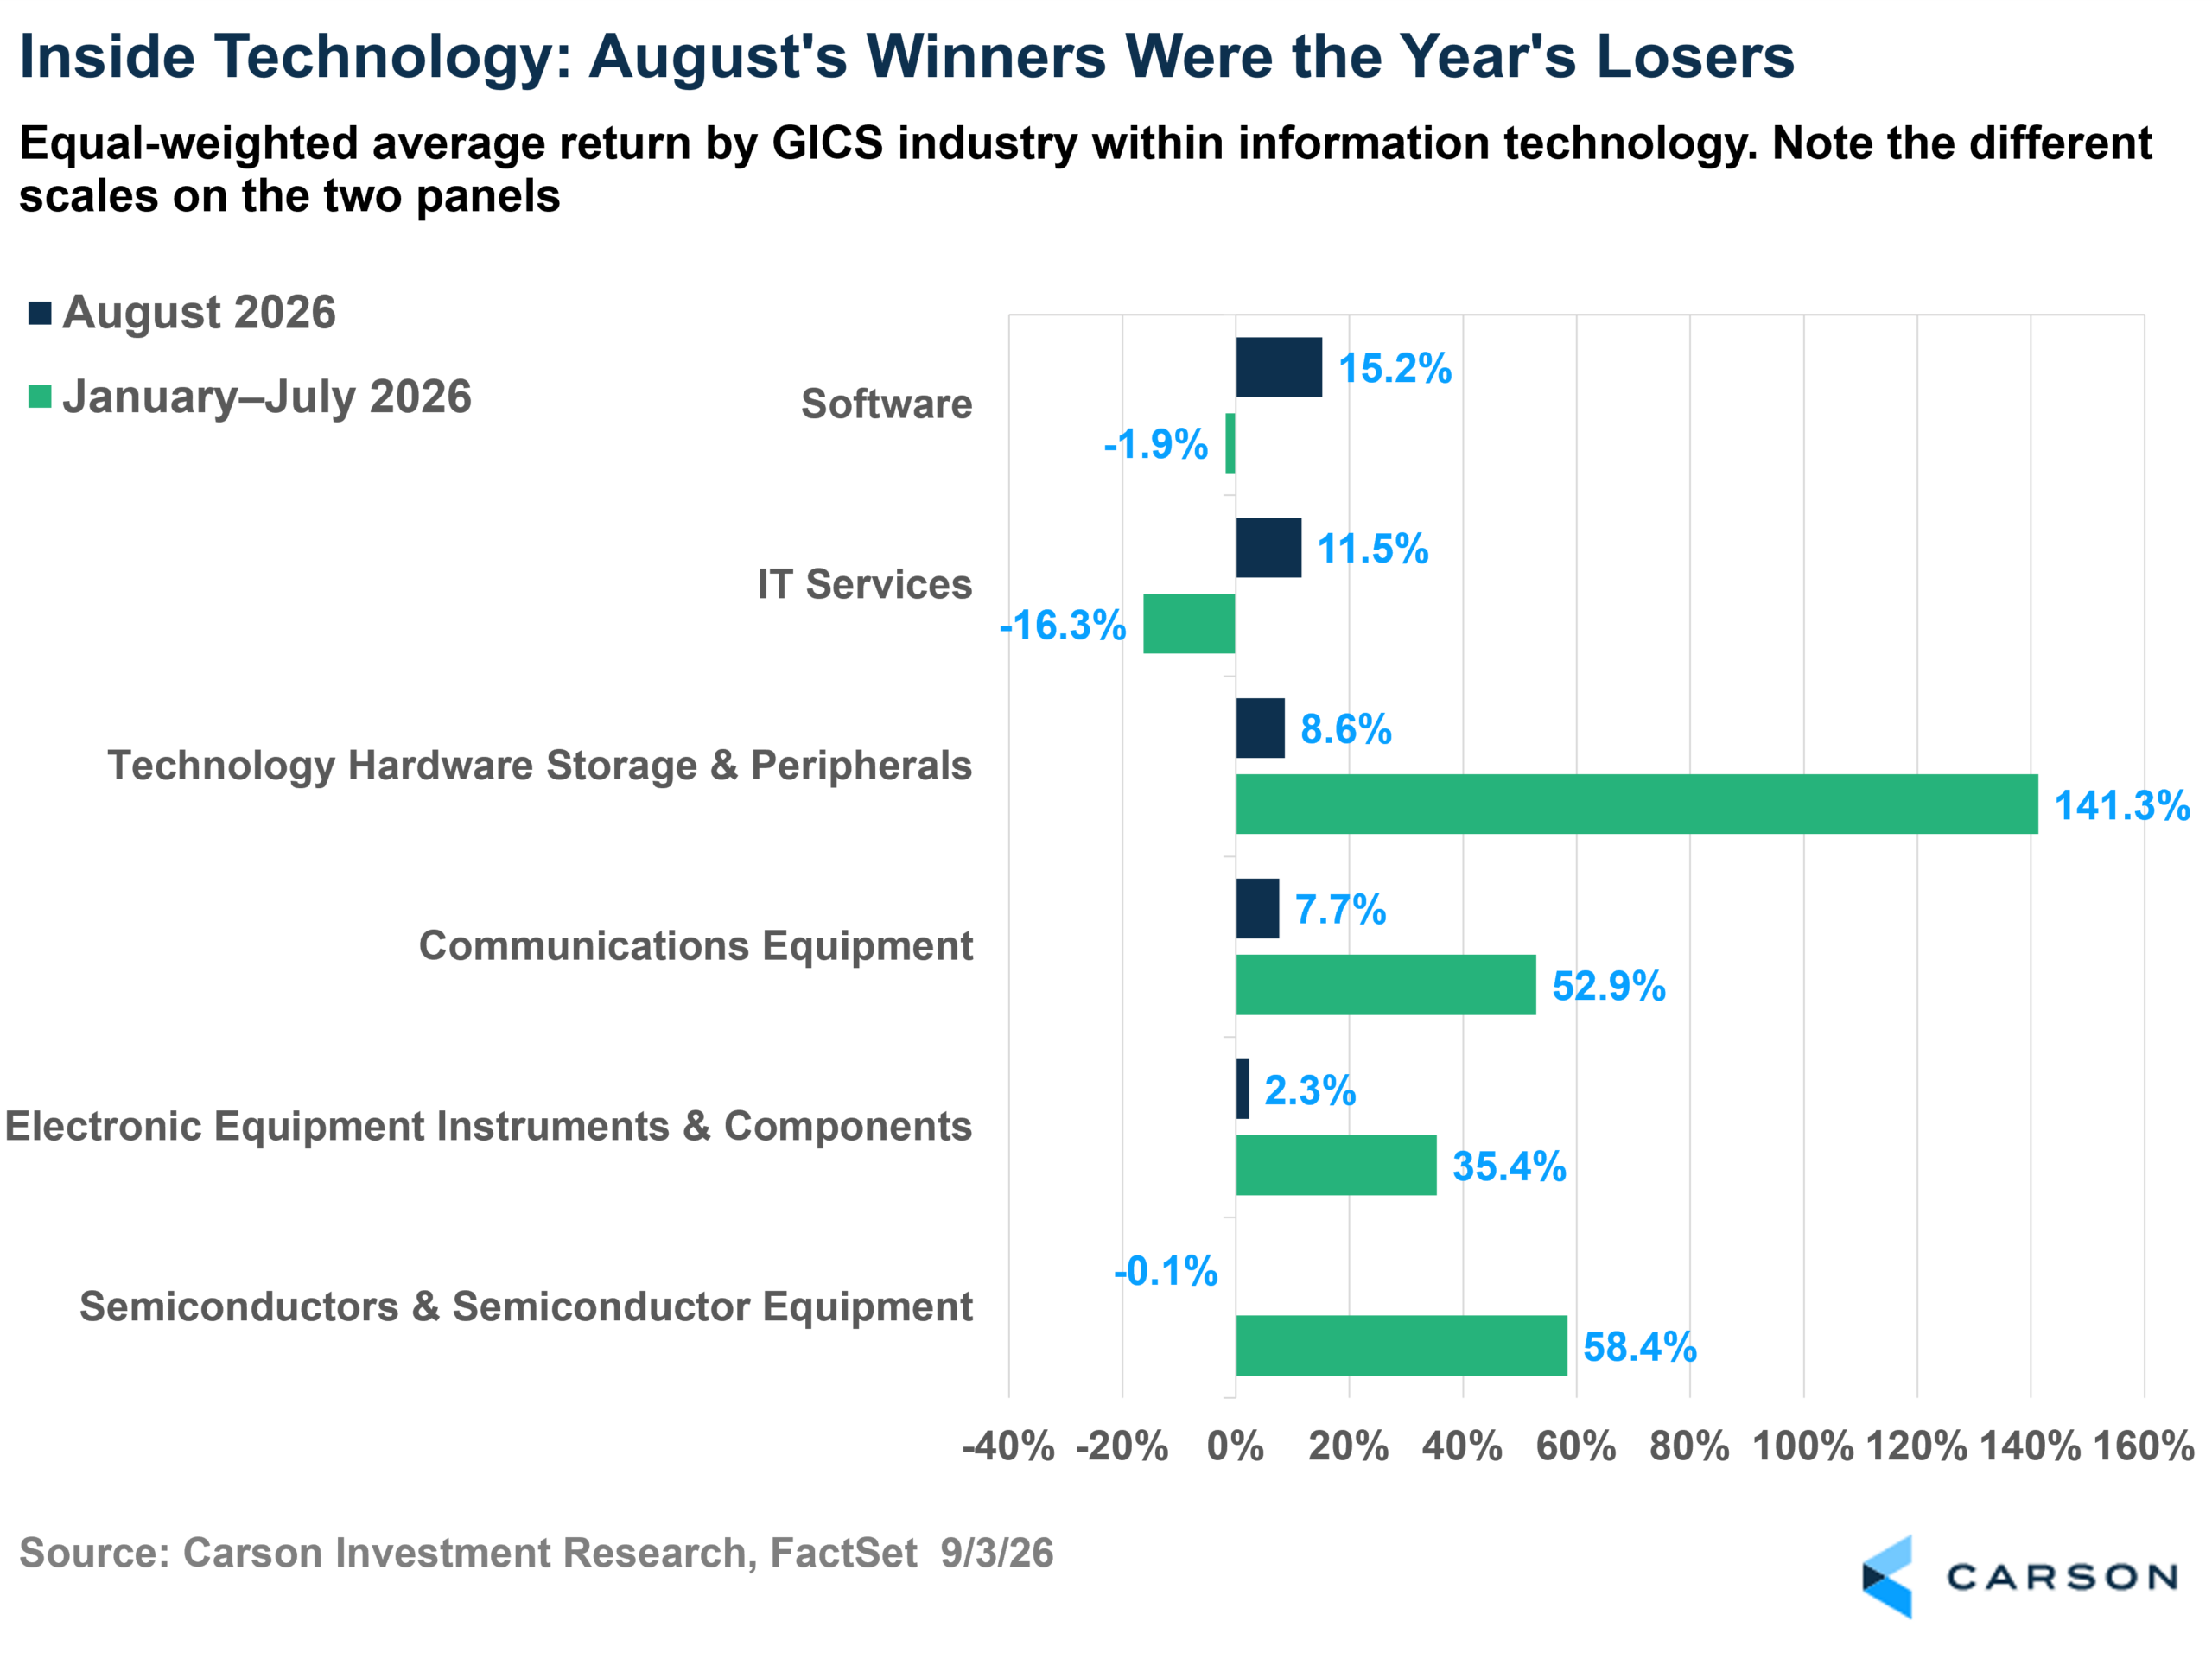
Software returned an equal-weighted 15.2% in August after losing 1.9% from January through July, and IT services returned 11.5% after losing 16.3%. Those two ranked first and second among the six technology industries in August, and fifth and sixth over January through July.
The AI infrastructure trade, meanwhile, cooled. Semiconductors were the second-best technology industry over the first seven months at an equal-weighted 58.4%, and the worst in August at −0.14%. Hardware, storage and peripherals, the year’s runaway leader at 141% equal-weighted on the back of the memory and storage names, slowed to 8.6%. Across the six industries, the cross-sectional correlation between August returns and January through July returns was −0.34.
The individual names make it sharper. Palantir gained 51.5% in August after falling 30.8% over the first seven months. Salesforce gained 40.0% after falling 30.2%, ServiceNow gained 33.0% after falling 27.4%, and Gartner gained 31.2% after falling 40.1%. Going the other direction, Western Digital fell 17.3% in August after gaining 216.5% earlier in the year, and Seagate slipped 3.2% after gaining 211.7%.

Stay on Top of Market Trends
The Carson Investment Research newsletter offers up-to-date market news, analysis and insights. Subscribe today!
"*" indicates required fields
However, the equal-weighted software average for January through July was only −1.9%, but the median software name was down 21.2%. A handful of large winners, Fortinet, Datadog, and CrowdStrike among them, carried the average. In August, the mean and median were close, 15.2% and 13.5%, which is what a broadening-out move looks like.
The megacaps split along the same seam. Microsoft, a software name, gained 9.4% in August. NVIDIA, a semiconductor name, gained 10.0%. Apple, a hardware name, managed 2.7%. The Magnificent Seven returned 4.68% equal-weighted for the month, ahead of the index for once, but they remain up only 4.17% for the year against 13.1% for the S&P 500.
Why does this matter? If you read the year as “AI is working,” the natural way to express that was the infrastructure layer: chips, memory, storage, power. August was the first month the market paid for the application layer instead. One month is not necessarily a trend, but it is the kind of rotation you would expect to see in different stages of the buildout.
Broad Markets
The S&P 500’s 2.72% August return, dividends included, ended back-to-back declines in June (−0.95%) and July (−0.06%). It ranks 9th of the 39 Augusts in our data going back to 1988, against a median August of 0.66%. Stocks beat bonds again, though bonds at least stopped losing. The Bloomberg US Aggregate Bond Index, the “Agg,” gained 0.39% after falling 1.30% in July.
The gains skewed toward large caps and toward growth. The Russell 2000 managed only 0.98%, the S&P SmallCap 600 was actually negative at −0.60%, and the S&P MidCap 400 was flat at 0.15%. Small caps have had a strong year, with the SmallCap 600 up 20.8%. International kept pace without leading, with MSCI EAFE up 2.00% and MSCI Emerging Markets up 3.40%, and both are still ahead of the S&P 500 for the year at 14.2% and 24.4%.
Equity Sectors
Seven of 11 sectors rose in August, up from six in July. All 11 are higher over the trailing year, and nine of 11 are higher year to date. Energy led at 7.4%, and technology followed at 6.4%, the pairing we opened with. Energy’s 45.0% year to date leads technology’s 29.9% by a wide margin, and its 46.1% trailing year edges out tech’s 43.0%.
Health care rose 4.9% in August, its fourth consecutive monthly gain and its fourth straight month in the top three. It now leads all sectors over the last three months at 14.5%, even though it sits 5th year to date at 11.1%. Financials extended a streak of their own to three straight gains, adding 1.3%, good enough for 3rd place over three months at 12.3% despite ranking 8th of 11 year to date at 6.3%.
On the other side of the ledger, utilities were the worst sector in August at −4.8% and are last over three months at −4.4%. Industrials fell for a second straight month at −2.6% after leading in June, and real estate (−2.1%) and staples (−0.1%) declined as well. Only two sectors are negative year to date: communication services at −4.7% and consumer discretionary at −1.9%, which is not a coincidence given where several of the struggling megacaps live.
Equity Style
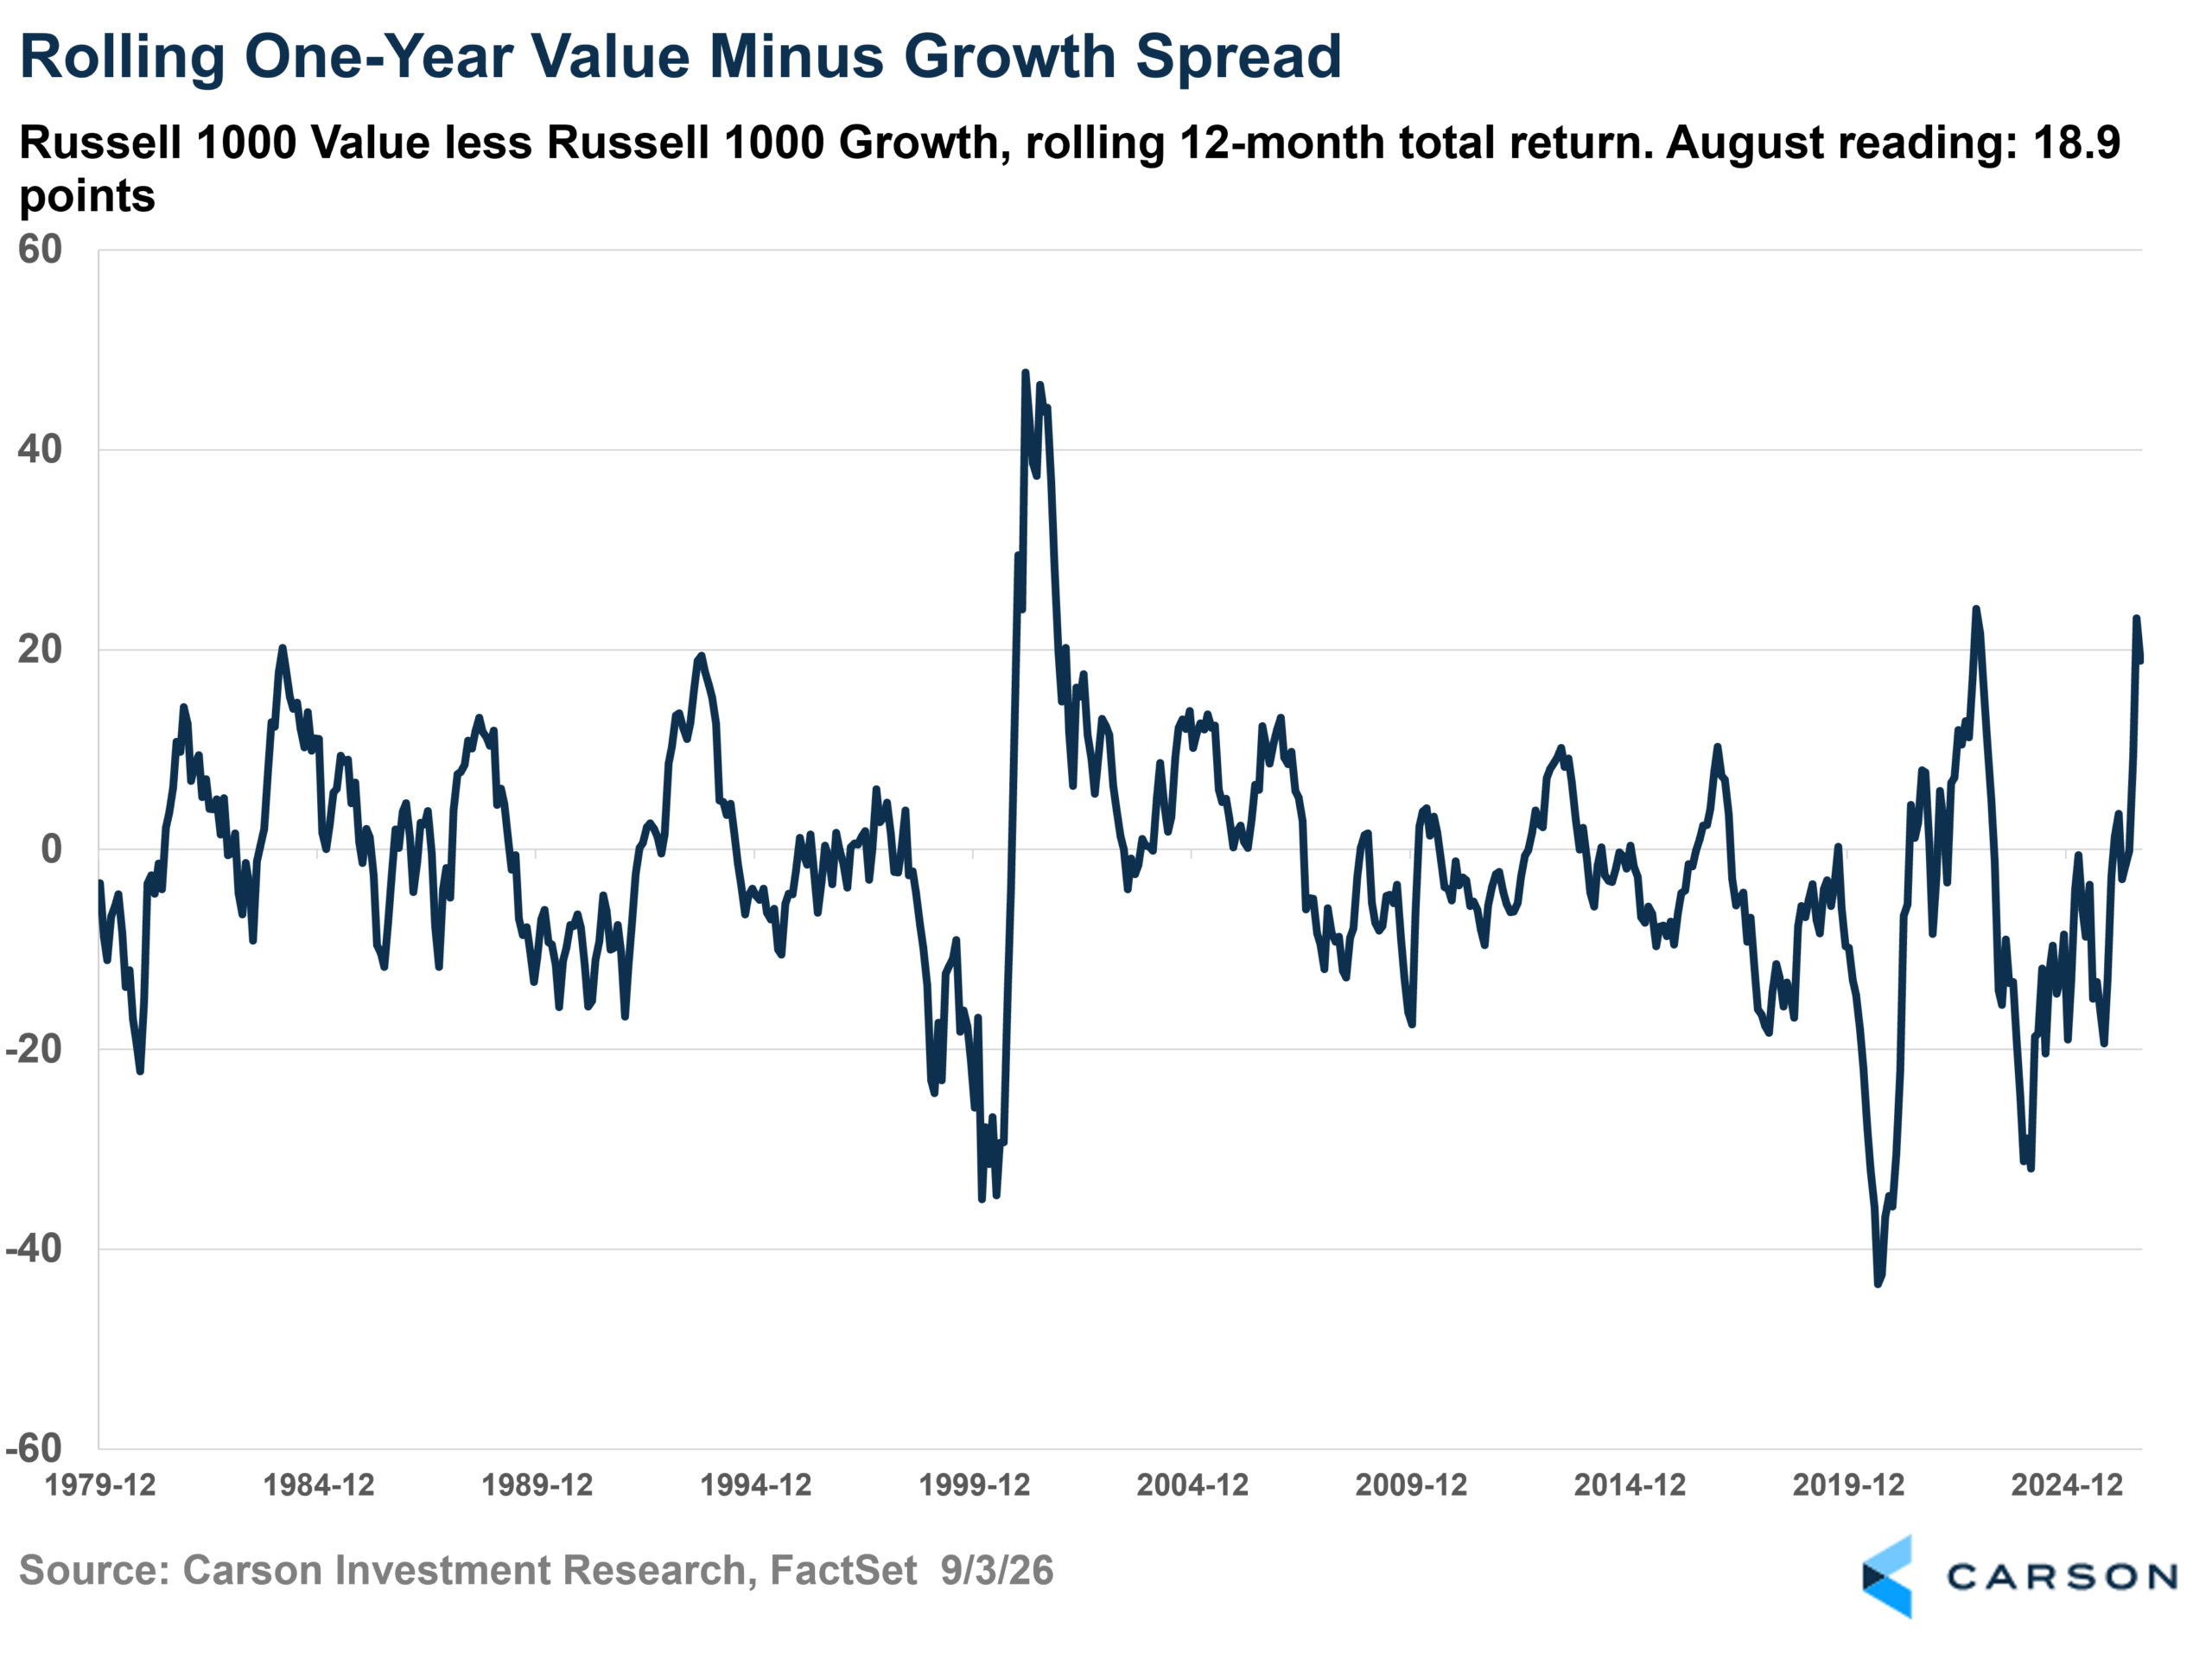
Growth beat value for the first time since May. The Russell 1000 Growth Index returned 3.73% against 2.03% for the Russell 1000 Value Index. A 1.70-point month against value is unremarkable on its own; however, it may be worth mentioning because July was an 8.58-point month for value, the 5th best of 572 months of history.
The year still belongs to value by a lot. Russell 1000 Value is up 23.12% year to date against 4.06% for Russell 1000 Growth, a 19.1-point gap. On a rolling one-year basis, the spread is 18.9 points, the 97th percentile of all 561 observations. Only 18 months in that history have printed higher, and 13 of those came in a single run from December 2000 through January 2002.
High beta and low volatility told the opposite story. The S&P 500 High Beta Index returned 4.62% in August while the S&P 500 Low Volatility Index lost 1.82%, a 6.44-point month for high beta and the 53rd best of the 429 months available. High beta is up 25.71% year to date against low volatility’s 6.28%.
Taken together: value is winning the year and paused in August, while high beta is winning the year and accelerated. Both are risk-on expressions right now, which means the value trade and the AI trade are no longer reliably offsetting each other.
Fixed Income
The Agg’s 0.39% gain in August followed a −1.30% July, its second decline of more than 1% this year, after March. Year to date, the Agg is down 0.31%. Coupon income means a flat-rate path from here would still leave it positive on the year, but it is running out of months to get there.
Cash keeps winning the fixed income race without taking any real risk. Bloomberg US 1-3 Month Treasury Bills are up 2.45% year to date while long government bonds are down 2.77%. The return has come from credit: high yield 2.7%, leveraged loans 2.8%, municipal high yield 2.7%, all ahead of the Agg and driven by equity-like risk rather than rates.
The Agg’s correlation with the S&P 500 on monthly data is 0.36 over the last year, 0.53 over three years, and 0.62 over five. Bonds diversify best when that number is near zero or below.
Commodities
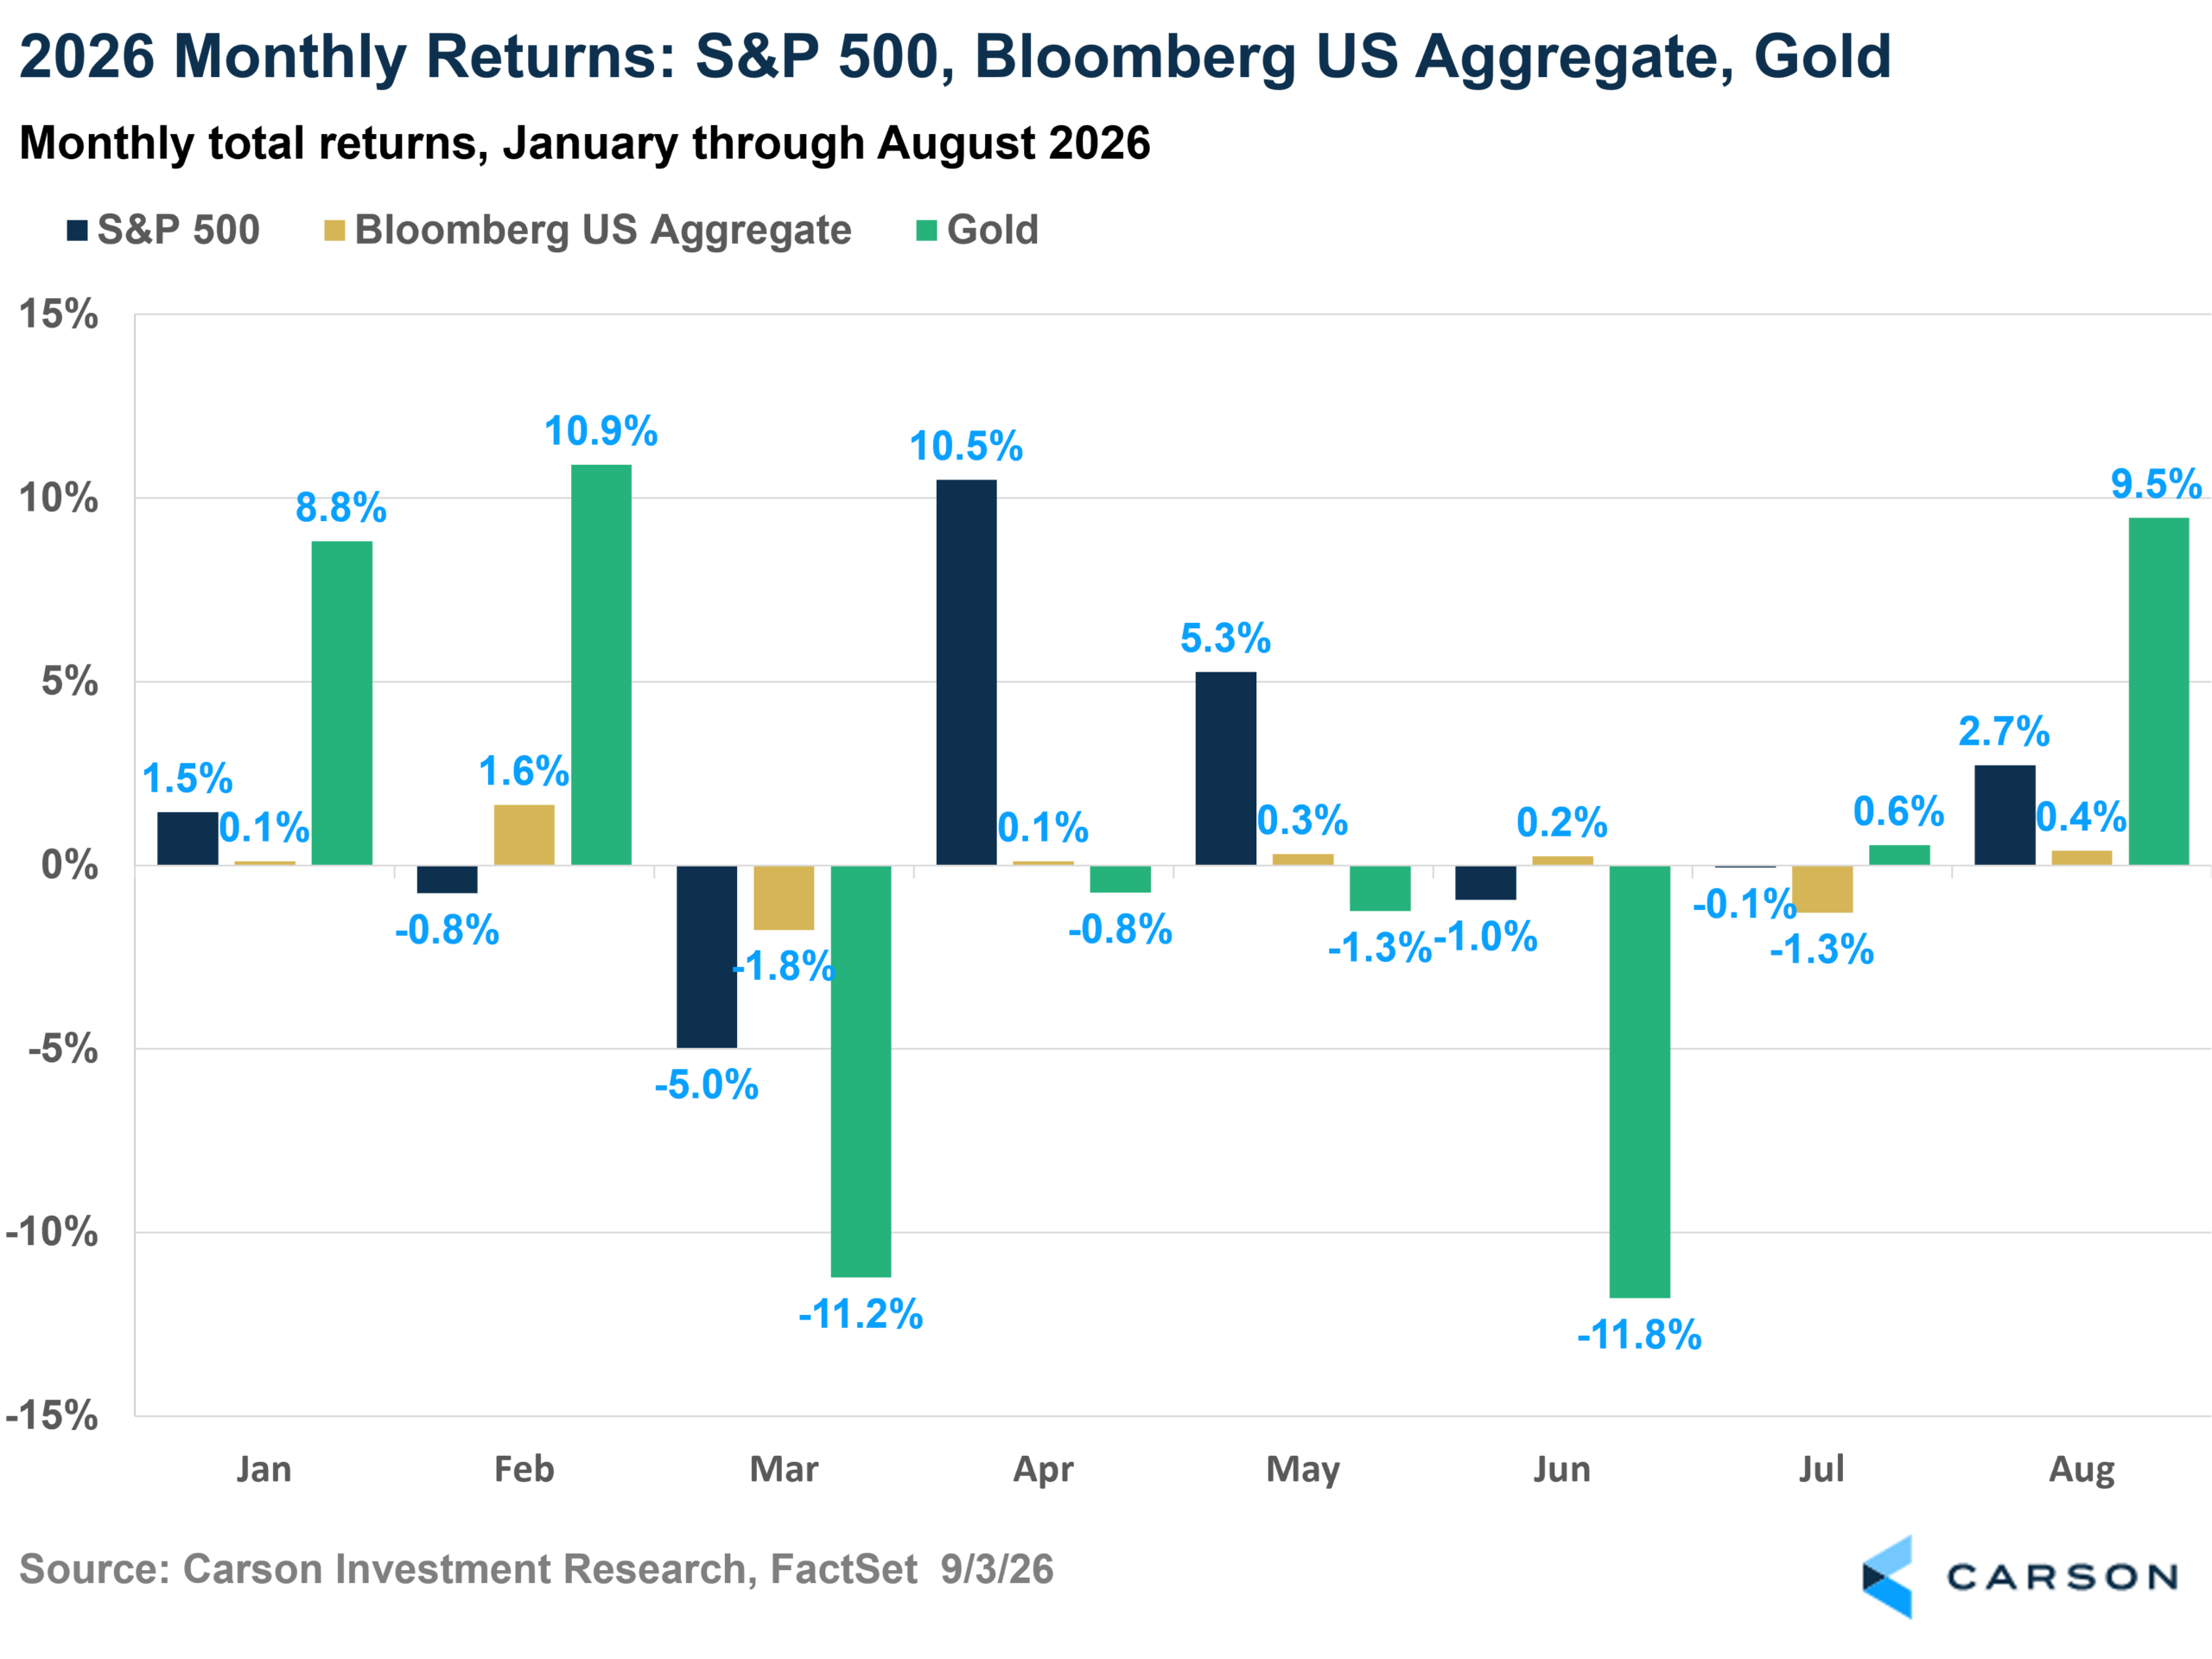
Gold had a huge month, but has nothing to show for the year. It gained 9.46% in August, the 96th percentile of 427 monthly observations since 1991, and it is up only 1.96% year to date. The monthly path is interesting to look at: +8.8%, +10.9%, −11.2%, −0.8%, −1.3%, −11.8%, +0.6%, +9.5%. Three double-digit monthly moves in eight months, netting to almost nothing.
The broad Bloomberg Commodity Index rose 7.4% in August and is up 32.1% year to date, second only to the energy sector among everything we track. Energy commodities, not metals, have carried it, mirroring the energy sector’s leadership.
What We’re Watching
Our general view has not changed. The combination of inflationary growth and extraordinary AI capital spending has not run its course, and that still argues for an equity overweight paired with real diversification. The reason is visible in the two charts at the top of this piece. The market’s leadership has not been a single trade with a single driver. It has been two: AI and energy risk, alternating, plus a rotation within the AI trade itself as capital moves from the companies building the infrastructure to the companies meant to use it.
August was the first month those threads pulled in the same direction. When several loosely related risk assets rally together, and in August that meant megacaps, high beta, software, energy, gold, commodities, and bitcoin all up at once, it is usually liquidity doing the talking. What it does do is make the next couple of months more informative than usual. If the energy and technology correlation stays negative, this year’s diversification benefit came from somewhere unglamorous and repeatable. If it flips positive while both keep leading, the market has gotten more concentrated than the sector leaderboard makes it look.
For more content by Barry Gilbert, VP, Asset Allocation Strategist, click here.
9110698.1. – 3SEPT26A