Welcome to Carson Investment Research’s Earnings Check-In for the week ending August 28, 2026. This series is built weekly from FactSet’s Earnings Insight report (John Butters, VP, Senior Earnings Analyst with FactSet), with index weights and market caps sourced from YCharts, and aggregation performed in-house. We tie every figure to FactSet’s published numbers, then add Carson’s perspective on top. We publish our Earnings Check-In weekly during earnings season.
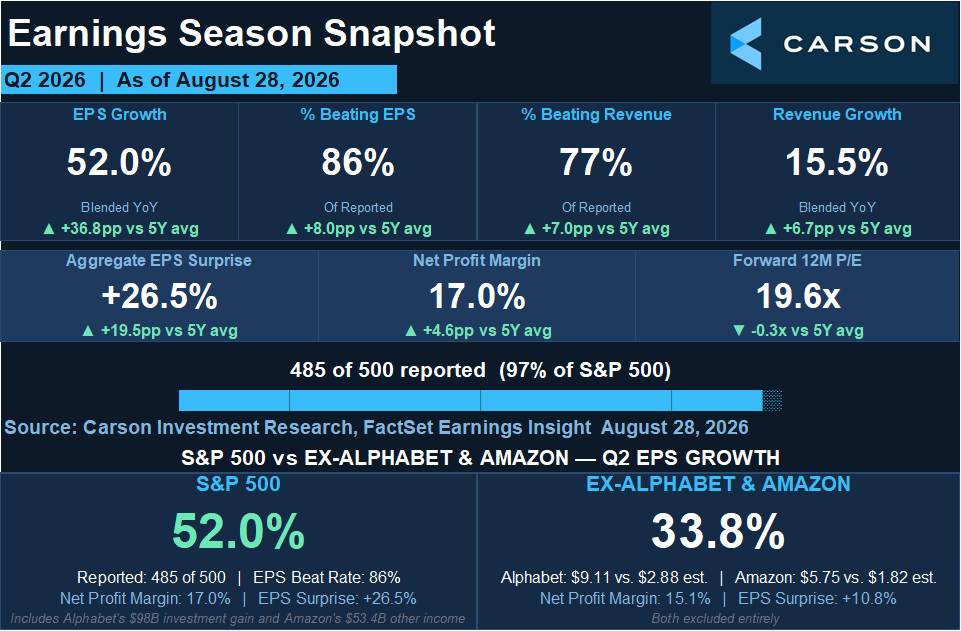
We’re at 97% reported. Blended Q2 earnings growth is 52.0%, the fastest the index has posted since Q2 2021, and if the 26.5% aggregate surprise holds, it will be the largest FactSet has recorded since they began tracking the metric in 2008.
I’ve spent three straight posts explaining why that headline is not what it looks like. First Alphabet’s $98 billion, then Amazon’s $53.4 billion, then what any of it does to margins. However, I want to go in a slightly different direction today. Nvidia reported on August 26, which means we can finally see the entire Magnificent 7 for this quarter. The question I kept coming back to all week was simple: who actually earned the money this quarter? Let’s take a look at the season so far.
Nvidia Closed the Book
Butters ran the Mag 7 as his Topic of the Week. The headline is one you may have already seen: the seven companies grew earnings 118.5%, the highest rate the group has posted since at least Q4 2020.
He published a second chart underneath it that I think deserves a bit more attention. It adds a middle bar for the Mag 7 without Alphabet and Amazon, and it shows both today’s figure and where each estimate stood on June 30. That’s important since changes in the mark-to-market value of equity in private AI companies were a massive part of Alphabet and Amazon earnings gains.
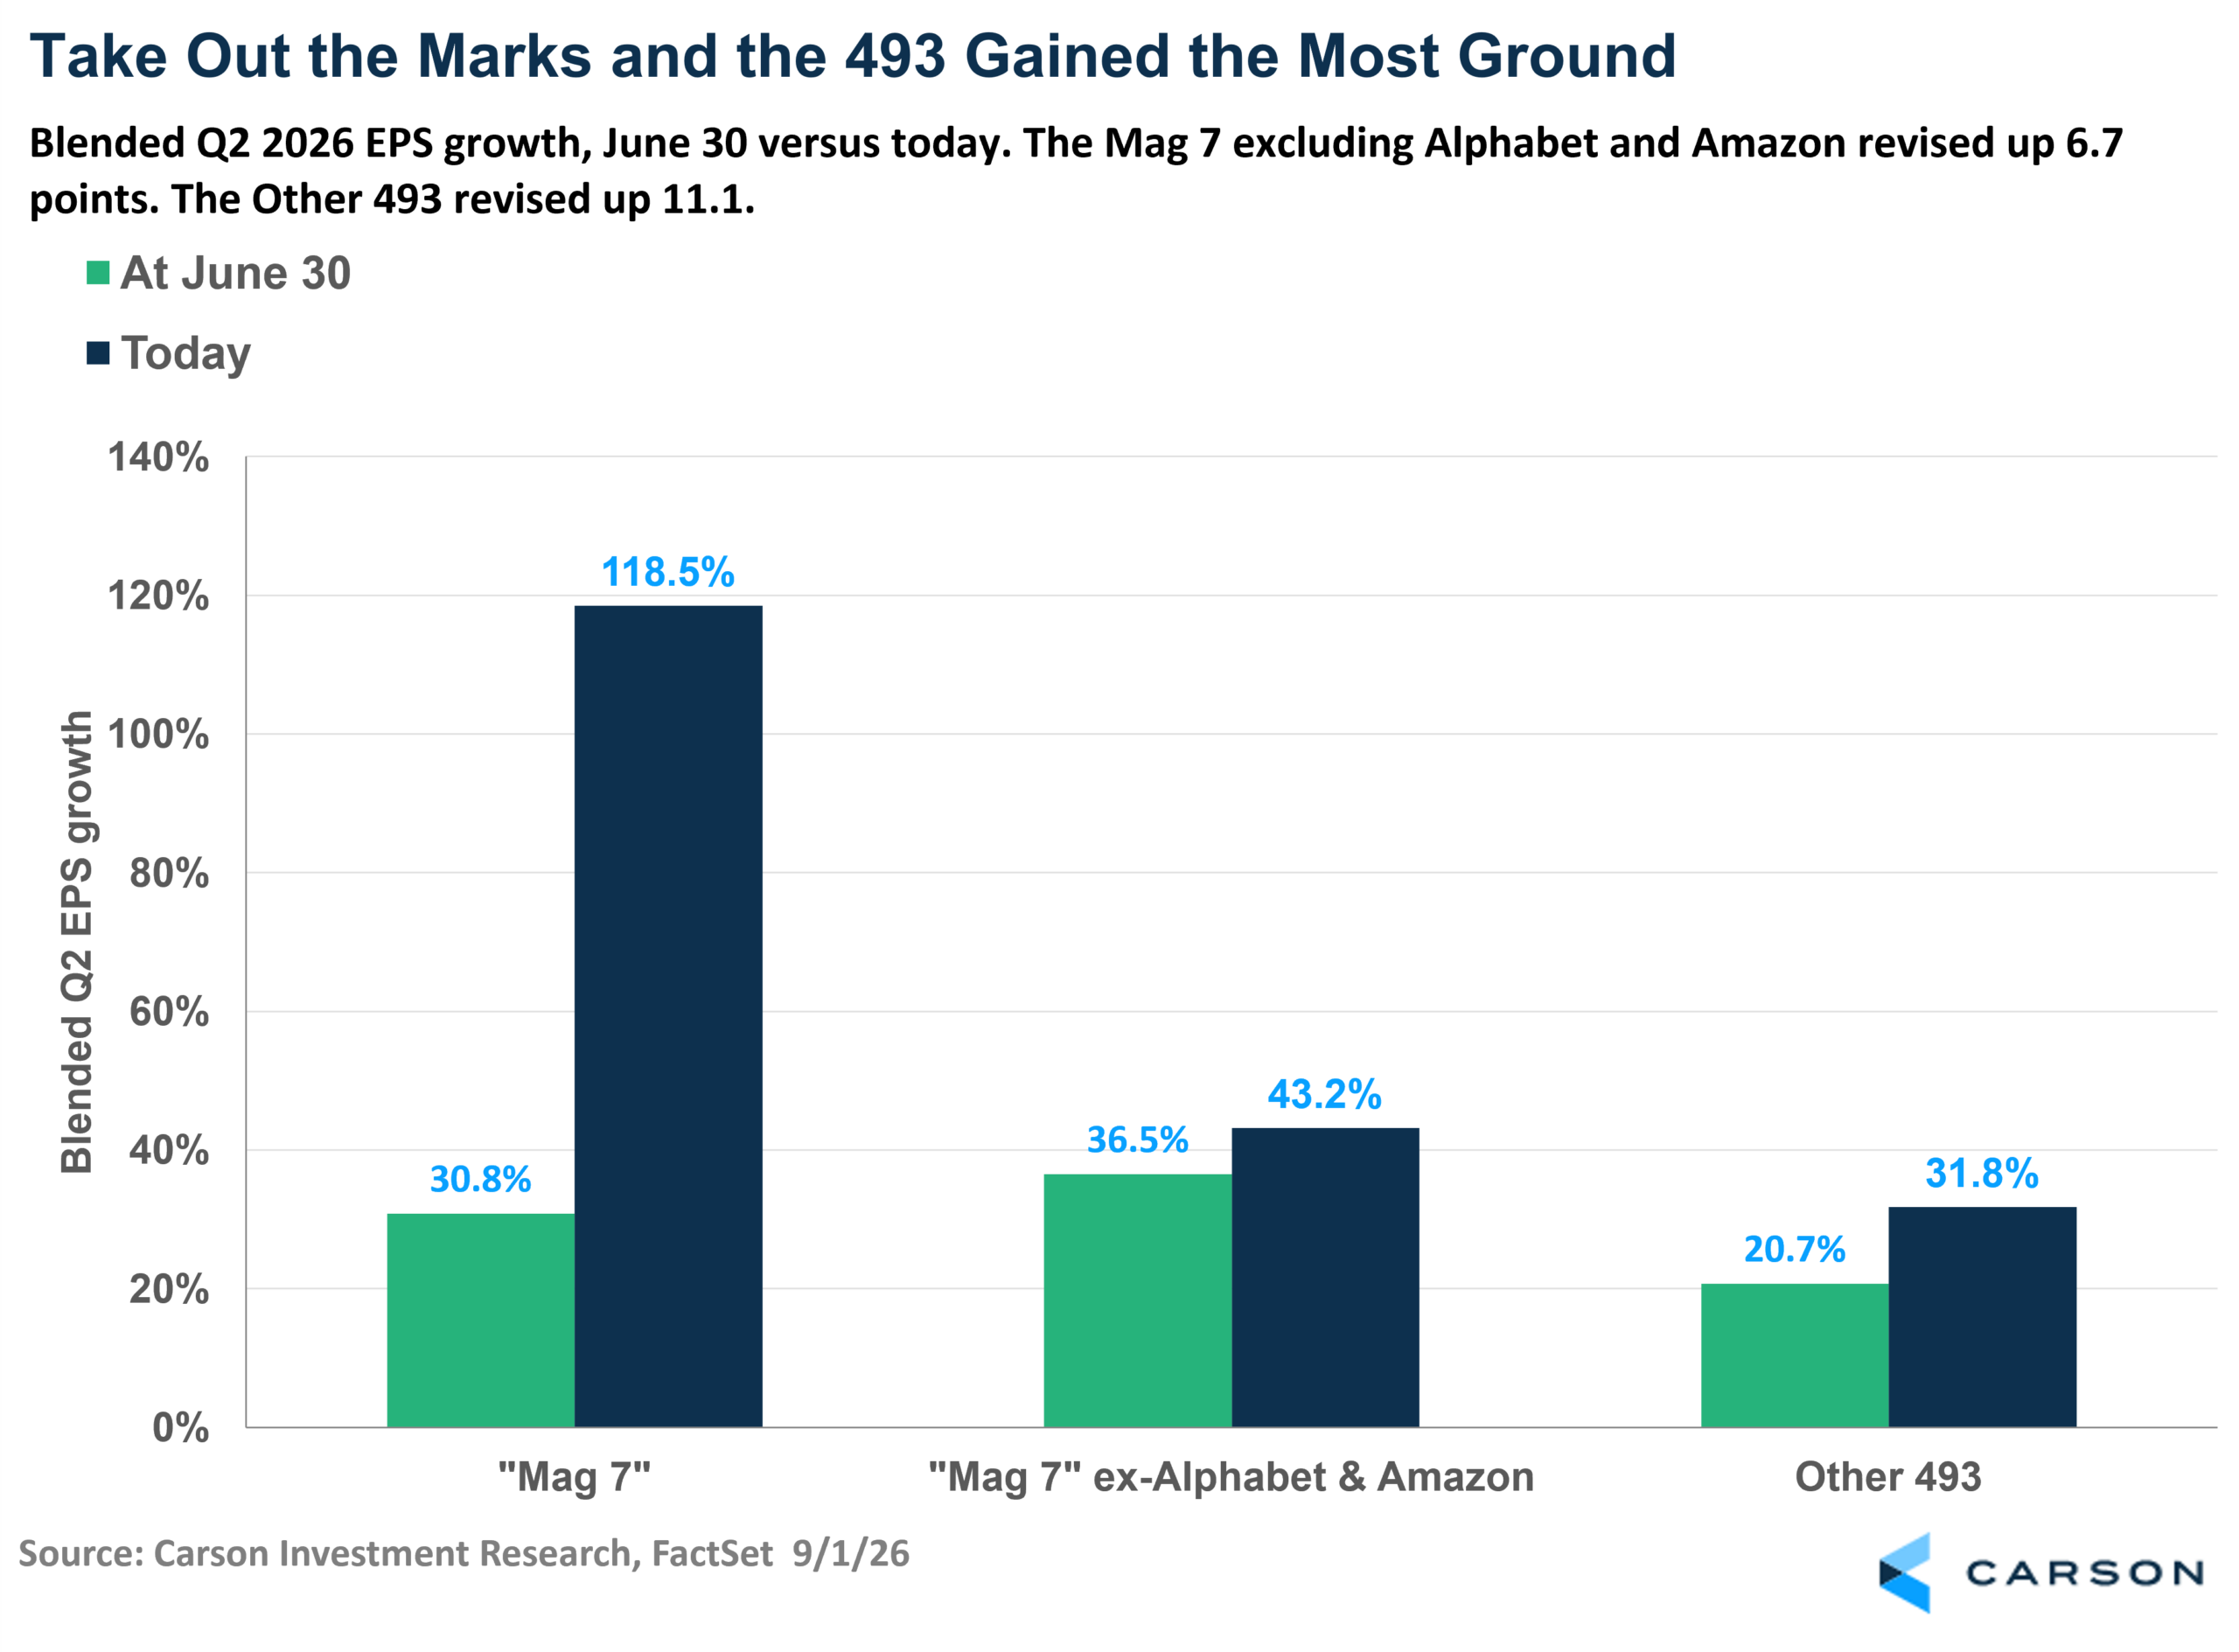
Run the arithmetic on the middle and right groupings. Since the quarter ended, the Mag 7 excluding those two names revised up 6.7 points. The Other 493 revised up 11.1 points. The 493 improved more than the mega caps did, and the gap between the two groups narrowed from 15.8 points to 11.4.
To add to this, on June 30, analysts expected the Mag 7 ex-Alphabet & Amazon to grow 36.5%, which was faster than the 30.8% they expected from all seven. Alphabet and Amazon were supposed to be a drag on their own cohort. Then the investment marks landed and flipped that entirely.
The Beat Nobody Made
Here’s the number that changed how I read the quarter. In aggregate, the Mag 7 beat estimates by 66.2%. Take out Alphabet and Amazon, and the other five beat by 4.4%.
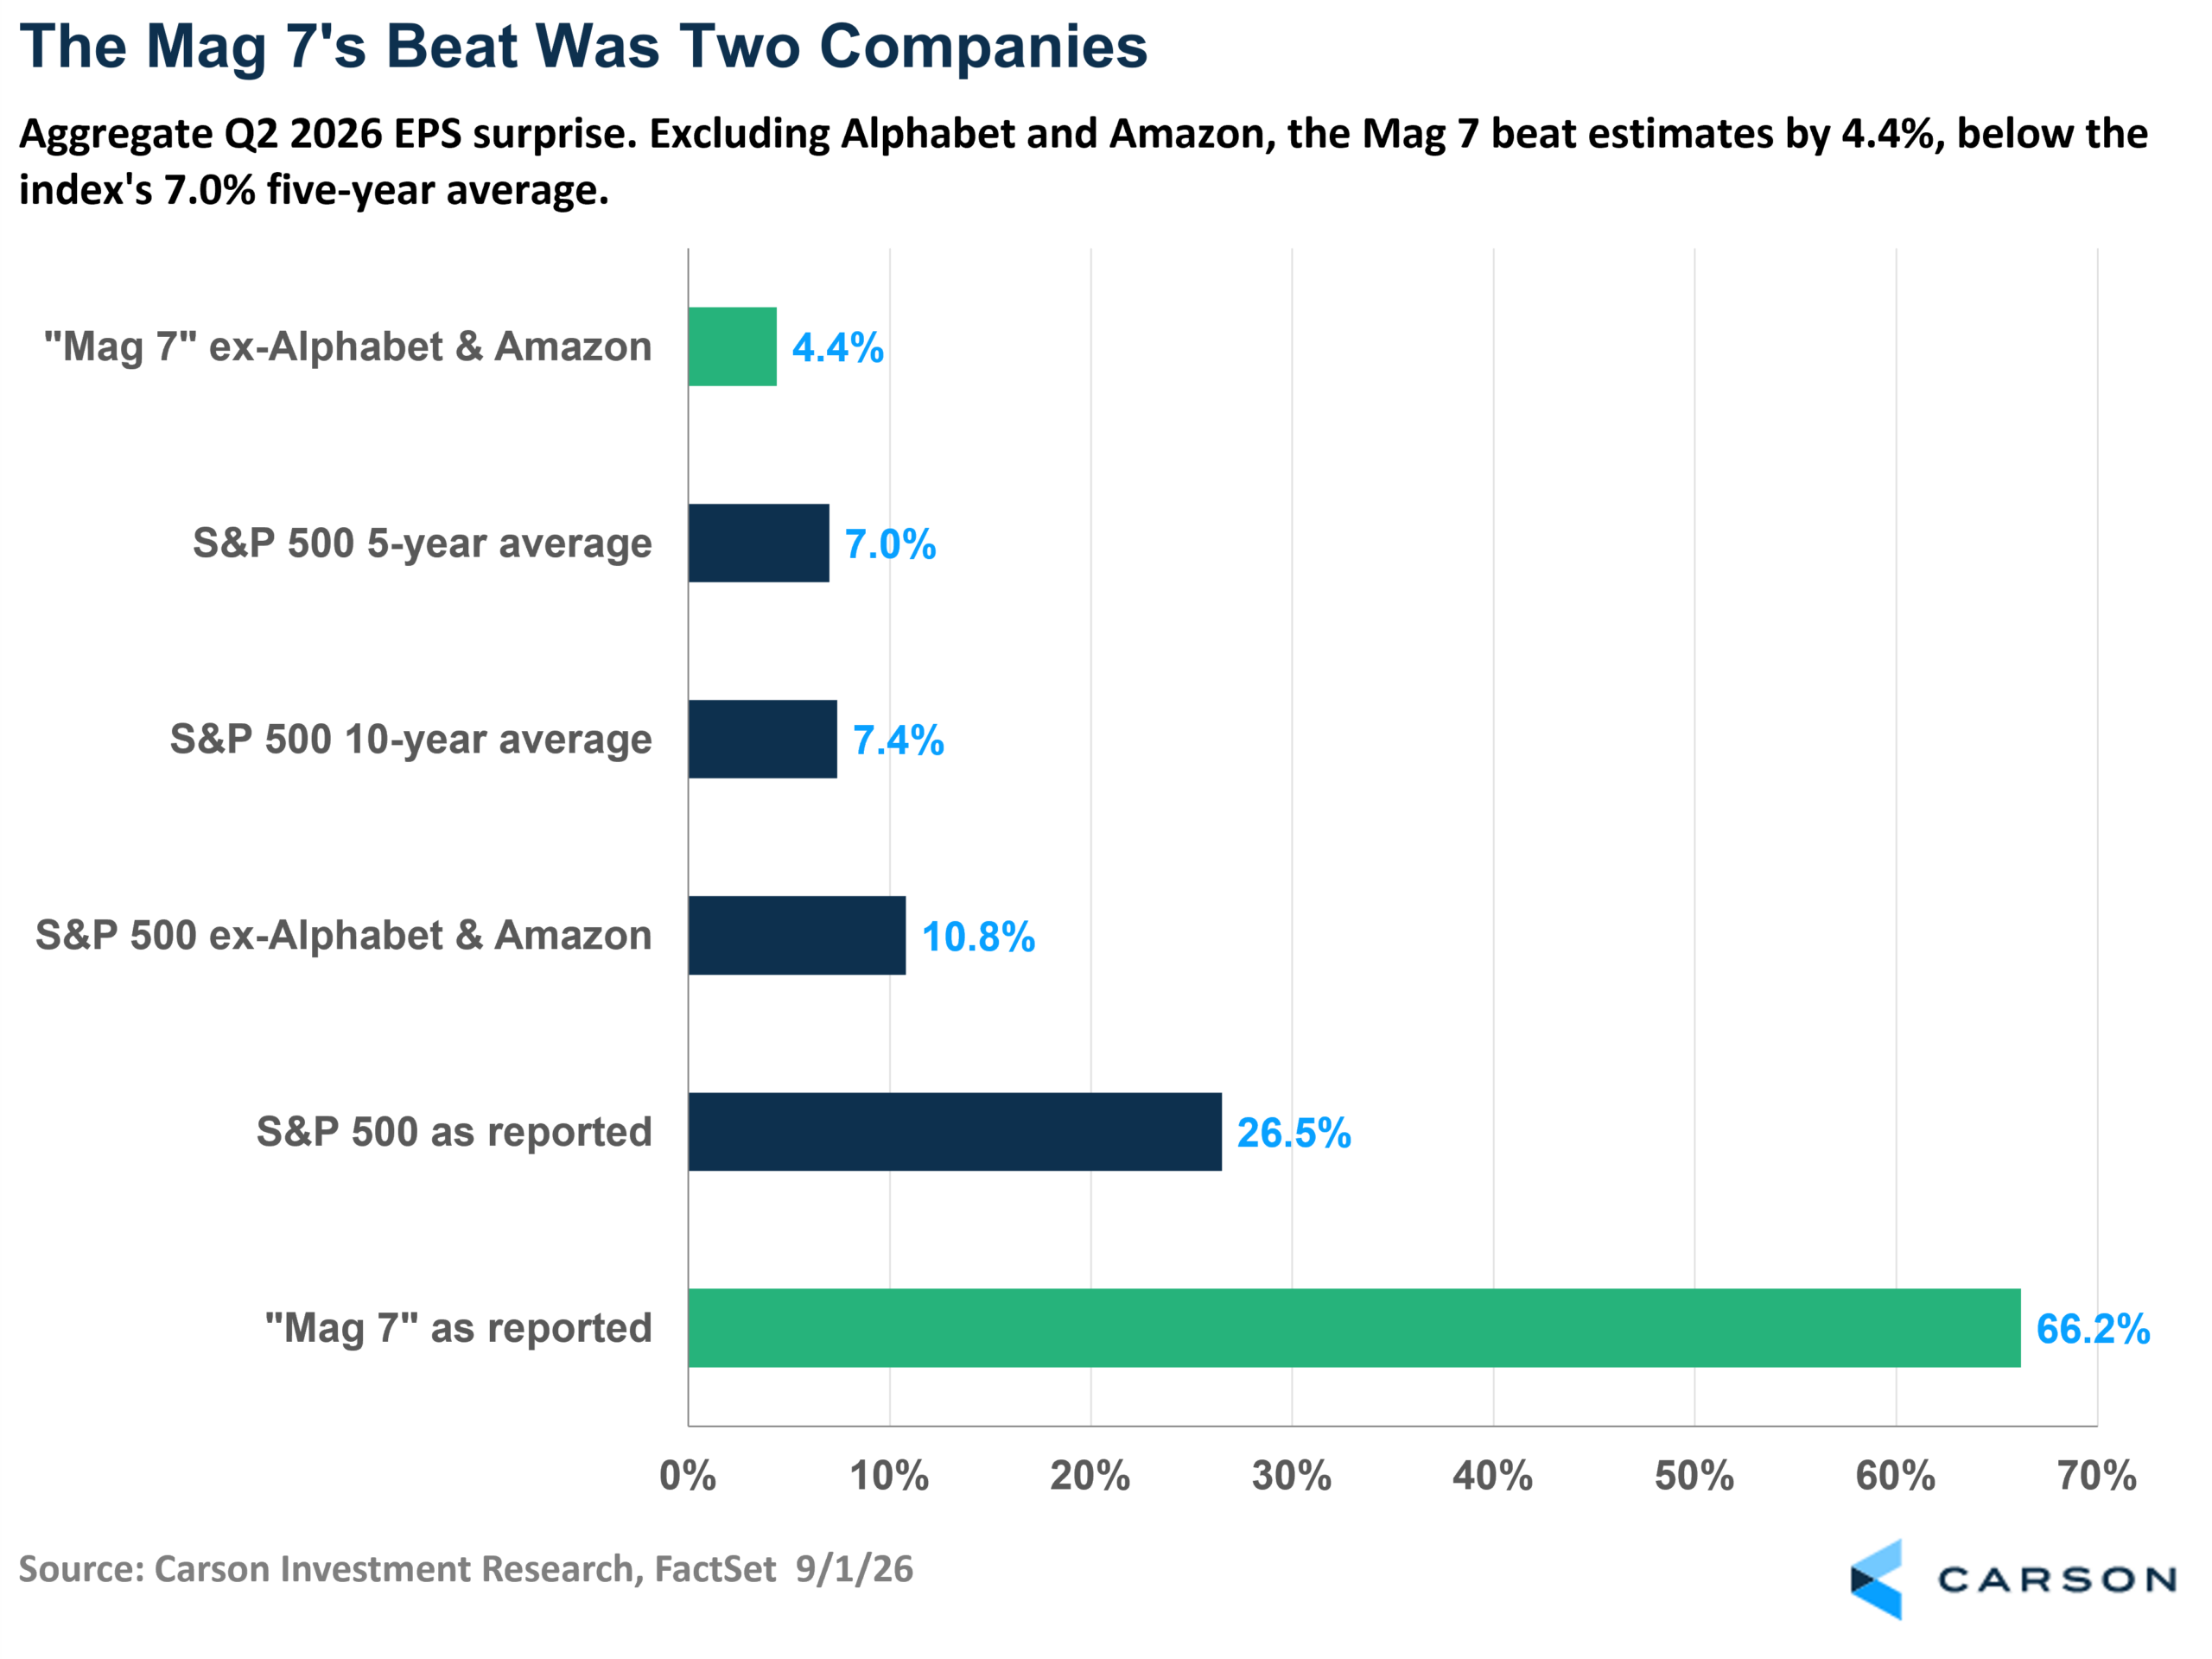
The index five-year average is 7.0%. So in a quarter that everyone has described as a blowout for big tech, five of the most-watched operating businesses in the market came in under the index’s own normal. Investors may have hardly noticed because two of their neighbors booked $151 billion of gains on stakes in private AI companies during the same three months.

Stay on Top of Market Trends
The Carson Investment Research newsletter offers up-to-date market news, analysis and insights. Subscribe today!
"*" indicates required fields
I don’t want to say that these gains don’t matter, because they certainly do. The question was never whether the money is real. It’s whether it shows up again next quarter, and a valuation mark doesn’t repeat unless the valuation moves again. There’s also a practical wrinkle I keep chewing on. Anthropic is still private, so Amazon only marks that stake when a new funding round prices it, and there’s no obvious buyer if Amazon ever wanted to turn the gain into cash. Alphabet’s SpaceX position is publicly traded now, but a holding that size doesn’t get sold quickly without moving the price against you. For the most part, these gains land on the balance sheet and stay there.
It Isn’t Just Five Companies
Meanwhile, look at what the rest of the index did.
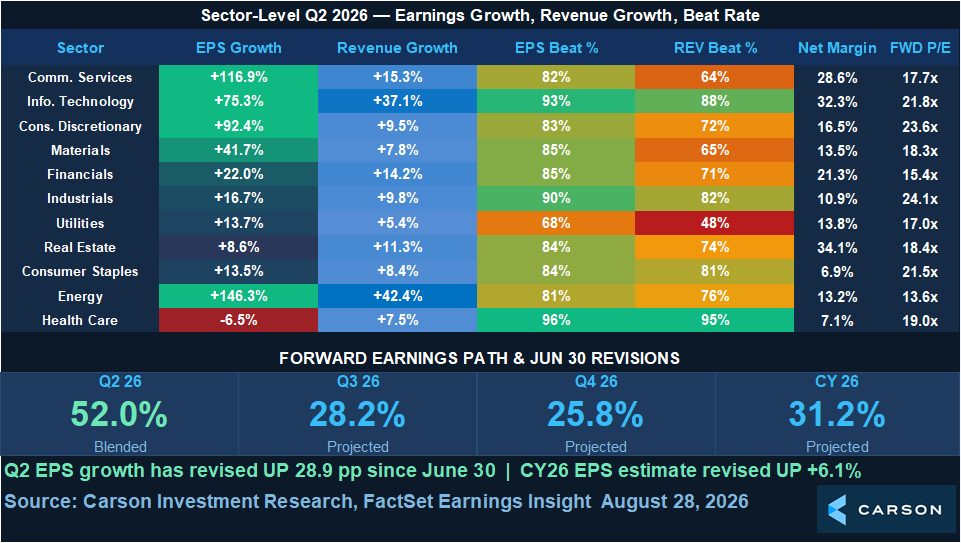
Ten of eleven sectors improved since June 30. Energy earnings grew 146.3% on an oil price that is much higher than it was a year ago. Semiconductors grew 142%. Financials went from 5.2% to 22.0%. Real Estate, Consumer Staples, and Industrials all improved. Every single sector grew revenue. Utilities was the only sector to move backward on earnings, and it also carried the lowest beat rate in the index at 68%.
The Other 493 posted 31.8% earnings growth, their best since Q4 2021. That’s a very good quarter standing on its own.
It isn’t confined to the index, either.
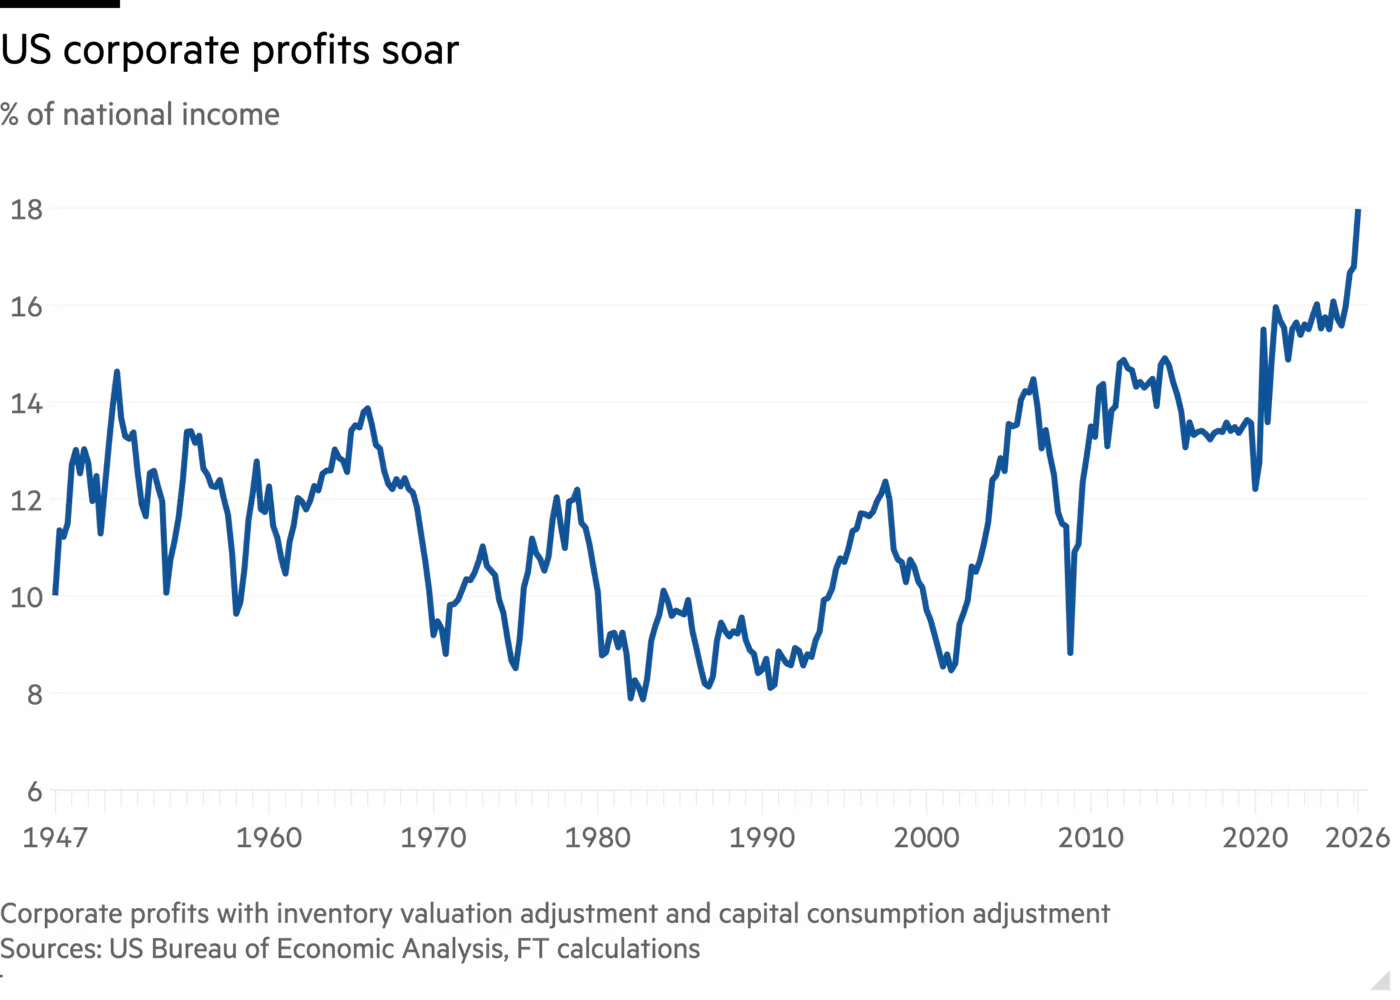
Corporate profits reached 18% of national income in the second quarter, the highest share since just after the Second World War, per Bureau of Economic Analysis data compiled by the Financial Times. That covers every corporation in the country. Whatever is driving profitability right now is broader than the handful of companies that happen to own pieces of AI startups.
The Handoff
Here’s another point Butters makes in the same piece: analysts expect the Other 493 to outgrow the Mag 7 in Q4, 26.8% against 23.2%.
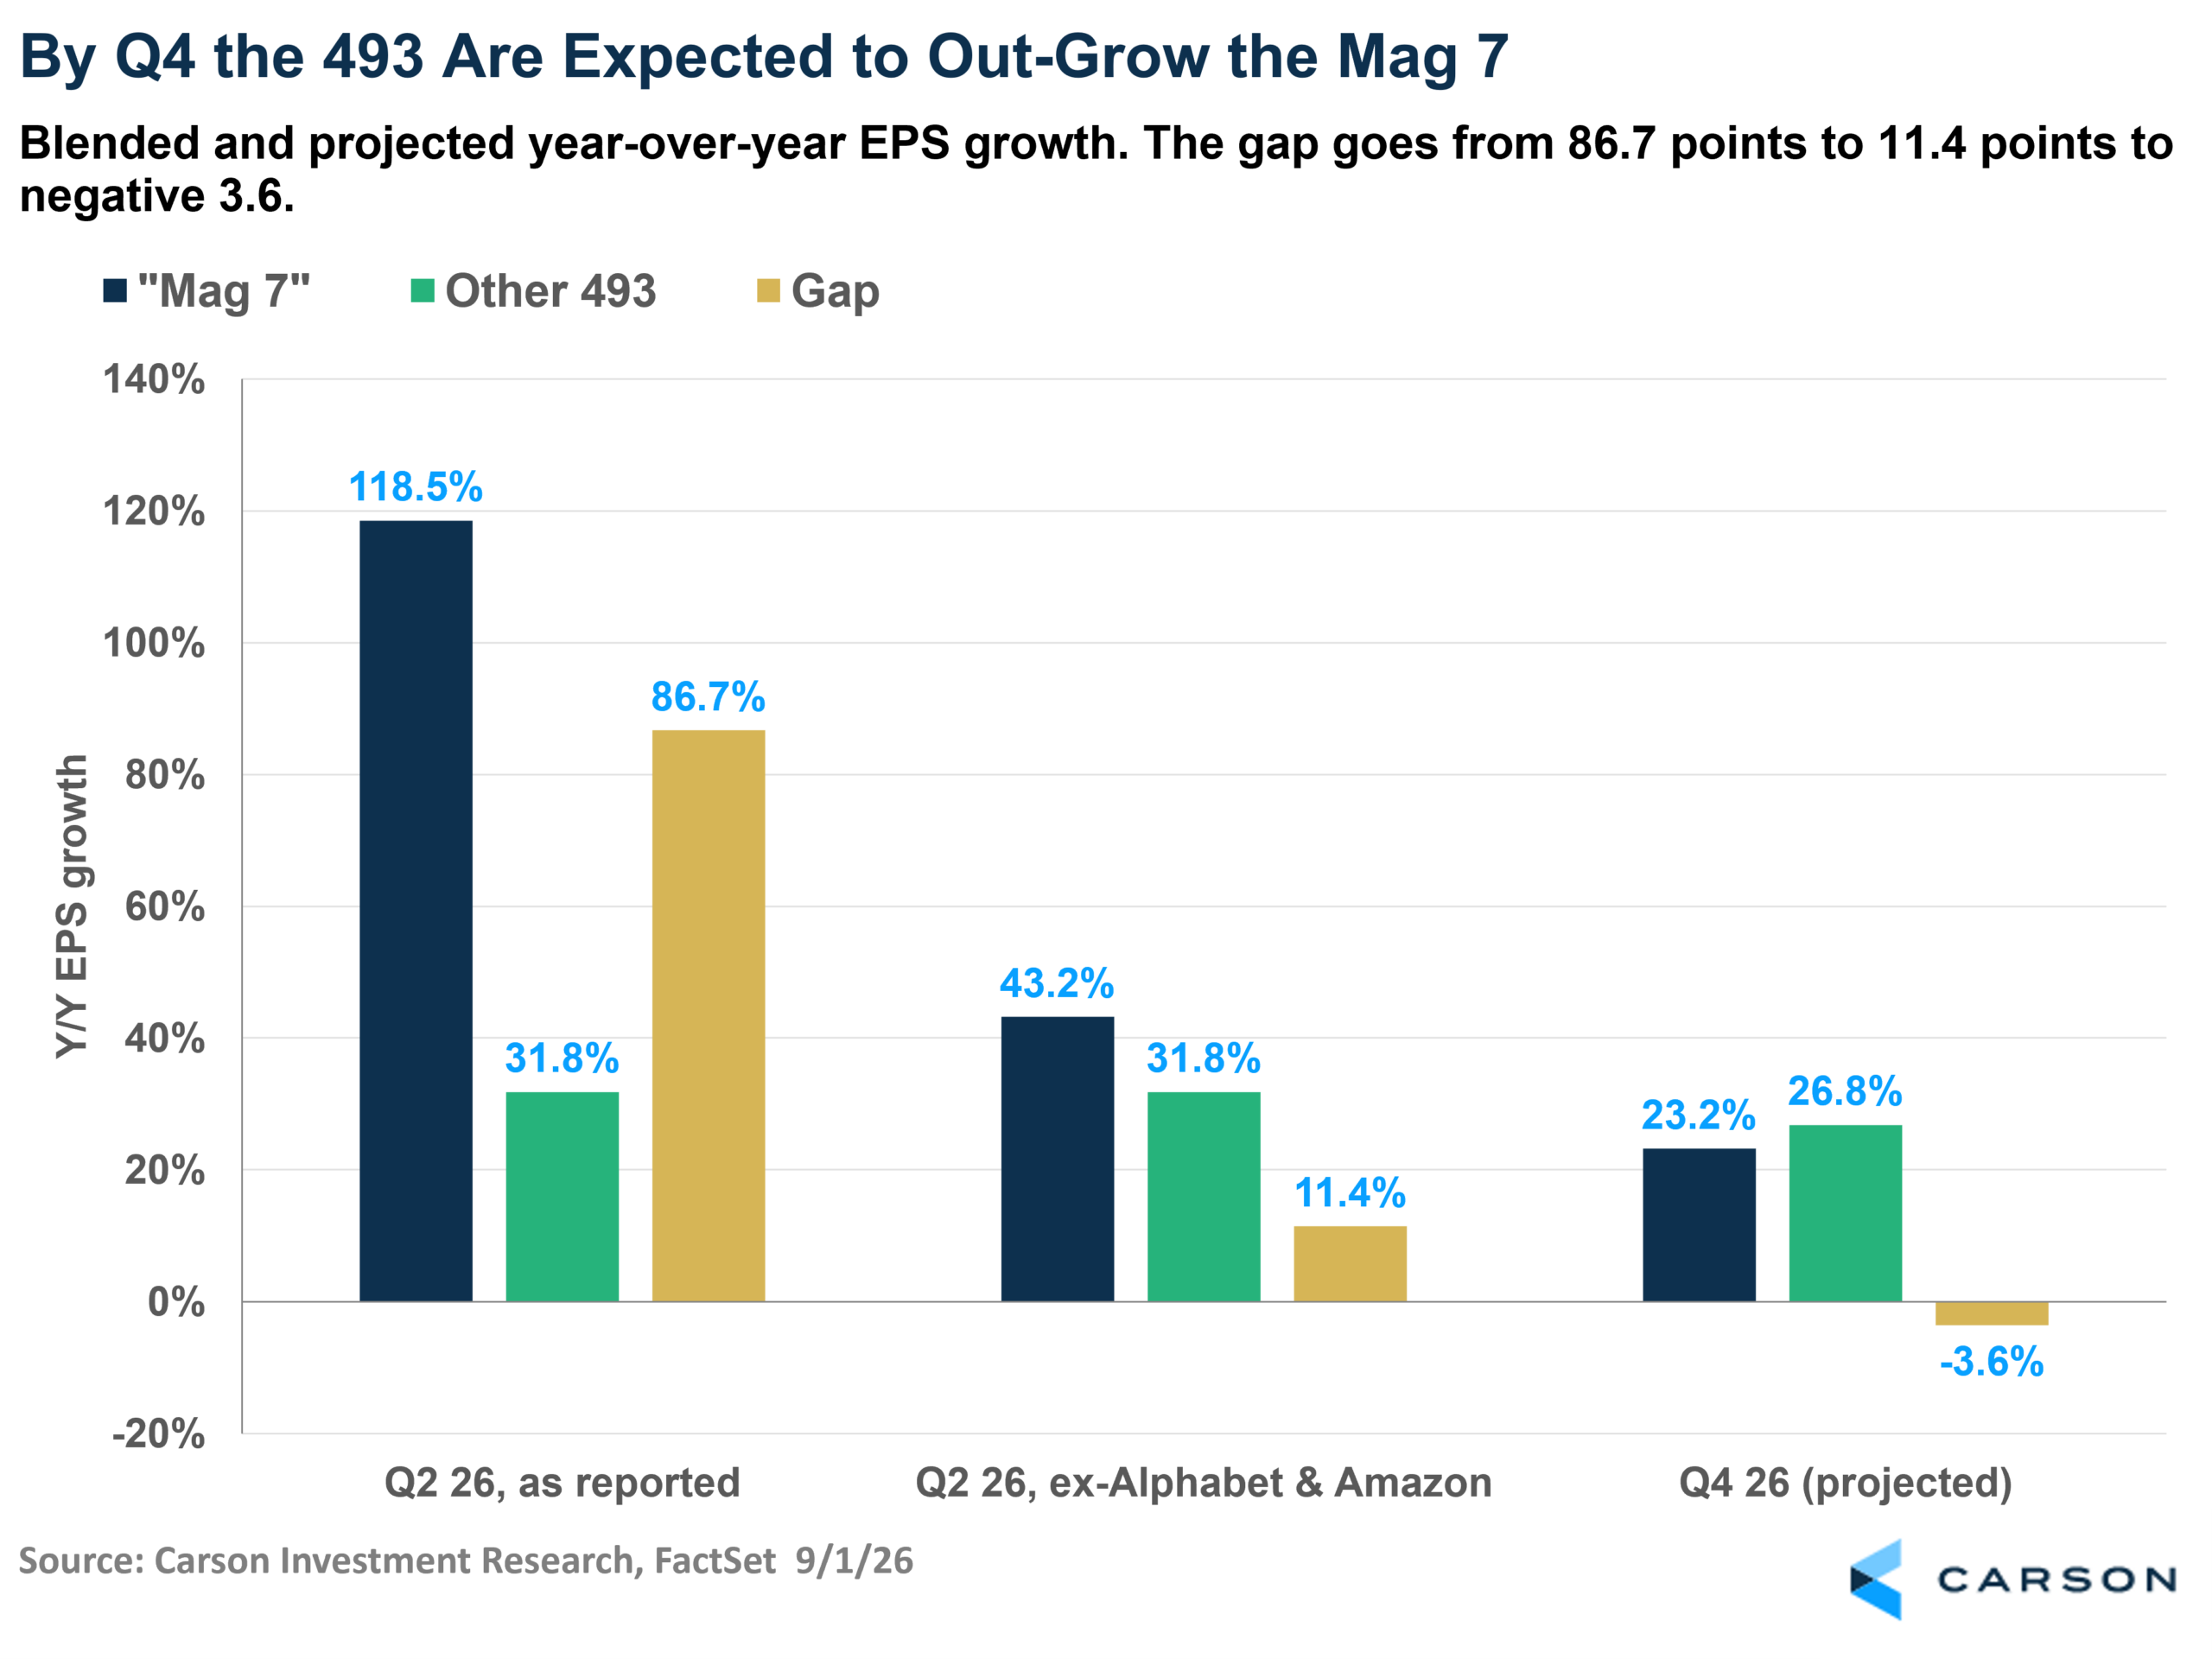
I like this chart because it collapses the whole argument into one picture. As reported, the Mag 7 beat the field by 86.7 points. Strip the marks and the lead is 11.4. By the fourth quarter it’s negative.
For three months I’ve treated concentration as something to work around. I think that’s changing. If investors believe the Mag 7 keeps carrying this index from here, you now have to explain why the estimates say the opposite, and that’s a harder case to make than it was in June. I’d rather be positioned for the broadening than sit around waiting for proof.
Which raises the obvious next question. What does it cost to be positioned that way? Not much, as it turns out.
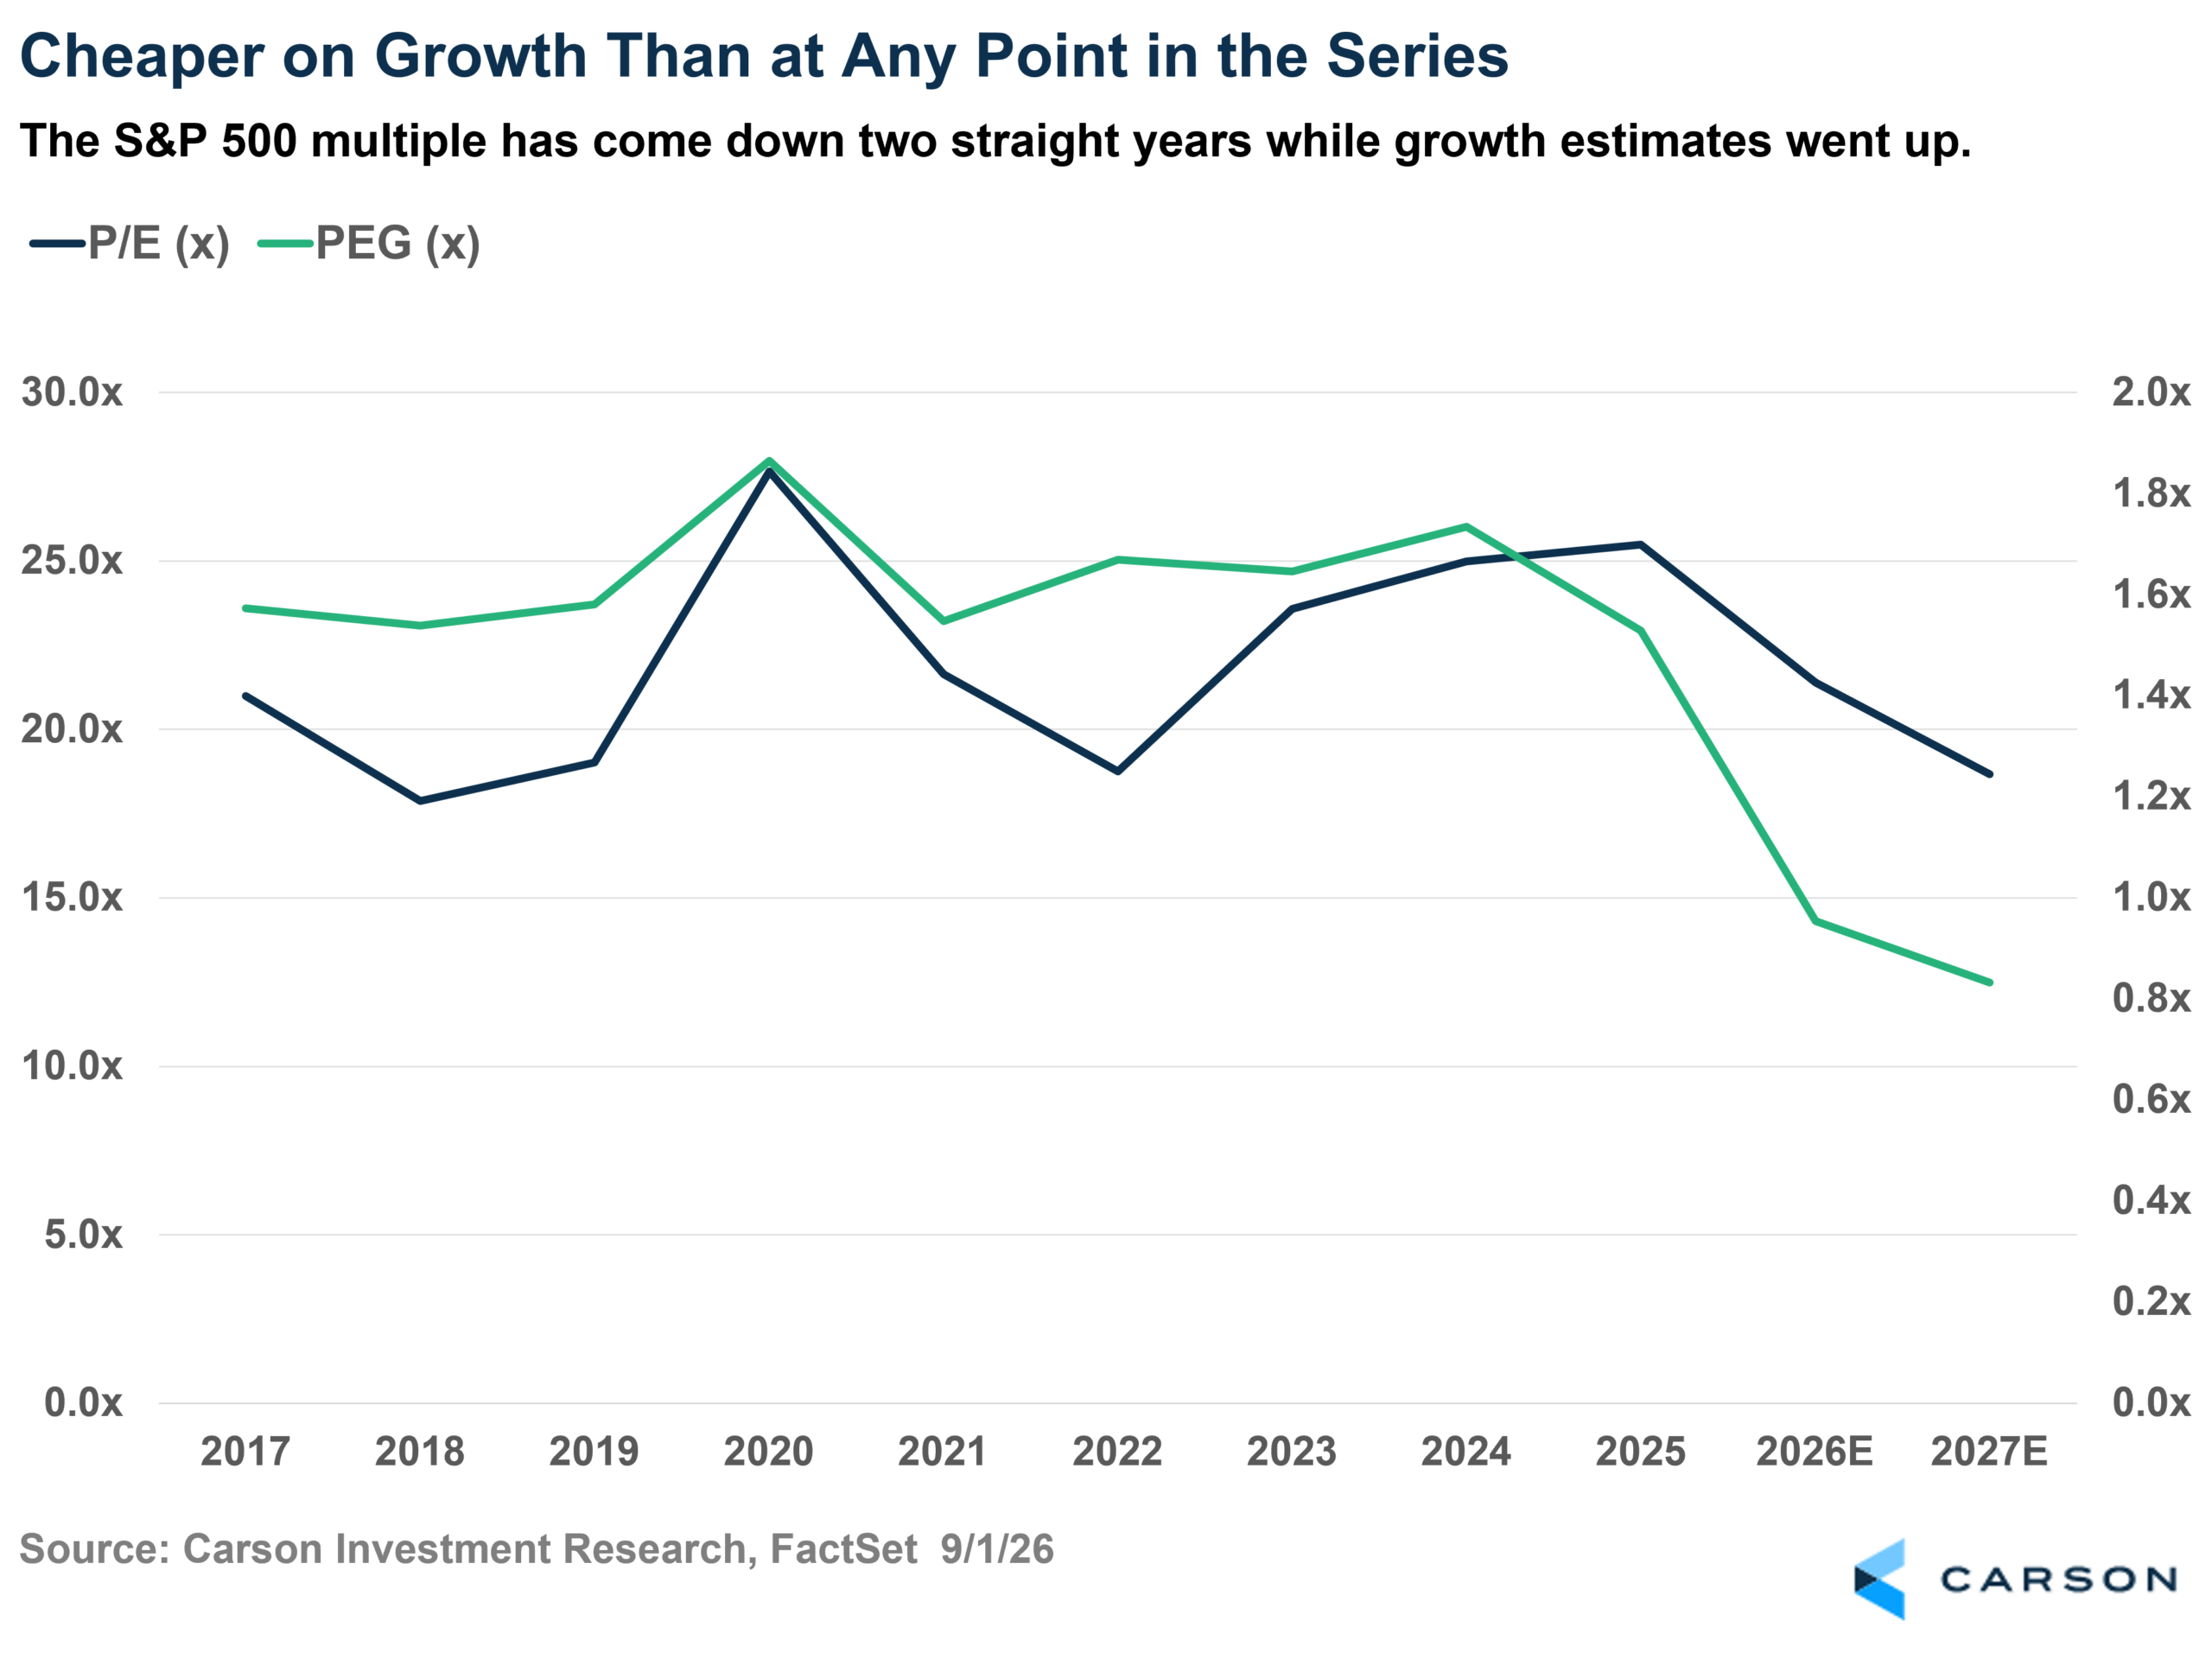
The S&P 500’s forward P/E is 19.6, below the five-year average of 19.9. Since June 30, the index has risen roughly 3.1% while the forward twelve-month EPS estimate has risen 7.4%, meaning the market got cheaper during the best earnings quarter in five years. Adjusted for growth, it’s the cheapest reading in this series.
Where I May Be Wrong
The 493’s number has its own passengers. Micron and Chevron are two of the top five contributors to index earnings growth this quarter, and neither is a Mag 7 name, which means a real slice of the breadth story is a massive move in oil and a memory upcycle.
Then there’s next year.
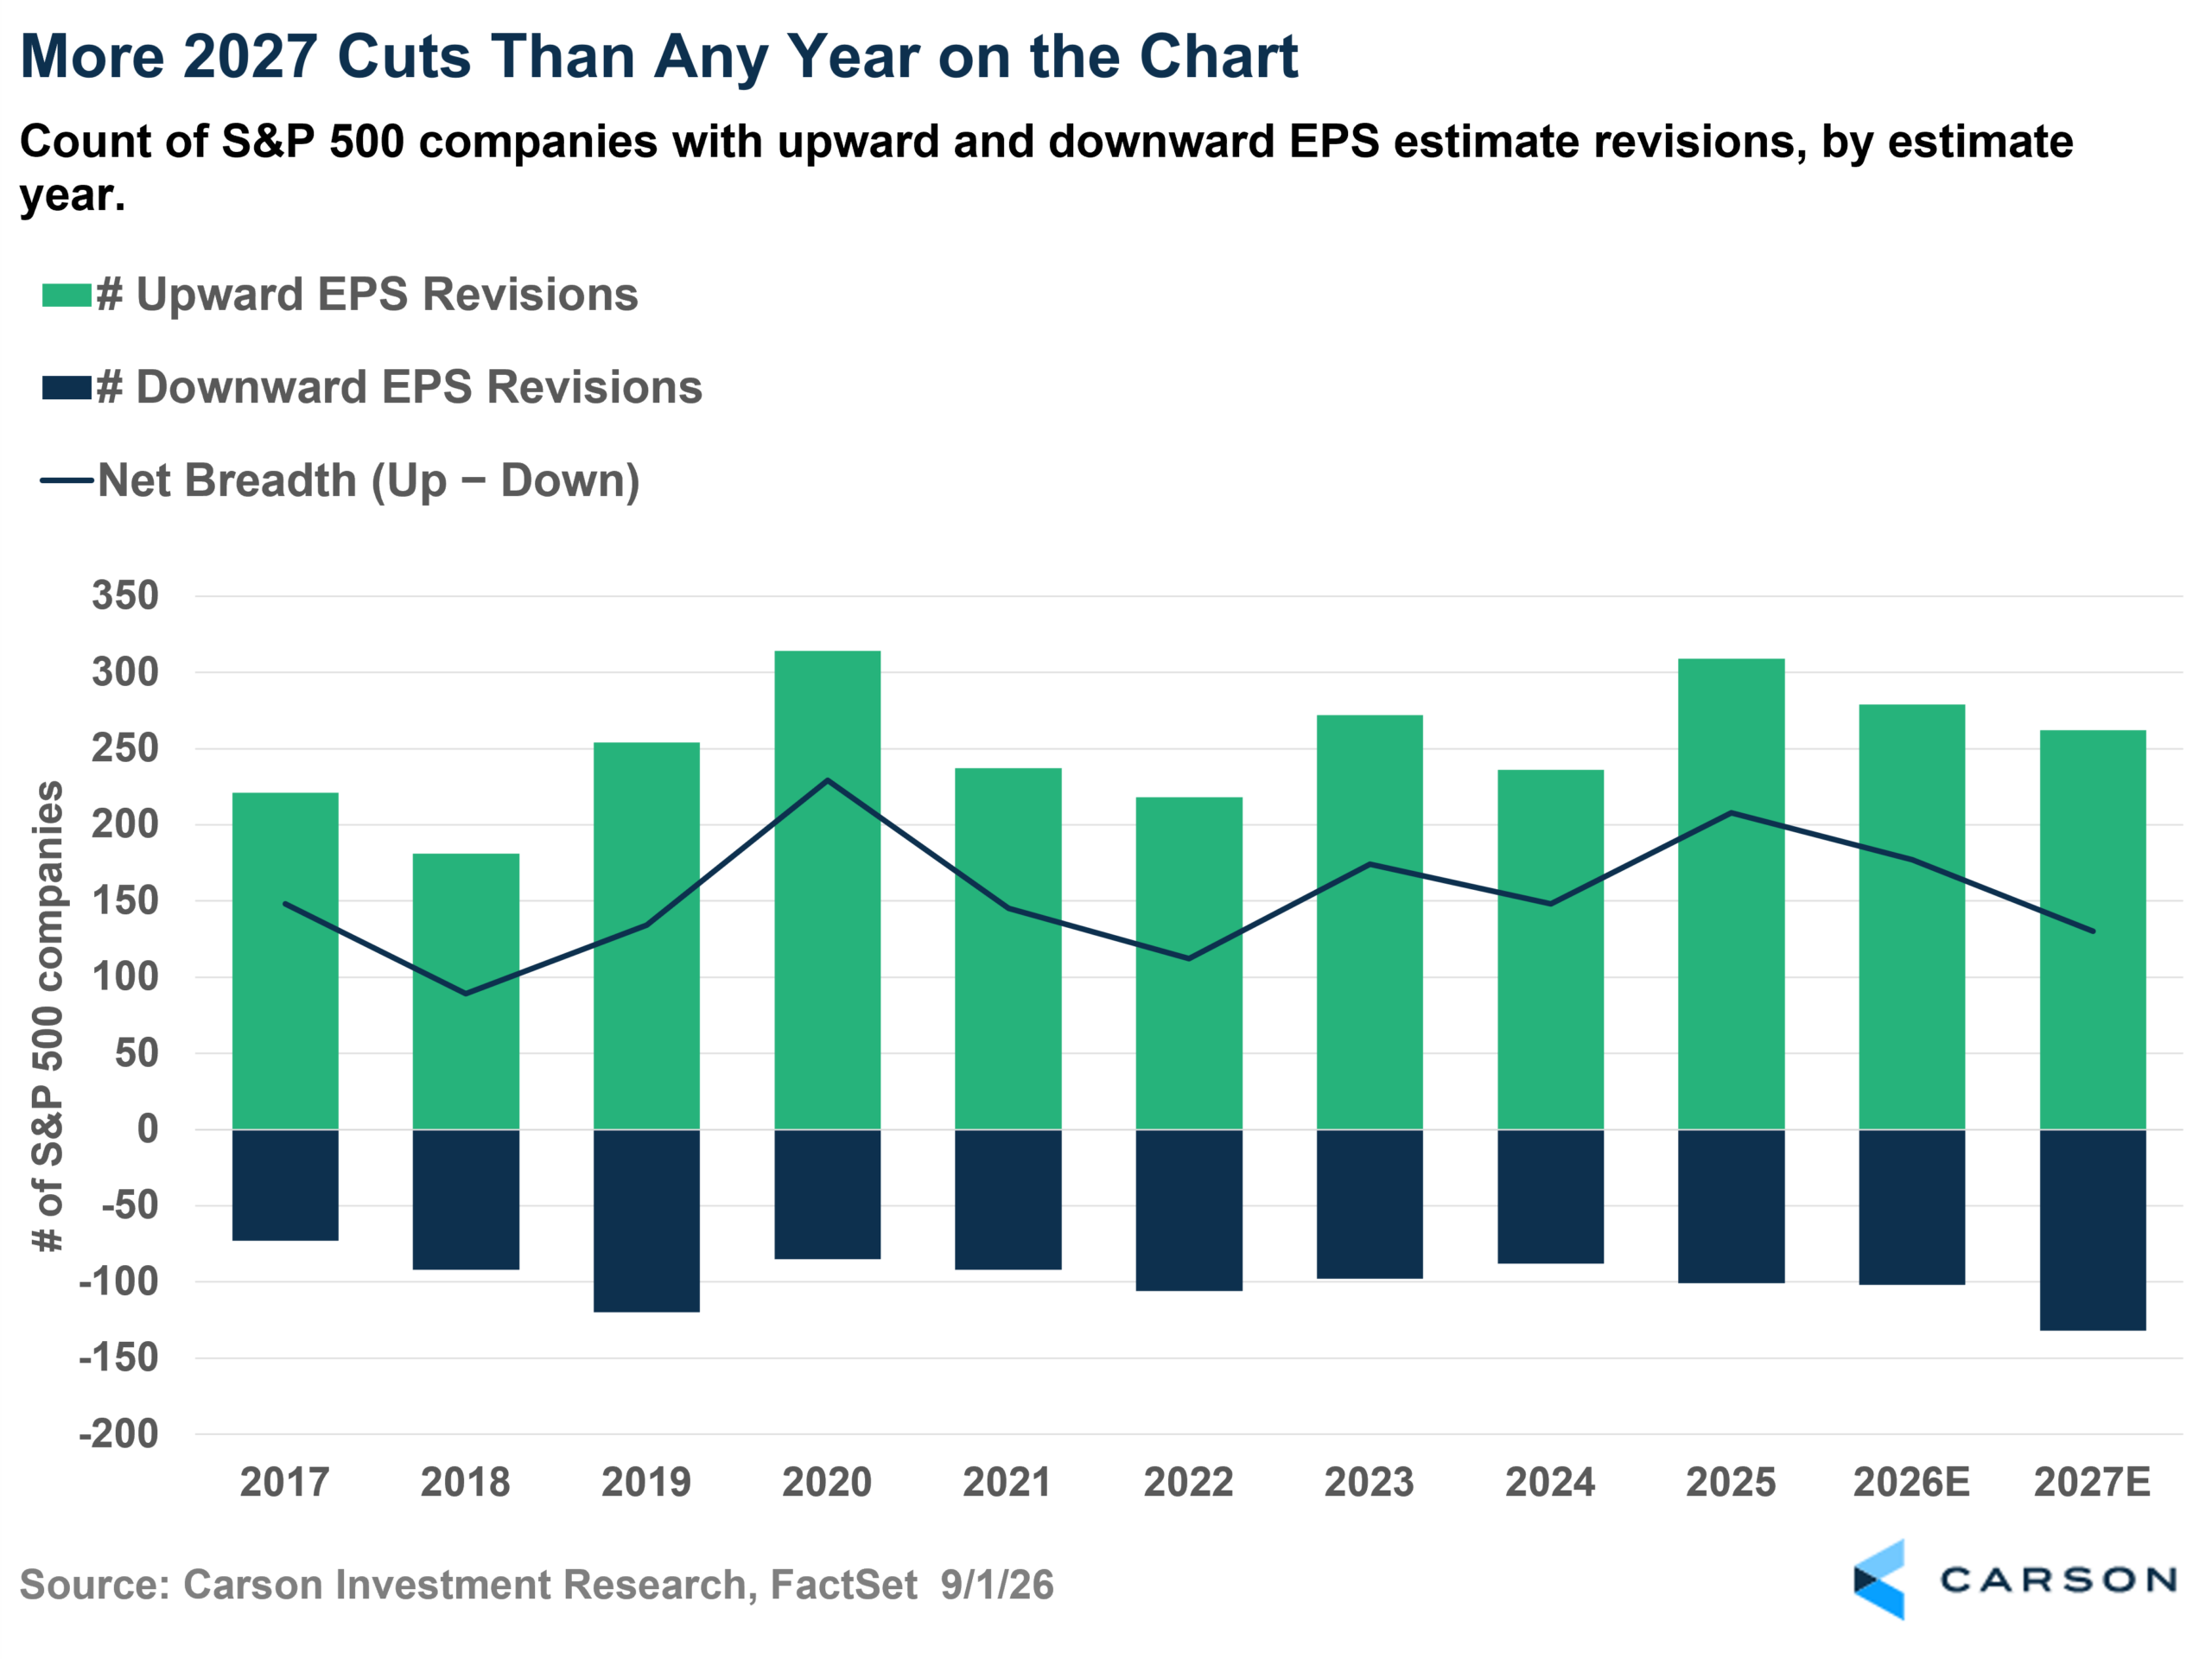
Analysts have cut 2027 estimates at more companies than in any year on this chart. CY 2027 growth is projected at 14.4% against 31.2% for this year. Everybody decelerates, and the group carrying the larger one-time gains in its base has the harder comparison. That headwind cuts my way, but it’s also a market-wide slowdown that nobody escapes.
Also, the market hasn’t been paying for any of this. Companies posting positive surprises gained 0.6% on average around their reports, against a five-year average of 1.0%. A record beat rate produced a below-average payoff.
Nine Left
Nine companies report next week, and then the season is finished. Nvidia’s guide for roughly 70% revenue growth in fiscal 2028, against a consensus near 45%, is a number that will shape the next two quarters of estimates, so I recommend my colleague Blake Anderson’s write-up on the earnings results!
This quarter will be remembered for the Mag 7 growing 118%. I think the more useful story is that everyone else grew 31.8%, their best showing since 2021, and the estimates say they keep going from here. If you’ve been thinking about this market as seven stocks that matter and 493 that don’t, this is the quarter to update that.
Back next Tuesday.
By Harry McDonald, Analyst, Investment Research
9105692.1. – 1SEPT26A