
In the world of portfolio construction, the classic 60/40 split, 60% equities and 40% bonds, has long been hailed as a balanced approach to weathering market storms. It’s like the reliable minivan of investing: not flashy, but designed to get you through various terrains with a mix of growth potential and stability. But what if its success has been more tied to a specific economic backdrop than we often acknowledge? Drawing on nearly a century of historical data, let’s explore how the 60/40 has performed in nominal and real terms, and whether its golden era aligns suspiciously with the long decline in interest rates that began in the early 1980s.
Nominal vs. Real Returns
First, a quick primer: Nominal returns are the raw percentage gains (or losses) on your portfolio before accounting for inflation. They’re what you see on your statements, but they don’t tell the full story. Real returns adjust for inflation, revealing the true purchasing power preserved or eroded over time. Think of nominal as your yearly salary raise—it’s the number on your paycheck. Real is how that raise compares to inflation. If you get a 5% raise, but inflation is 3%, it’s that final 2% that determines if you are actually getting ahead. Our research examines historical data from 1928 onward, tracking annual total returns for stocks (proxied by the S&P 500 index), bonds (proxied by the 10-Year Government Treasury), inflation rates, and the resulting 60/40 blend. The numbers show a portfolio that’s delivered solid nominal results over the long haul, with an average annual nominal return of about 9% across the full period. But peel back the inflation layer, and the real return averages closer to 5.8%, highlighting how inflation can quietly chip away at gains.
Decades of Data
To put this in perspective, let’s break it down by decade. The table below summarizes the average nominal and real 60/40 returns, alongside inflation, pulled from the historical dataset:
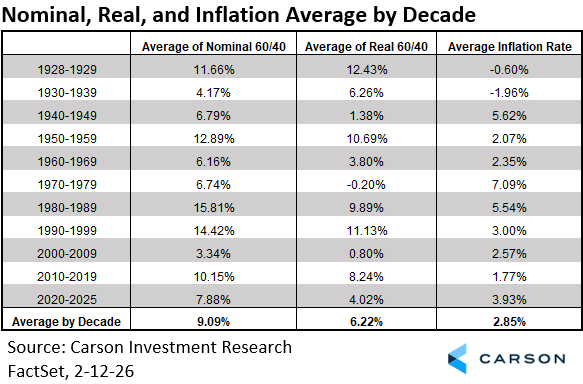
What stands out to me is that the 60/40 shined brightest during periods of moderate inflation and, notably, declining interest rates. From the early 1980s through the 2010s, as rates trended downward from double-digit peaks, bonds provided a tailwind through capital appreciation as well as income clipped at those higher rates. Falling yields led to rising bond prices, complementing equity gains. Nominal returns averaged 10% over several decades, with real returns remaining well above 6%. But flip to eras of rising rates or high inflation, like the 1968-1977 stagflation period or the rapid inflation spike of 2022, and the story changes. In 2022, with the Fed aggressively raising rates to combat post-pandemic inflation, both stocks (-18%) and bonds (-17.8%) posted steep losses, dragging the nominal 60/40 down 18% and real returns even further to -24%. This wasn’t an anomaly; the 1970s saw real 60/40 returns go negative on average, as inflation averaged over 7% and eroded purchasing power despite positive nominal figures.
Stay on Top of Market Trends
The Carson Investment Research newsletter offers up-to-date market news, analysis and insights. Subscribe today!
"*" indicates required fields
The Interest Rate Connection
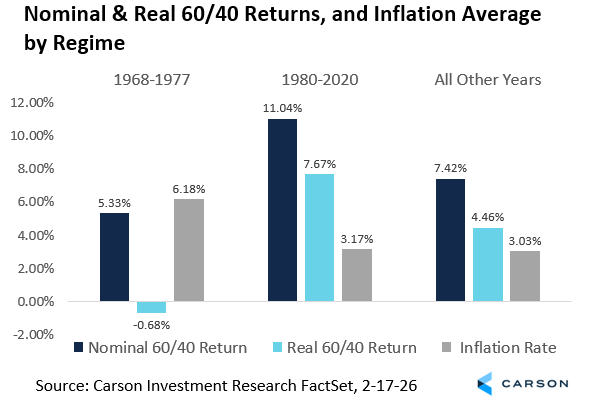
Yet the data reveals that the 60/40’s reputation as that reliable minivan of investing, steady through many different market conditions, may actually depend far more on one specific road condition than we often realize: the long decline in interest rates that began in the early 1980s and continued until recent years. The data in the pre-1980s supports this observation with rates often volatile or rising amid economic shifts through times defined by the Great Depression recovery, WWII, oil shocks, etc. The portfolio’s real returns averaged around 5-6% in stronger decades but dipped into negative territory during inflationary bouts. Post-1980, as rates steadily declined, bonds acted as a true diversifier, boosting total returns and smoothing returns for investors. Fast-forward to 2022 as rates reversed course, and the correlation between stocks and bonds flipped positive, which amplified losses. This echoes historical patterns in which rate hikes pressure both asset classes: equities via higher discount rates on future earnings, and bonds via direct price declines.

Allocation Implications
Recognizing these regime-dependent dynamics—and their implications for purchasing-power preserving allocations—may be top of mind for investors. In rising-rate and inflationary periods, the correlation between stocks and bonds has historically turned positive, reducing the hedging benefit that bonds once provided. For precisely these reasons, in our allocation guidance we have broadened diversification beyond bonds by adding targeted hard asset exposure, including real estate, commodities, and infrastructure. These tangible assets often exhibit low or negative correlations to both equities and fixed income precisely when traditional stock-bond relationships break down, helping to protect real purchasing power and maintain balance within the same overall risk budget.
Conclusion
History shows the 60/40 isn’t infallible: its performance is intertwined with macroeconomic regimes, particularly interest rate trends and inflation. In declining-rate worlds, it’s a star performer. In rising-rate or inflationary environments, real returns of a traditional 60/40 can suffer, reminding us that no strategy is “set it and forget it.” Whether rates stabilize, climb, or fall from here remains a continued market debate, but understanding nominal vs. real lenses helps frame the conversation.
By Harry McDonald, Analyst, Investment Research
8817001.1. – 11MAR26A
