
One big question on everyone’s mind has been how tariffs would impact inflation. This is especially pertinent for the Federal Reserve (Fed), as it’s going to determine their next course of action—whether they continue to wait or cut rates sooner rather than later.
April and May were too early for any tariff impact to show up. Keep in mind that we got big whipsaws in tariff policy, including massive tariffs on Chinese goods pulled back in May. Still, the average effective tariff rate is about 10%-points higher than it was at the beginning of the year, and the proof is in the pudding that is federal government finances—we have in fact seen a big jump in import duties collected by the federal government. So, who’s paying this? As I’ve noted in the past, import prices haven’t fallen and that indicates that foreign exporters are not the ones paying these tariffs. It’s US businesses, via a hit to margins, or consumers, via higher prices. The question is when it would show up in the data. The short answer is that it’s started showing up in June inflation data, but at the same time, there have also been some disinflationary forces countering the inflationary impact of tariffs.
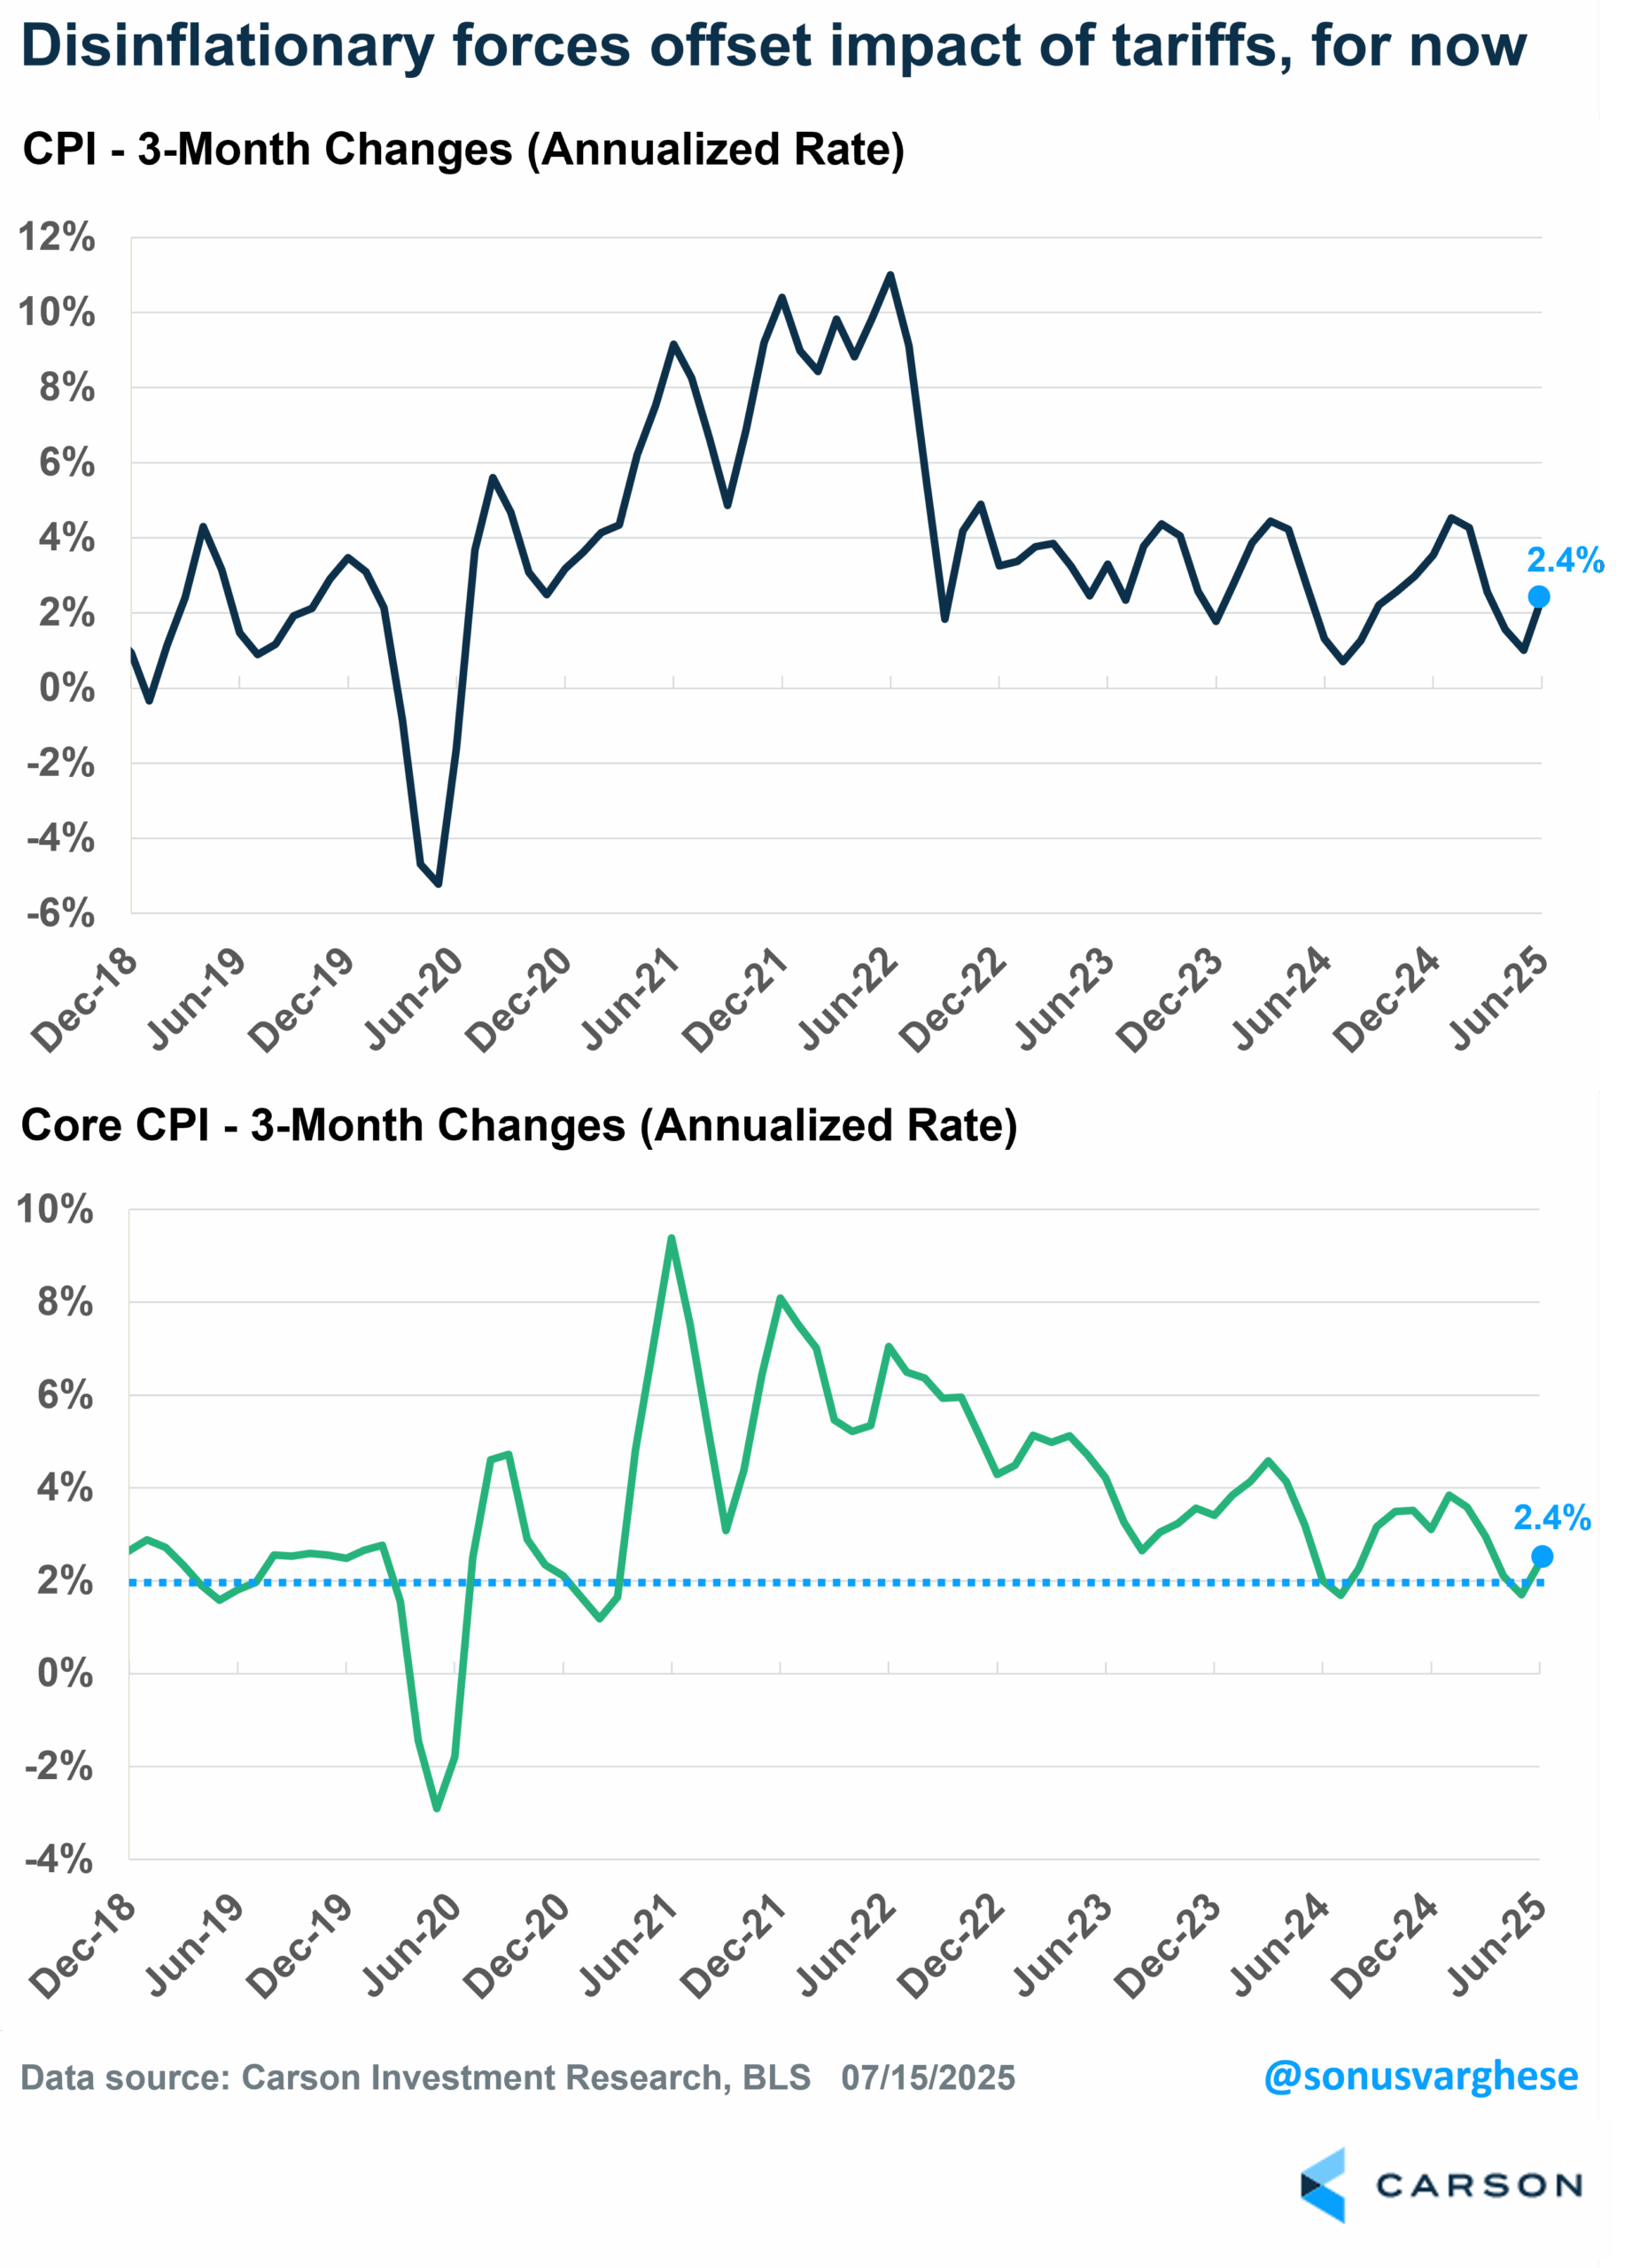
The headline Consumer Price Index (CPI) rose 0.3% in June and is up 2.4% annualized over the last three months. Core inflation, excluding food and energy prices, rose just 0.2% in June and is also up just 2.4% annualized over the last 3 months. These aren’t particularly concerning inflation numbers, at least as far as the Fed is concerned. But there’s a lot going on under the hood.
Tariff Impact Shows Up
If you want to look for the impact of tariffs, core goods (outside of food and energy) would be the place. And prices are rising there. Some areas where we saw a notable pickup in prices in June:
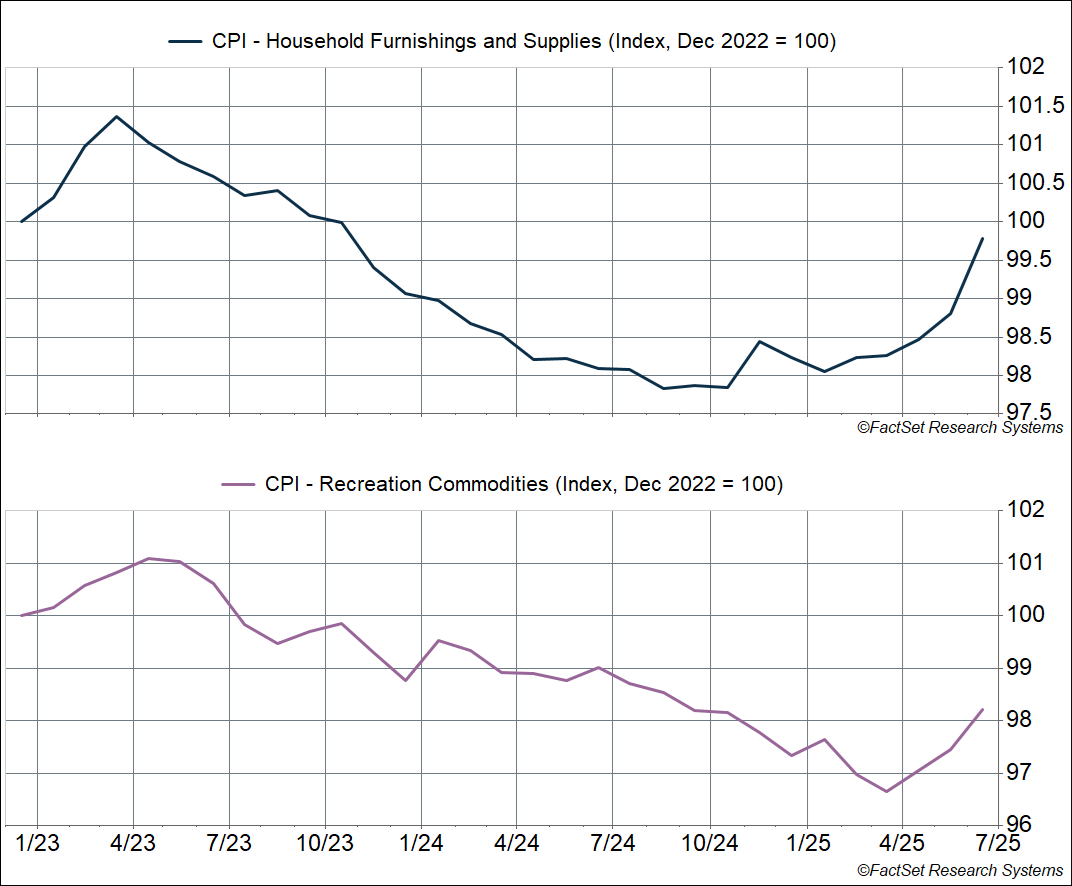
- Household furnishings and supplies (including appliances): +1.0% (12.4% annualized); last three months: +6.3% (annualized)
- Recreation commodities: +0.8% (9.8% annualized); last three months: +6.6% (annualized)
You can see the sharp upswing in prices for both these categories in the chart below. The June increase was the fastest monthly pace since the peak of pandemic-driven inflation in 2022.
Another area that is not being discussed is the tariff impact on food prices. Higher food prices hit households even harder than gas prices (we all have to eat, whether at home or outside). The bad news is that food prices are rising more than normal, for a variety of reasons, including tariffs.
Grocery prices rose 0.3% for the second straight month in June. This was despite meat/poultry/fish/egg prices falling 0.1% in June (egg prices fell 7.4%). On the other hand, coffee prices rose 2.2% in June and are up 13% over the past year.
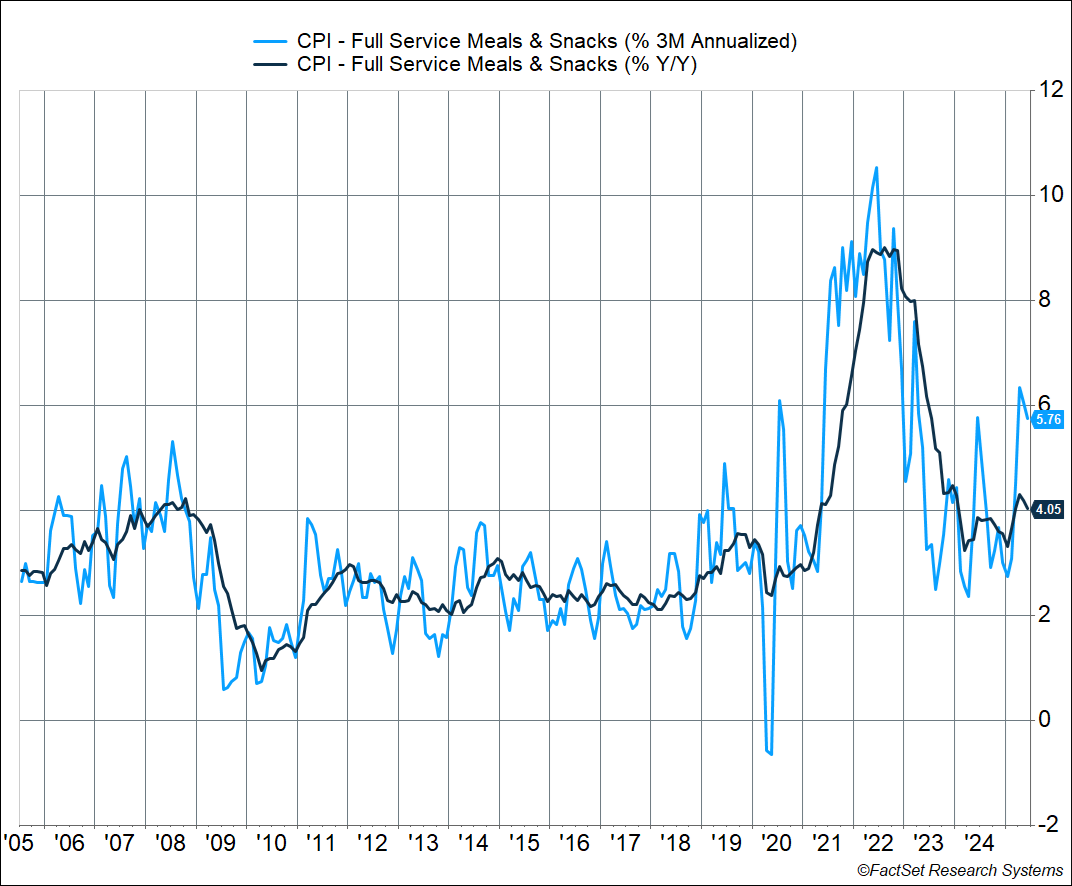
I like to keep an eye on CPI of “full services meals and snacks,” i.e. seated restaurants, to gauge underlying inflationary pressure. That’s because it combines several drivers of inflation including:
- Worker wages
- Food inflation, and even energy prices (including transportation)
- Rent of restaurant premises
Prices for restaurant meals jumped 0.5% in June (that’s about 6% annualized). Prices are running at a 5.8% annualized pace over the past three months and are up 4.1% from last year. That’s well above pre-pandemic levels and levels that would be consistent with “normal” 2% inflation.
Normally, I’d say this is a symptom of underlying inflationary pressures, driven by strong labor income. But we know worker wages are easing, and it’s unlikely higher rents are a problem, which means the source of inflation is underlying food prices, and probably energy and transportation costs.
In fact, nationwide average diesel prices, which are more tied to food price inflation, are at their highest levels in almost a year, hitting $3.72/gallon.
Stay on Top of Market Trends
The Carson Investment Research newsletter offers up-to-date market news, analysis and insights. Subscribe today!
"*" indicates required fields
Big Disinflationary Forces Are Also in Play
The biggest disinflationary force that is countering the inflationary impact of tariffs, and even higher food prices, is shelter (housing). Shelter makes up about 35% of the CPI basket and 44% of core CPI, and so it matters a lot. As a reminder, shelter inflation is made up of two major components:
- Rents of primary residences: 8% of CPI and 10% of core CPI
- Owners’ equivalent rent (OER): 27% of CPI and 34% of core CPI
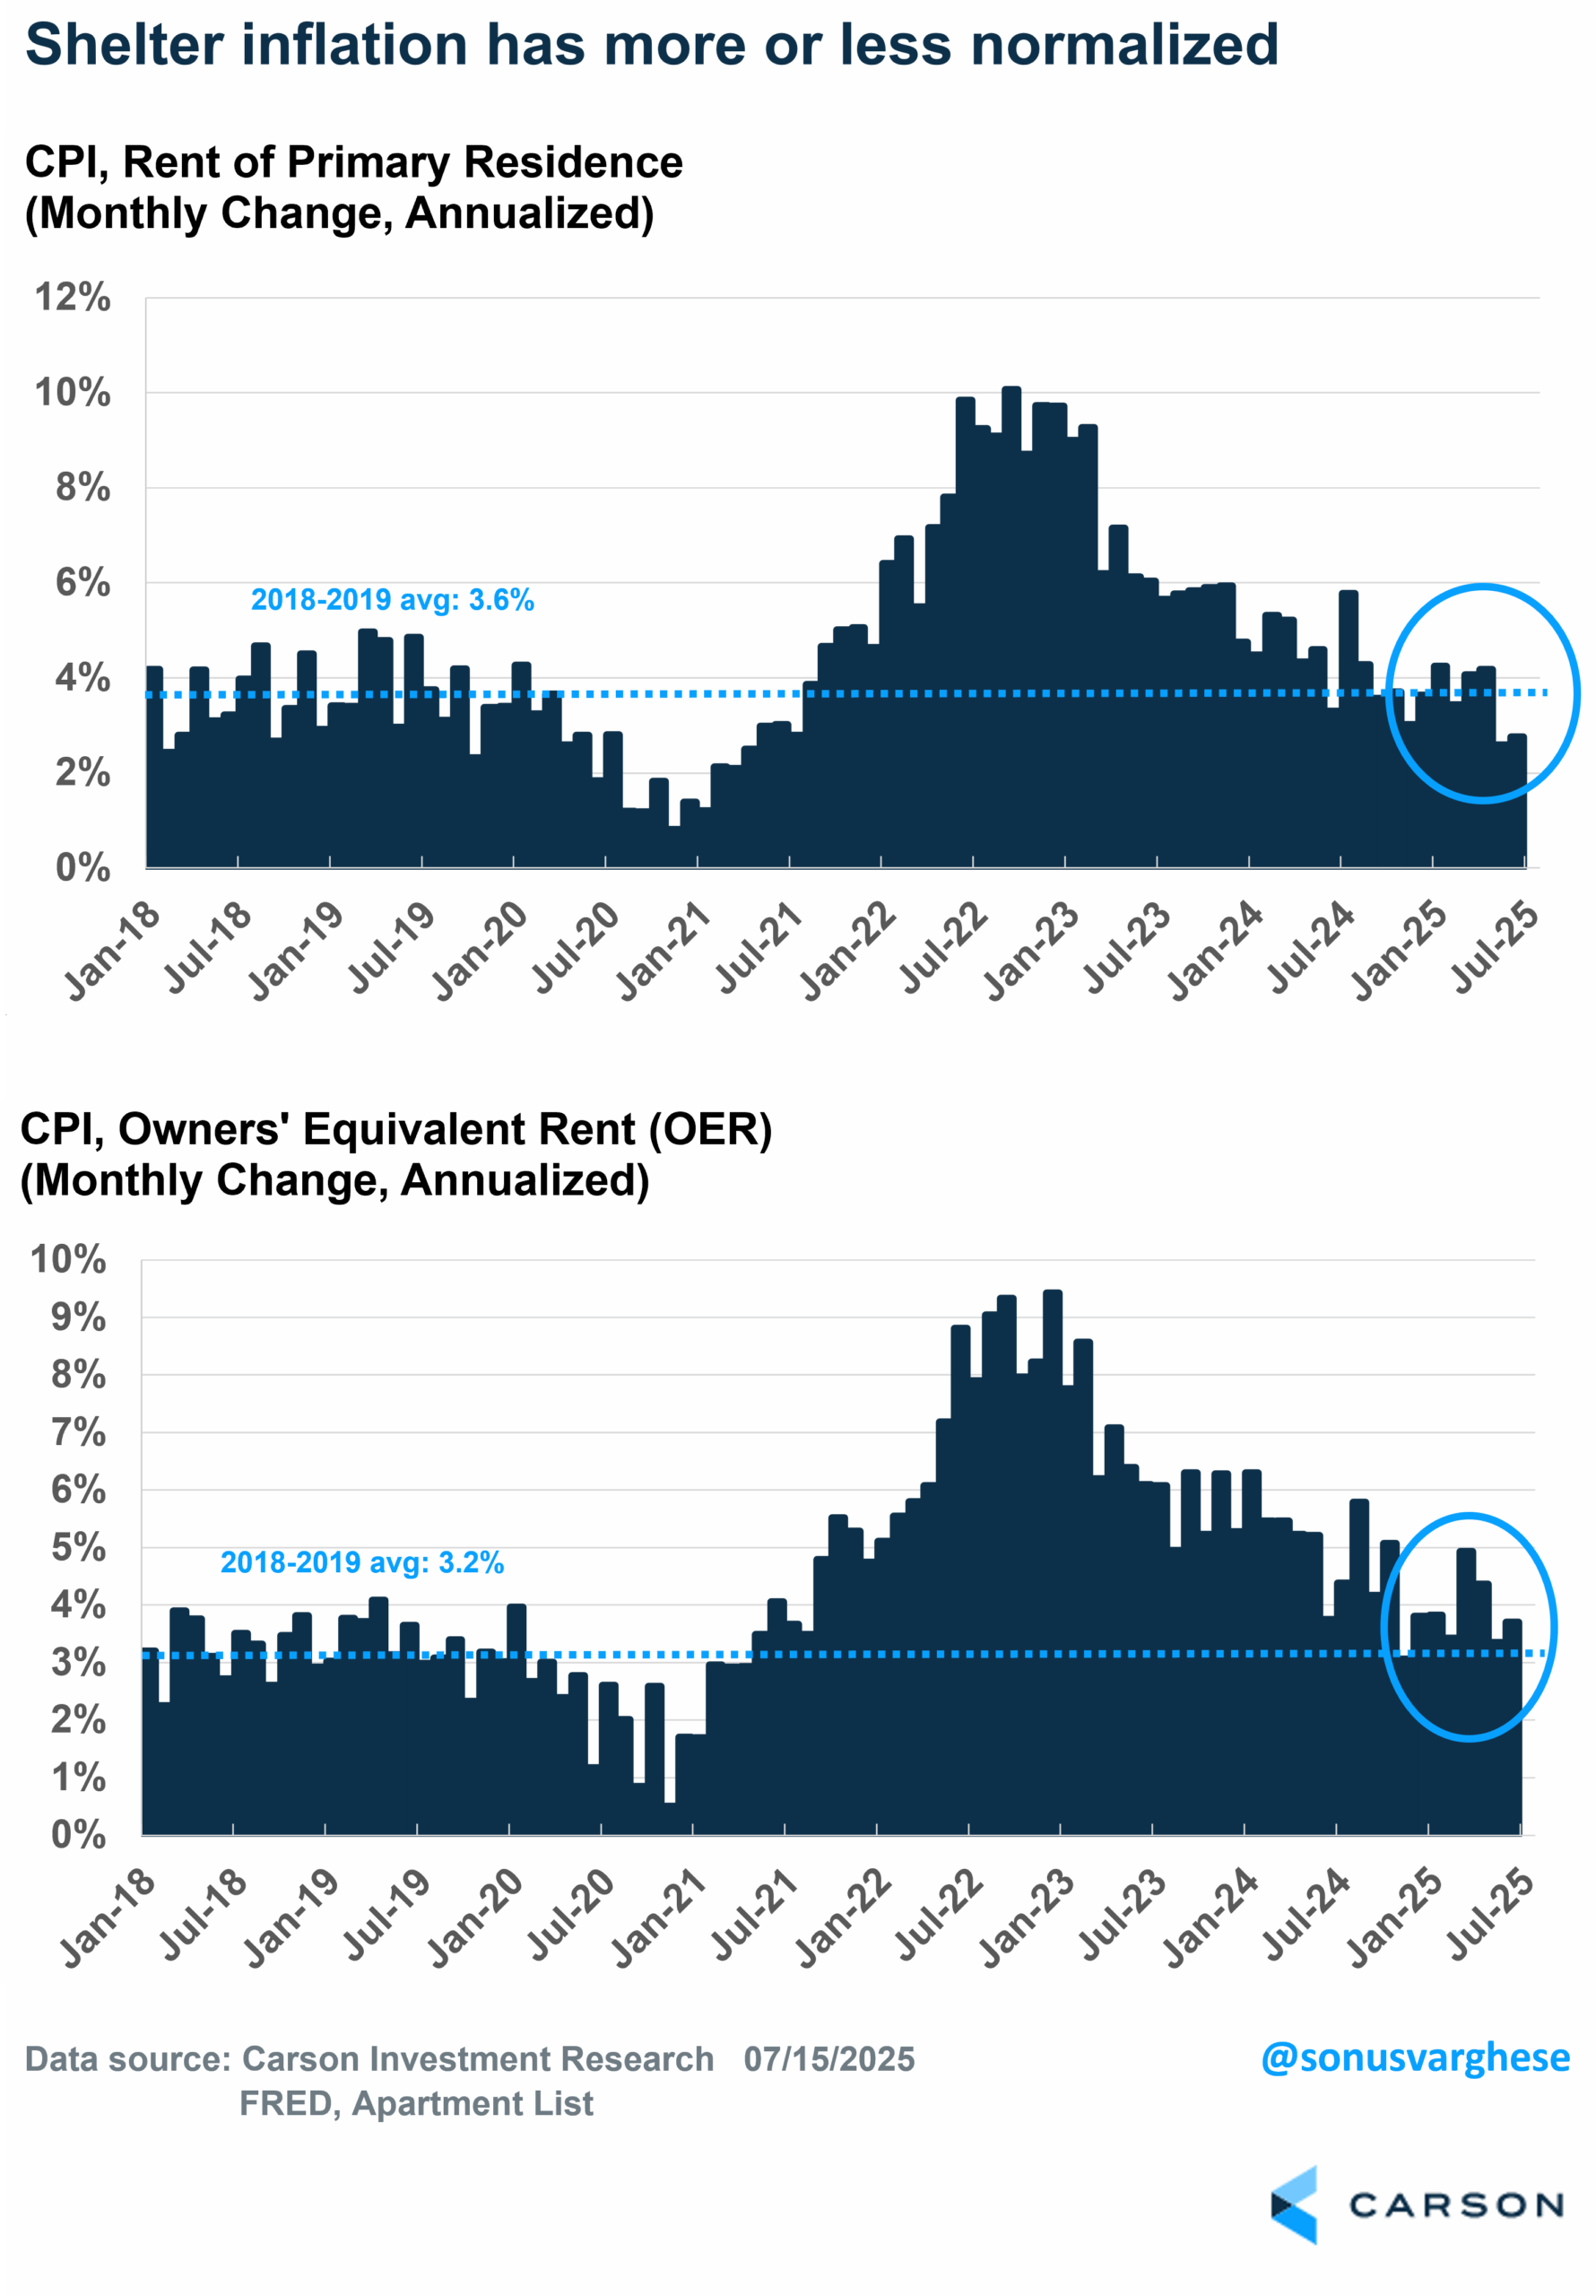
We saw a big slowdown in May and June, especially for rents of primary residences. Over the last three months rents are up 3.2% annualized and OER is up 3.8%. As you can see below, on a monthly basis, shelter inflation has more or less normalized, at least relative to what we saw in 2018–2019.
The good news is that if you look at the private market data, there may be more shelter disinflation to come. Private rental inflation data form Apartment Lists still shows nationwide rents declining 0.6% year over year, the 25th straight month of declines, which means rents should continue to ease.
We’re also seeing disinflation in key cyclical areas, notably travel:
- Airfares fell 0.1% m/m in June, the fifth straight month of declines. Last three months: -21% annualized
- Lodging including hotels/motels fell 3.6% in June, the fourth straight month of declines. Last three months: -15% annualized
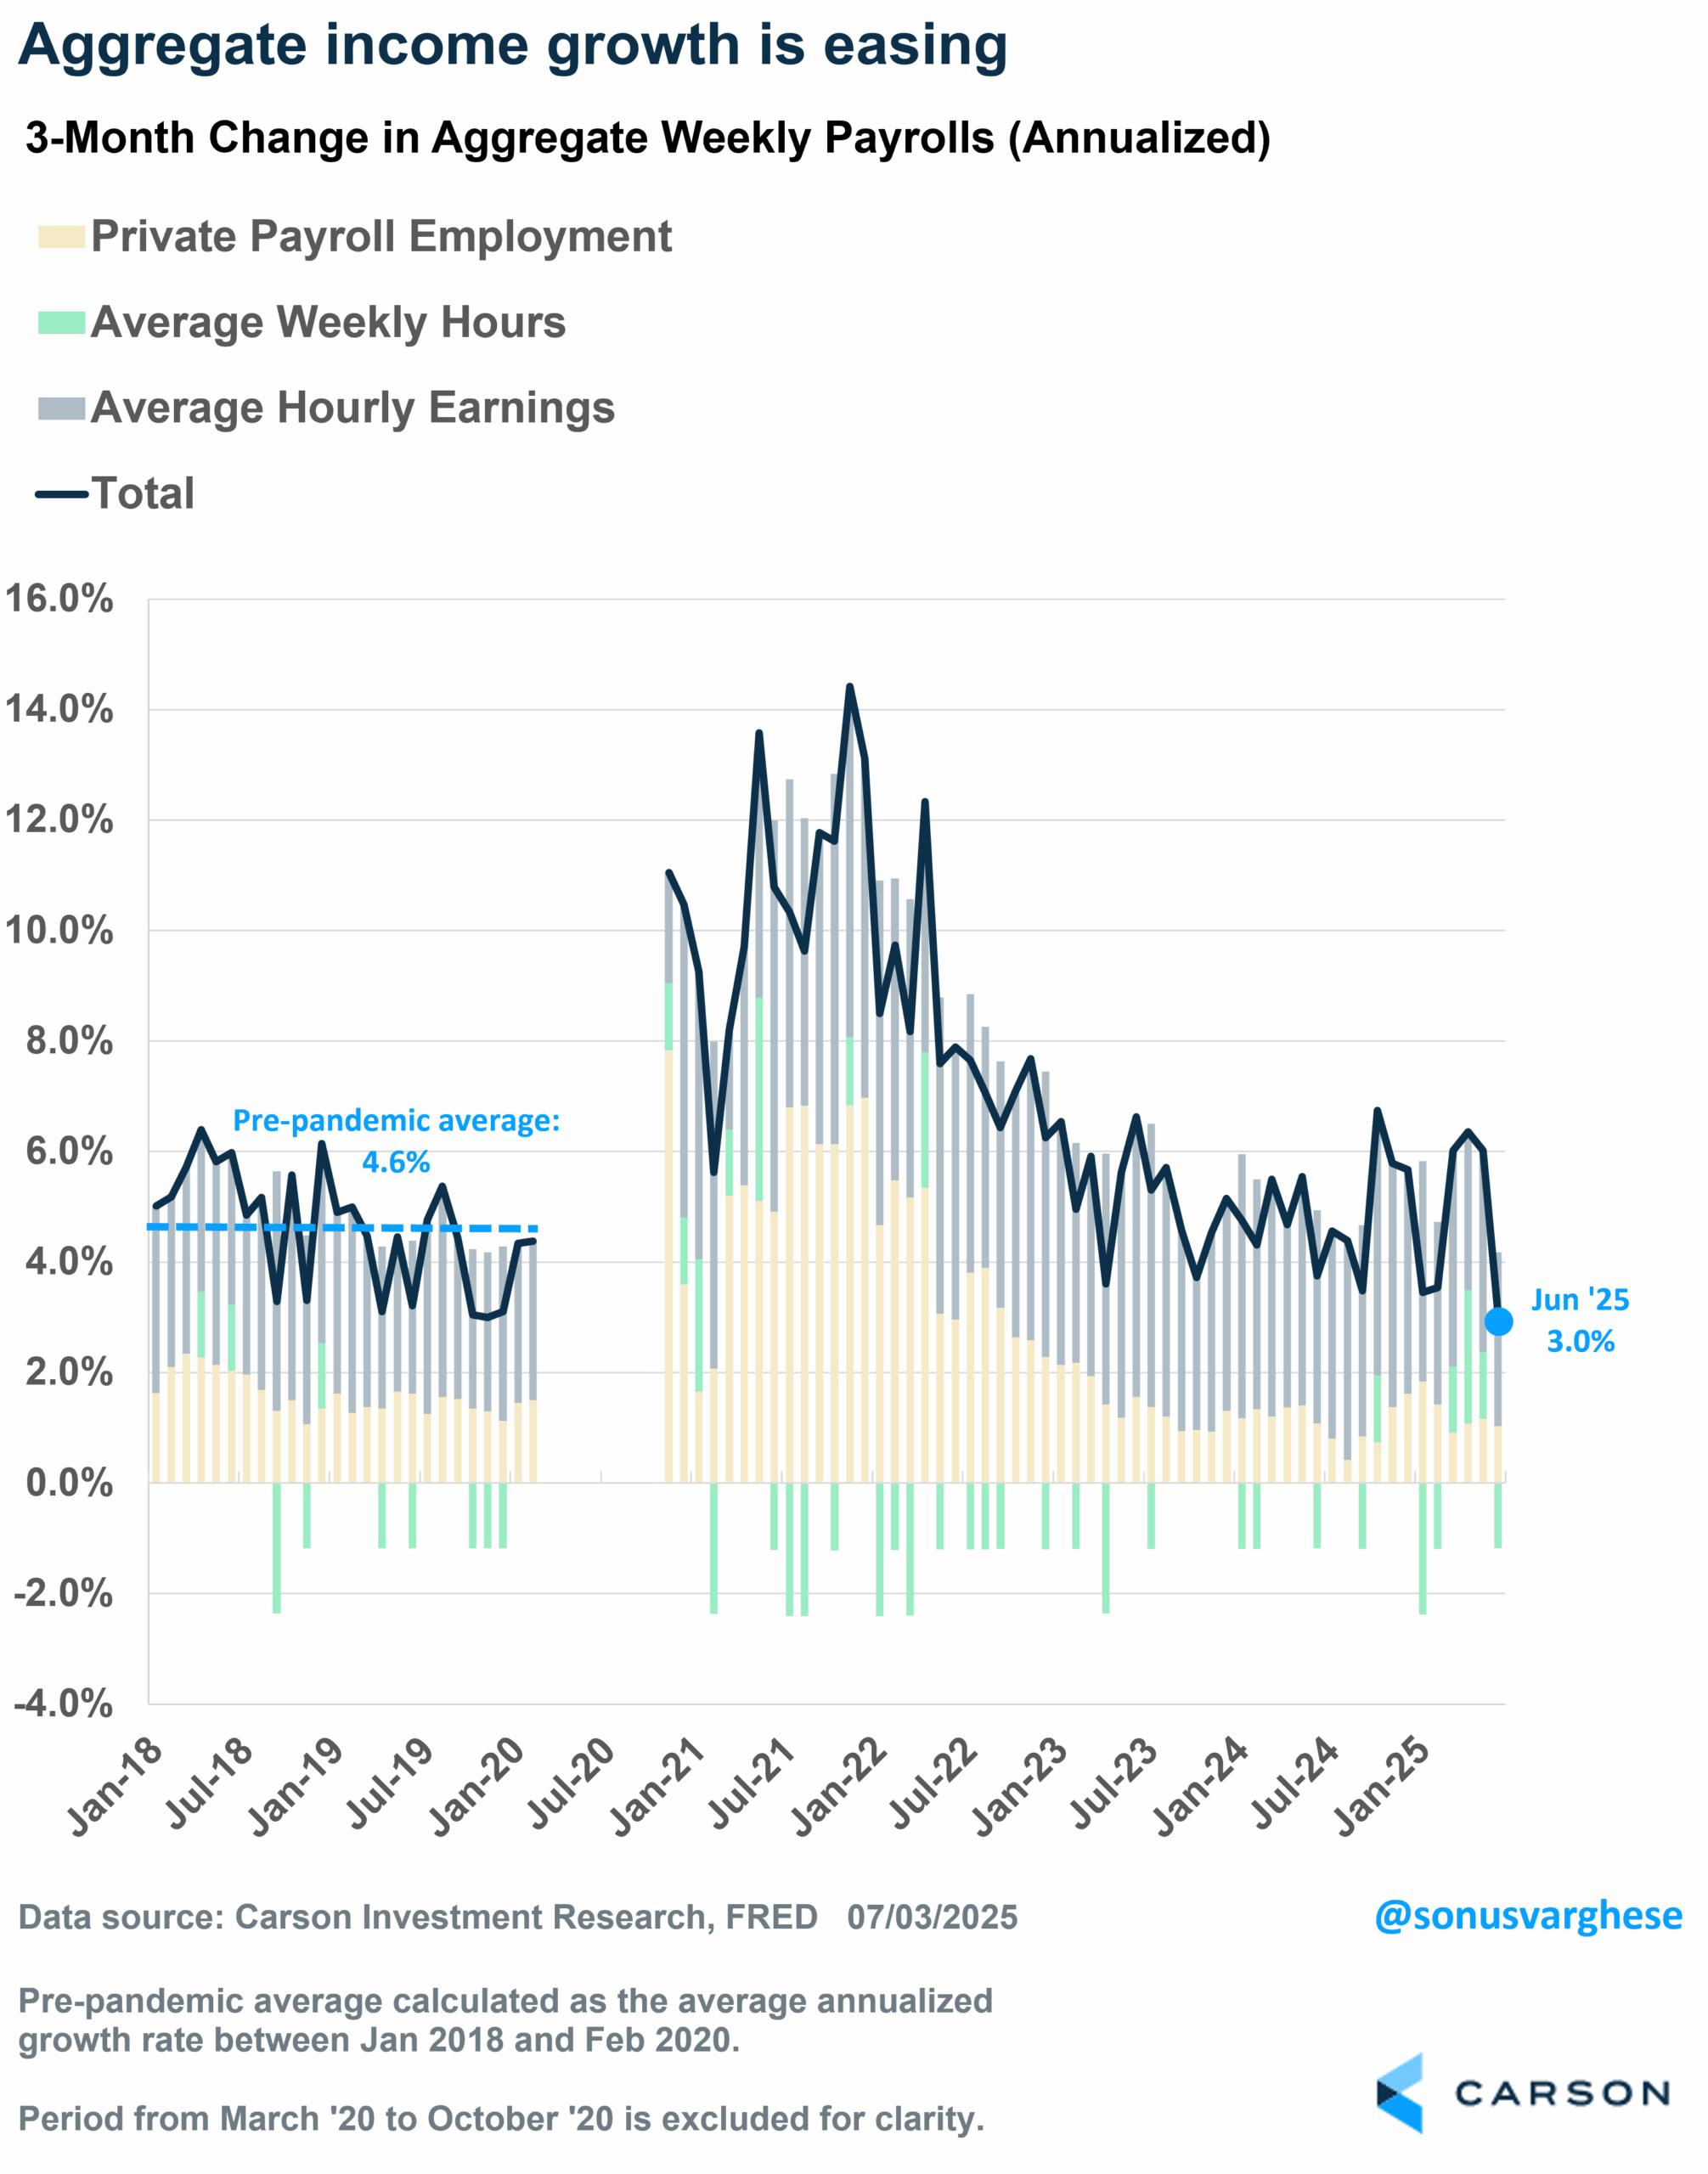
This is not exactly good news as it tells me that travel demand is soft. And that’s likely because aggregate income is slowing even as monetary policy remains too tight (with higher rates). Aggregate income is the product of:
- Job growth, which is slowing
- Wage growth, also slowing
- Hours worked, which is running soft
Aggregate income growth rose just 3% annualized over the past three months. Think of that as the pace of nominal GDP, and if you shave off about 2% for inflation, that means real GDP growth is clocking in around 1%. That’s not recessionary but it is really soft, and well below the near 3% pace we saw in 2023-2024. Meanwhile, Fed policy rates are around 4.4%.
The Fed Is in a Bind of Its Own Making
Here’s the Fed’s conundrum right now: tariff-related inflation is clearly showing up. But there’s weakness in the economy, especially income growth.
- If they don’t cut rates, that weakness gets even worse, because policy is too tight.
- If they do cut rates that could make the inflation problem worse, with demand rising once again, boosting cyclical activity (and prices), adding to inflationary pressure from tariffs.
The Fed is in a bind. If they signal a cut, they could look very foolish if July, August, and September inflation data turn out to be hot, on the back of tariffs. And they likely don’t want to look foolish again, given what happened in 2021. From that perspective, they’re right to wait at this point.
This predicament could’ve been avoided if they’d cut rates back in January and March, for a total of 0.5%-points. Policy rates would’ve been in the 3.75–4.0% range, which would still be on the tighter side, but not extremely so (the Fed’s own estimate of “neutral” is 3%). And if tariff inflation showed up, they could’ve waited on more cuts even as the economy didn’t feel the weight of really tight monetary policy. In that scenario, we could’ve ended 2025 with rates below 4% instead of above, which may be likely now.
It may be December before a rate cut actually materializes, if at all. That means policy is going to remain extremely tight for another six months or so and will likely get even tighter if wage growth continues to ease.
Of course, that’s going to put even more pressure on Powell personally from the White House. President Trump was apparently close to firing him, even showing off a letter stating that to House Republicans. But he pulled back, for now. The pressure will only increase when the Fed skips cutting rates in July, and perhaps in September as well.
Ryan and I discussed the inflation picture and Powell’s prospects of staying on the job on our latest Facts vs Feelings podcast. Take a listen.
For more content by Sonu Varghese, VP, Global Macro Strategist click here
8184739.1.-07.17.25A
