Let me start here: if inflation averages 2% over 10 years, that translates to an 18% cumulative loss of purchasing power, i.e., $10,000 of a typical basket of goods and services today would cost $12,190 in a decade.
- If inflation averages 3% over 10 years, that translates to a 26% cumulative loss of purchasing power, i.e., $10,000 of purchases today would cost $13,439 in a decade.
- If inflation averages 4% over 10 years, that translates to a 32% cumulative loss of purchasing power, i.e., $10,000 of purchases today would cost $14,802 in a decade.
Over the last 5 years (2021-2025), the Consumer Price Index (CPI) has averaged a 4.5% annual inflation rate. The Federal Reserve’s (Fed) preferred inflation metric, the Personal Consumption Expenditures Price Index (PCE), has averaged 4.0%.
The Fed’s official target is 2%. They haven’t gotten close to that in five years, and it doesn’t look like they’re going to any time soon.
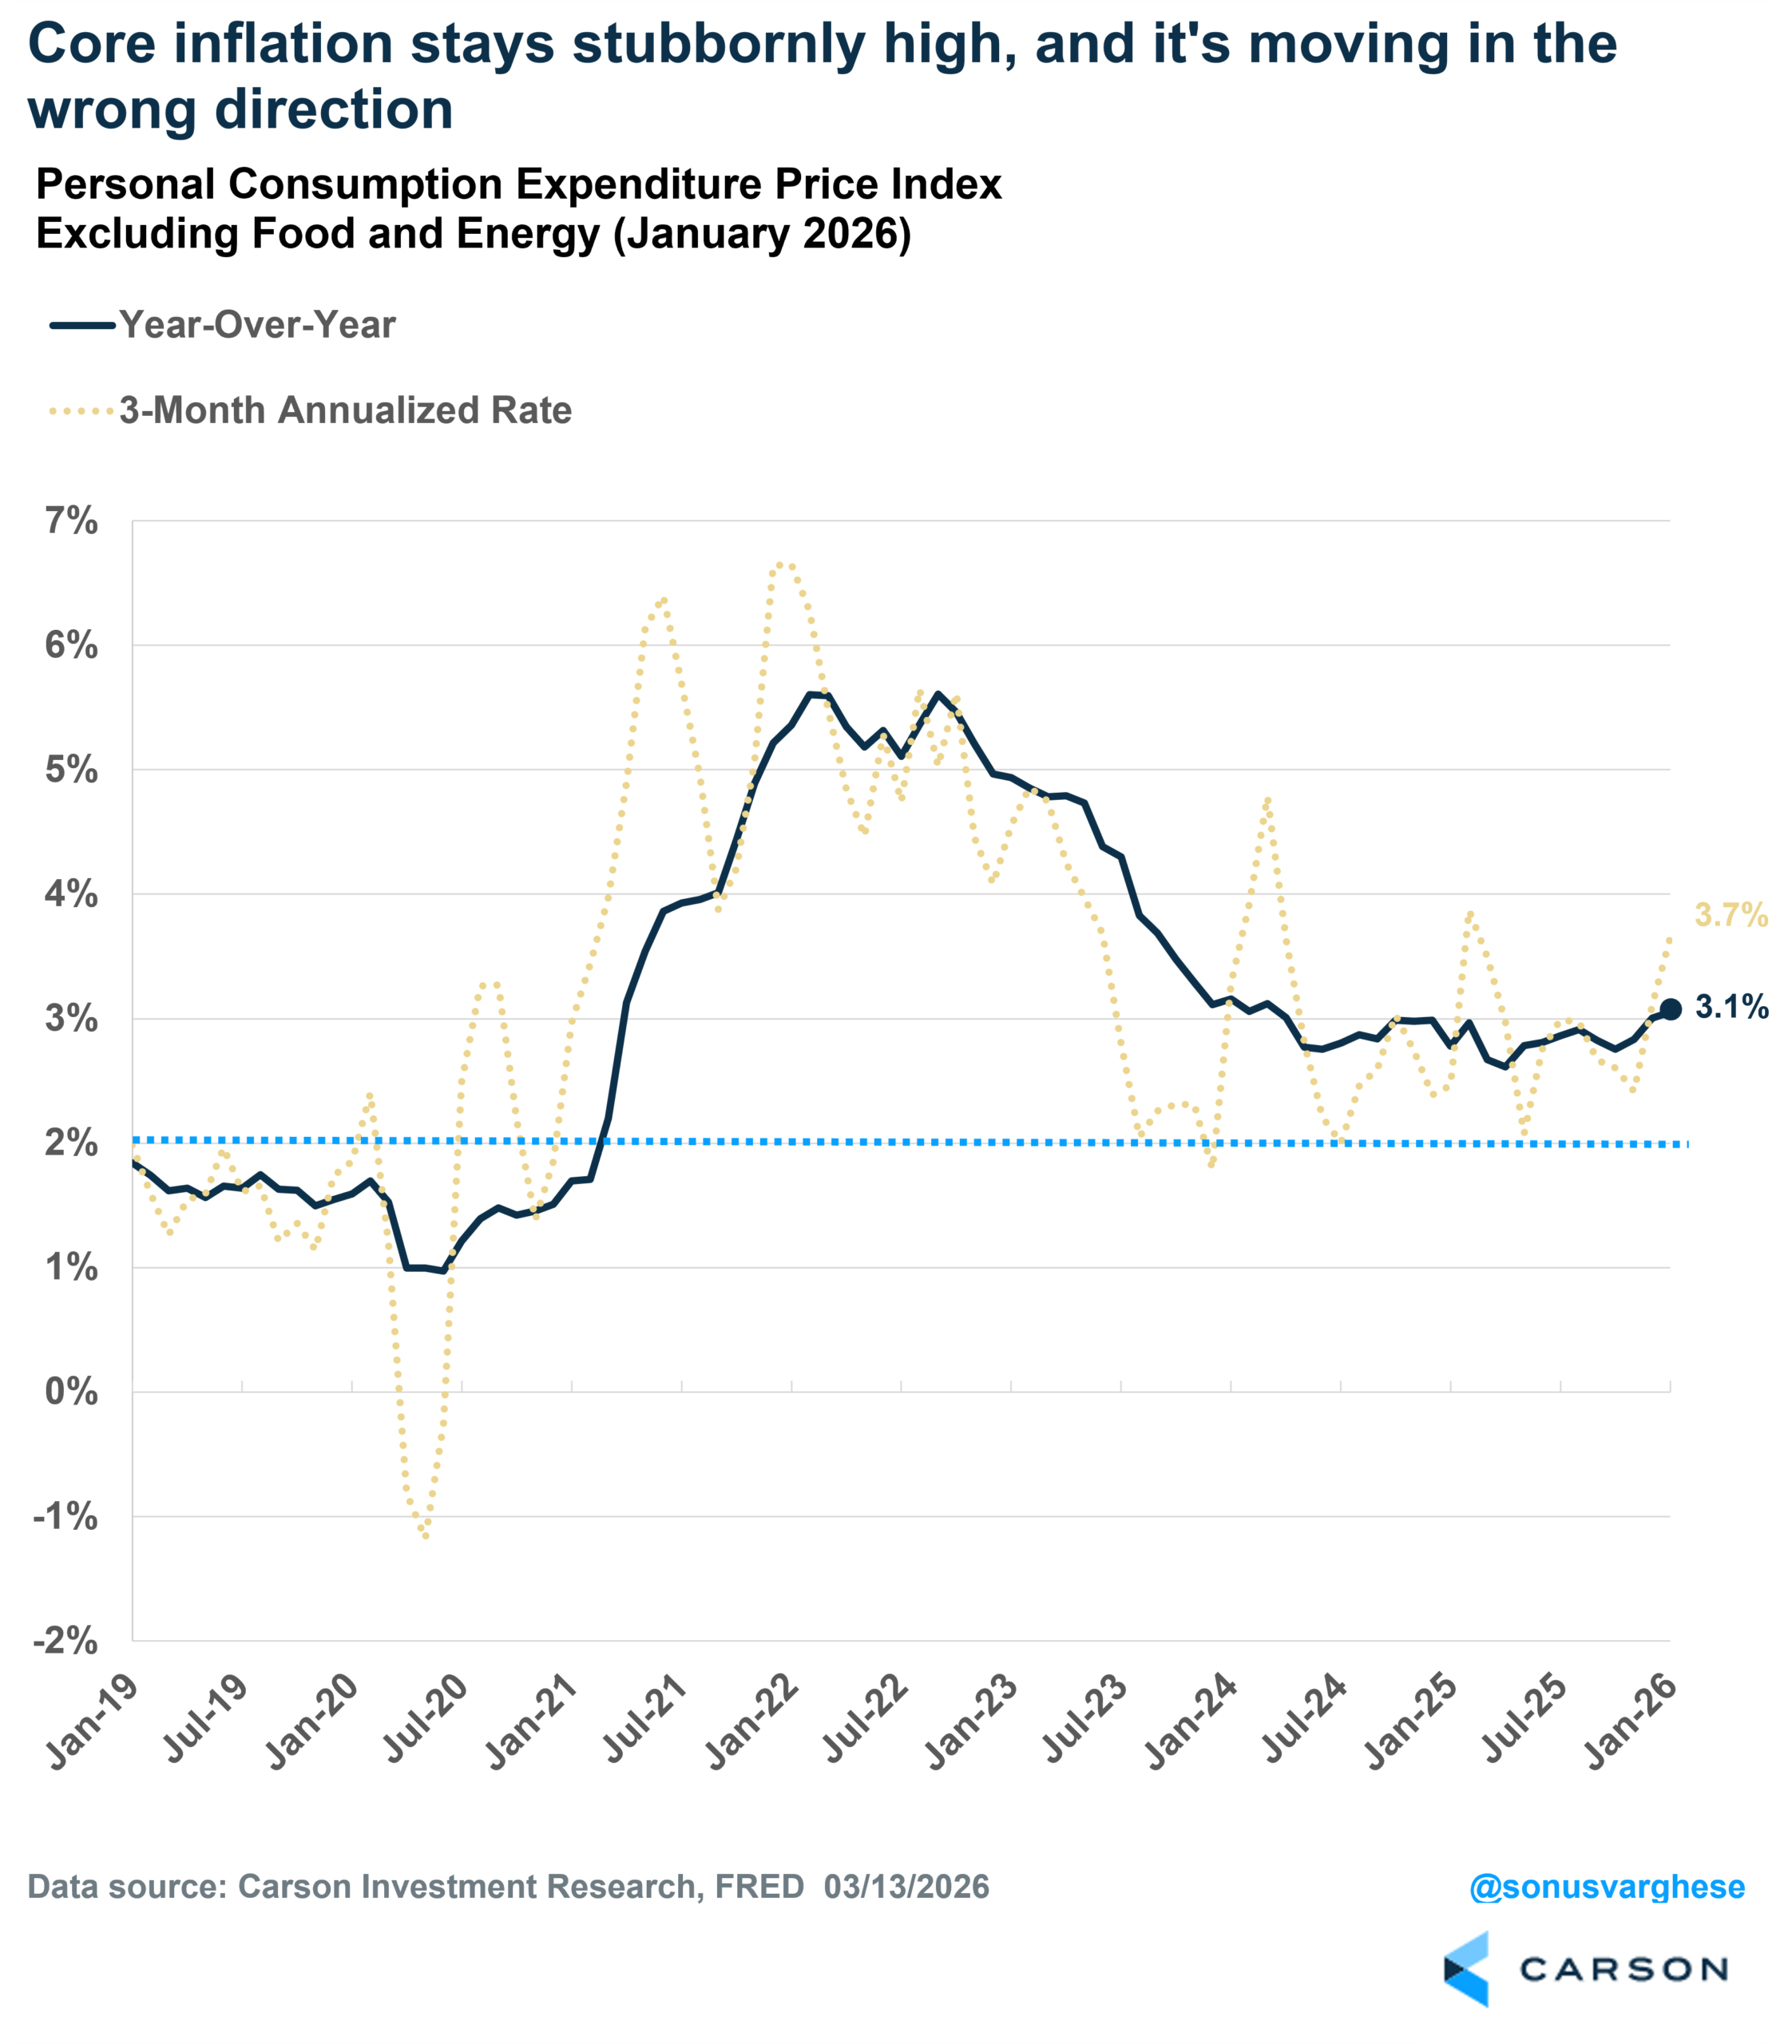
We’re still getting inflation data from a couple of months ago (January). But it’s useful to gauge where things were prior to the current crisis, and inflation was already moving the wrong way. A single month’s data can be noisy, and so I’m going to broaden the window here.
- Headline PCE inflation rose at an annualized pace of 3.5% from November to January and is up 2.8% over 12 months.
- Core PCE inflation (ex-food and energy) rose at an annualized pace of 3.7% from November to January and is up 3.1% over 12 months (the fastest pace since March 2024).
Going the wrong way, inflation is (as Master Yoda would say, for those of you Star Wars fans).
Headline and even core numbers can hide what’s happening under the hood. Core inflation has certainly been pulled higher by tariff-impacted goods and even higher stock prices (portfolio management services are included in PCE, and that is driven by stock prices). One reason the Fed switched from CPI to PCE back in 2000 is that PCE has a much broader basket of goods and services (and it accounts for substitution effects when people switch from certain goods and services to others). So I looked at 178 items within the core PCE basket and calculated the distribution of year-over-year inflation at four different times. You can see how inflation really broadened out in June 2022 relative to December 2019. The good news up until last year was that the distribution was narrowing, but things were still not quite “normal.” But over the past year, things have reversed:
- In December 2019, just 24% of items had inflation rates above 3%.
- In June 2022, 72% of items had inflation rates above 3%.
- In January 2025, 40% of items had inflation rates above 3%.
- In January 2026, 51% of items had inflation rates above 3%.
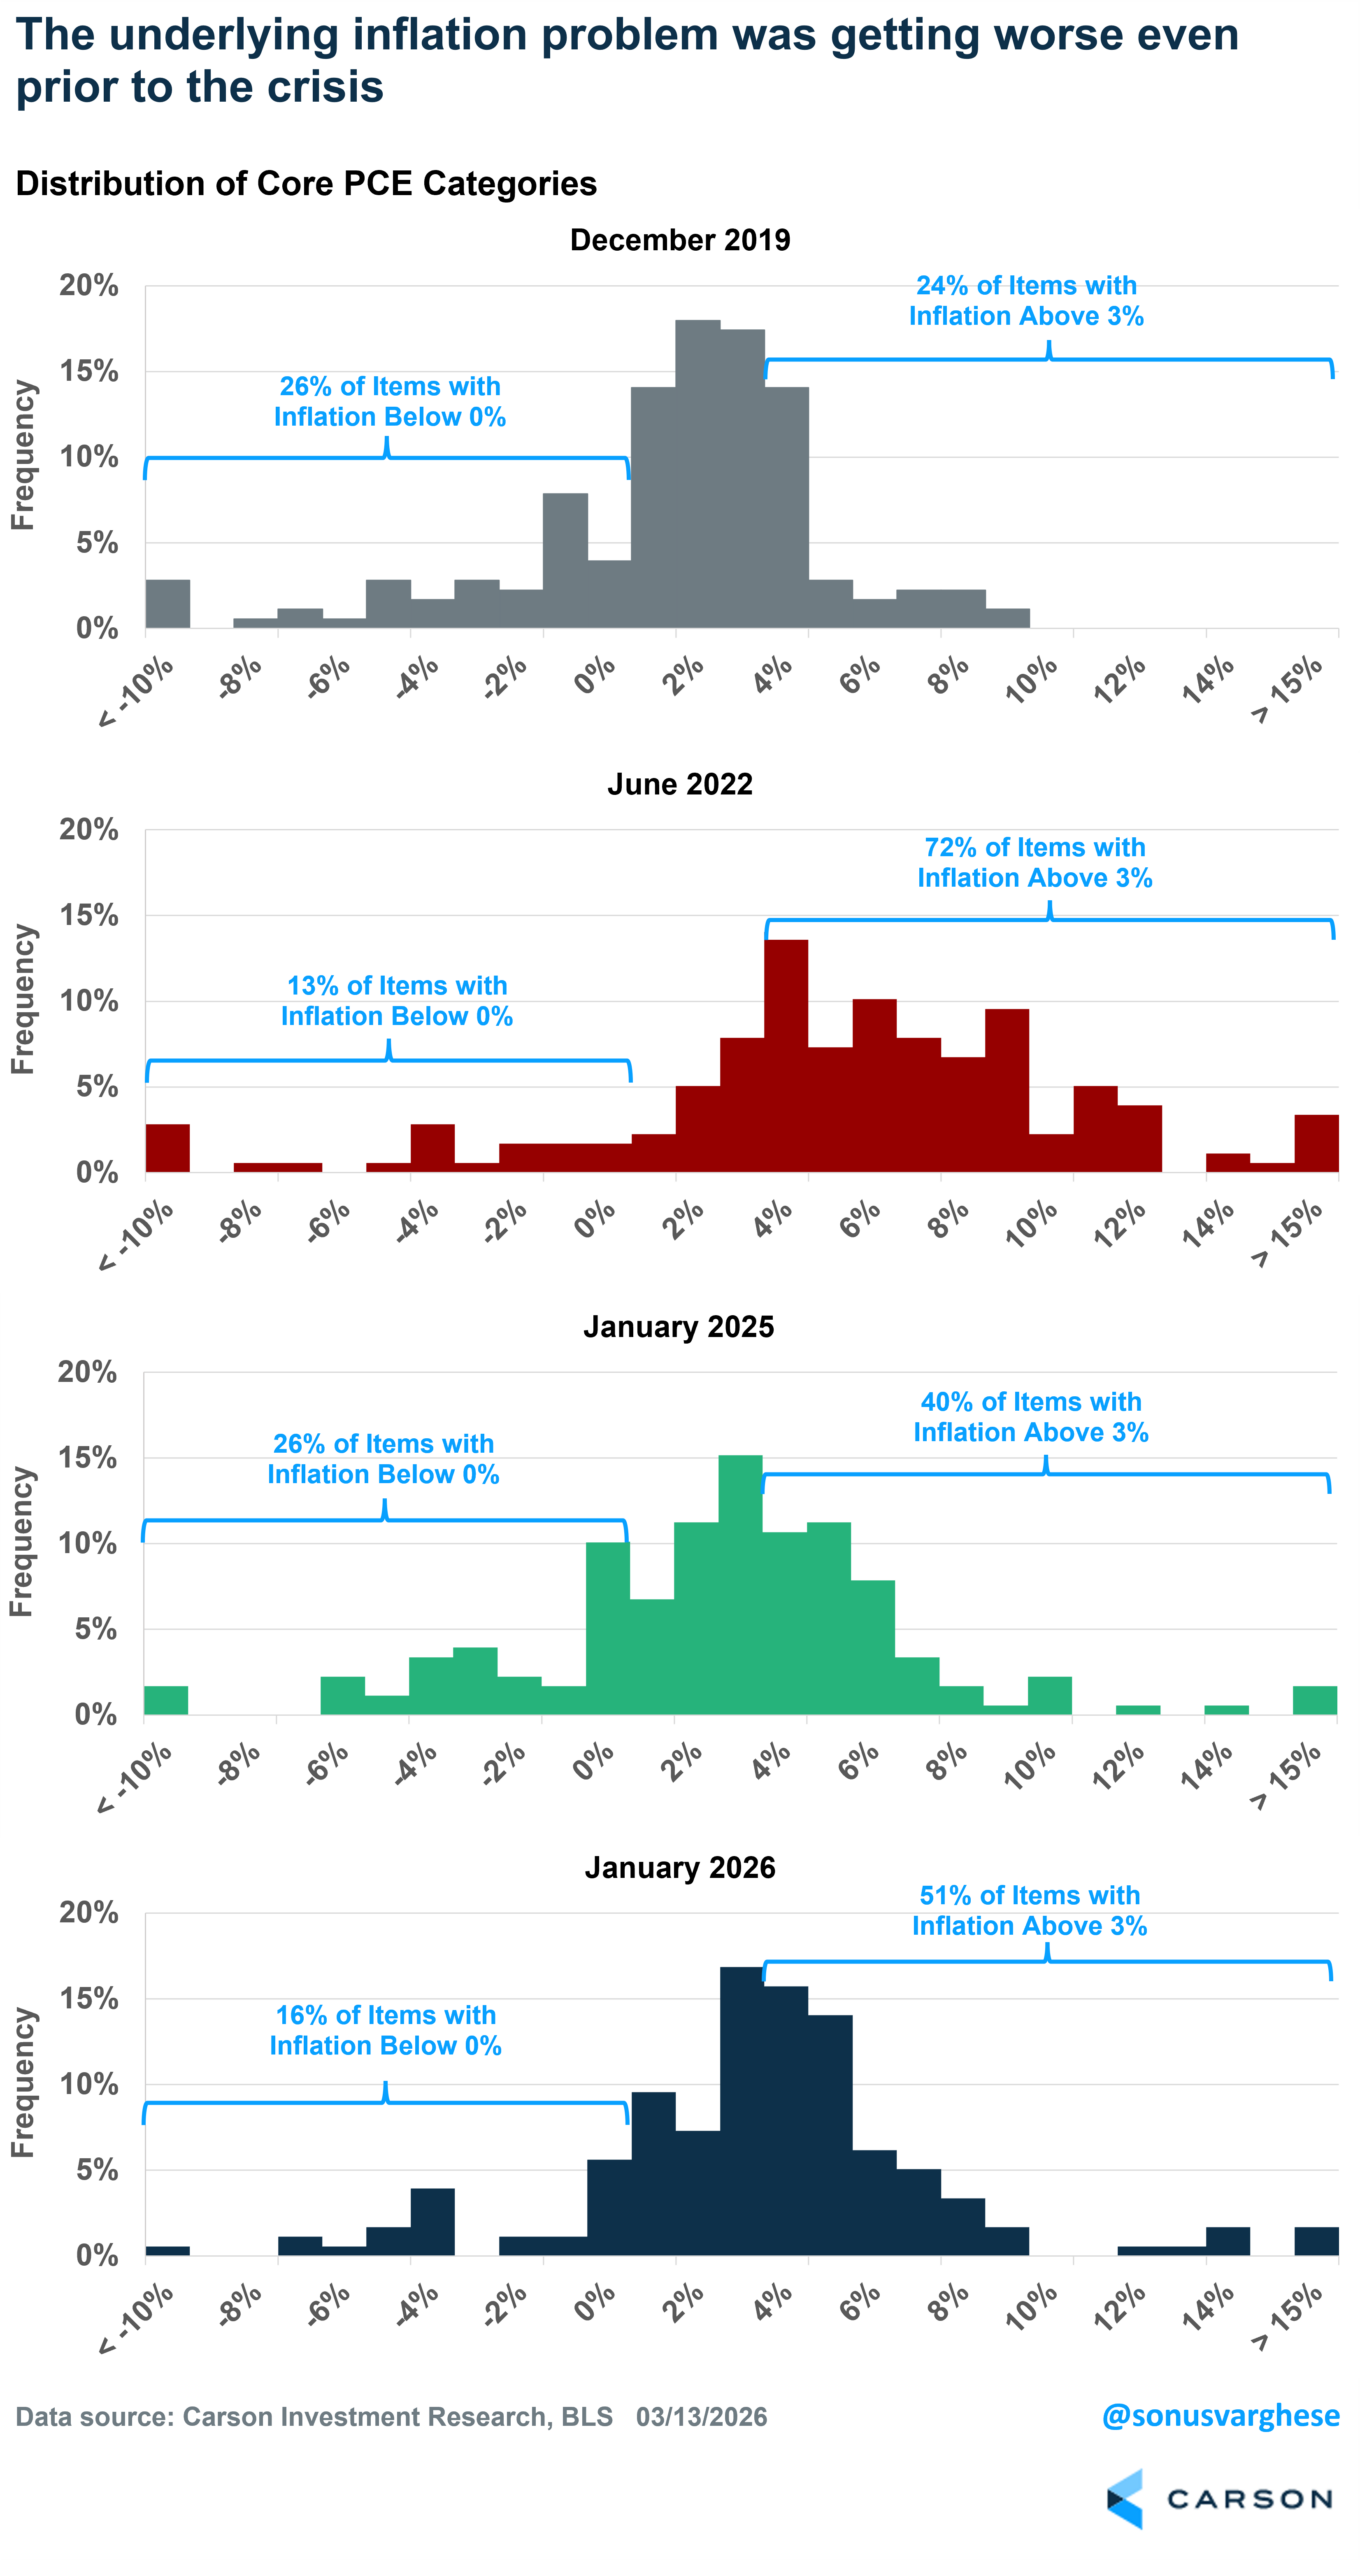
Long story short, the inflation picture was not pretty prior to the Middle East crisis. And it’s going to get a lot worse.
Stay on Top of Market Trends
The Carson Investment Research newsletter offers up-to-date market news, analysis and insights. Subscribe today!
"*" indicates required fields
Not Just an Energy Shock
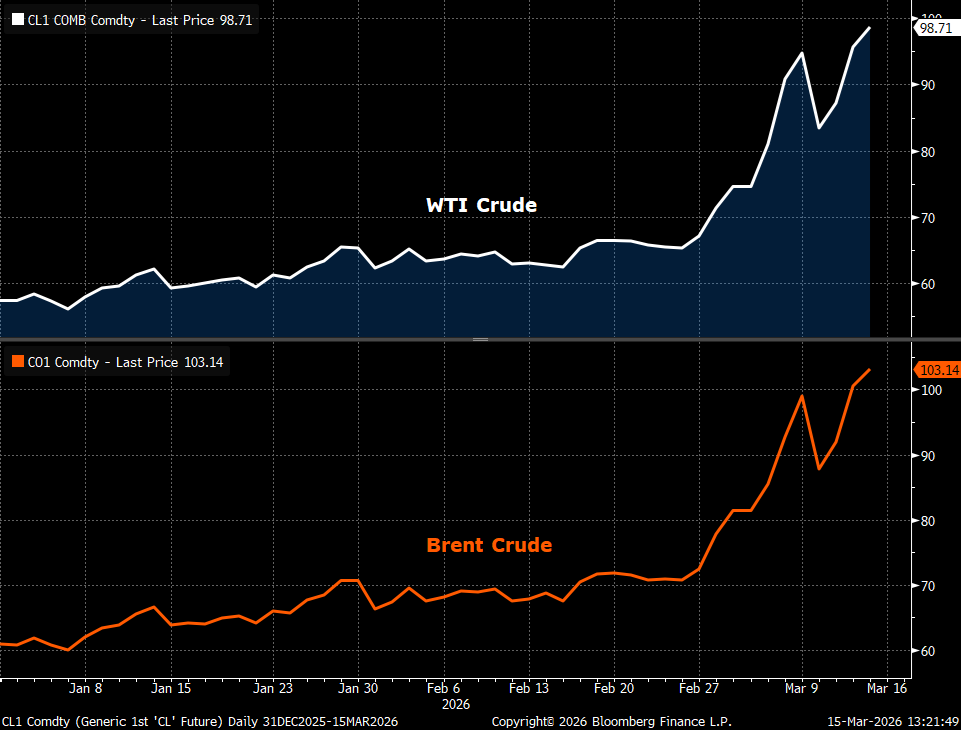
It won’t be a surprise to see all the inflation readings (pick your favorite metric) jump next month on the back of oil prices. Oil prices were already rising in January and February, and have surged even more over the past two weeks since the US and Israel first struck Iran on February 27.
- WTI crude has surged close to $100/barrel, rising 47% since 2/27 and +72% year to date.
- Brent crude (more of a global benchmark) is above $100/barrel, rising 42% since 2/27 and is +70% year to date.
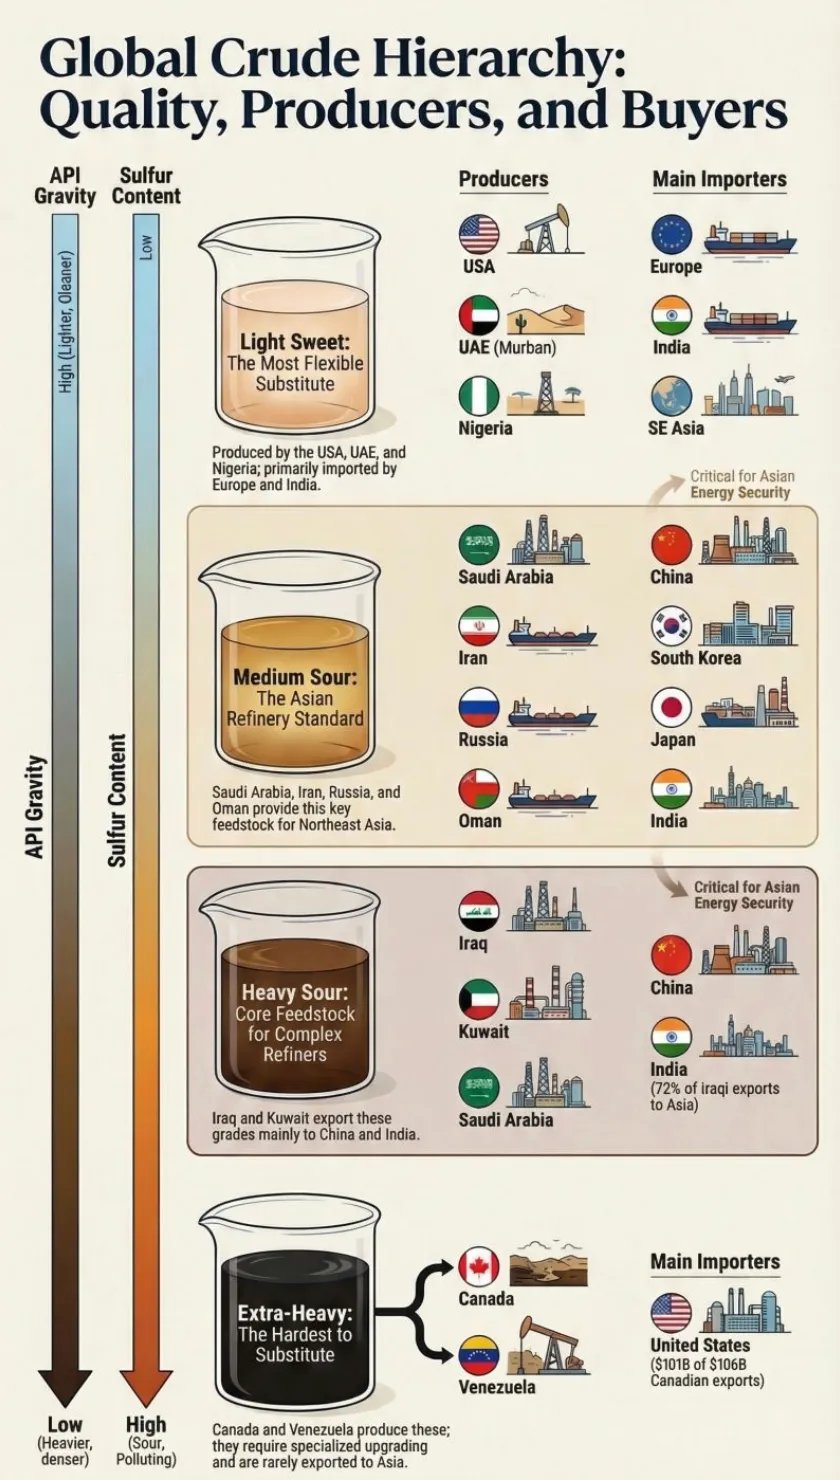
There’s a lot of commentary around the fact that the US is energy independent, and that is true. The US is the world’s largest producer of oil and now exports more petroleum products than it imports. However, that doesn’t mean too much in the immediate term because US oil companies can sell oil to global customers, and so the largest bid is what determines prices. And right now, there’s a massive bid because of a shortage, as the world has lost anywhere from 10-20% of the daily flow of oil it needs.
Moreover, a lot of the oil produced in the US is “light, sweet crude,” but what refineries here in the US mostly need is “heavy, sour crude,” which is imported from Canada and Venezuela. Refineries on the East Coast also need a lighter “medium” grade type of crude oil, which needs to be imported. This is also why an oil and gas export ban, should the administration implement one, will not help. In fact, it’ll hurt US oil producers as they won’t have anyone to sell to. The chart below matches oil types across the main suppliers and buyers.
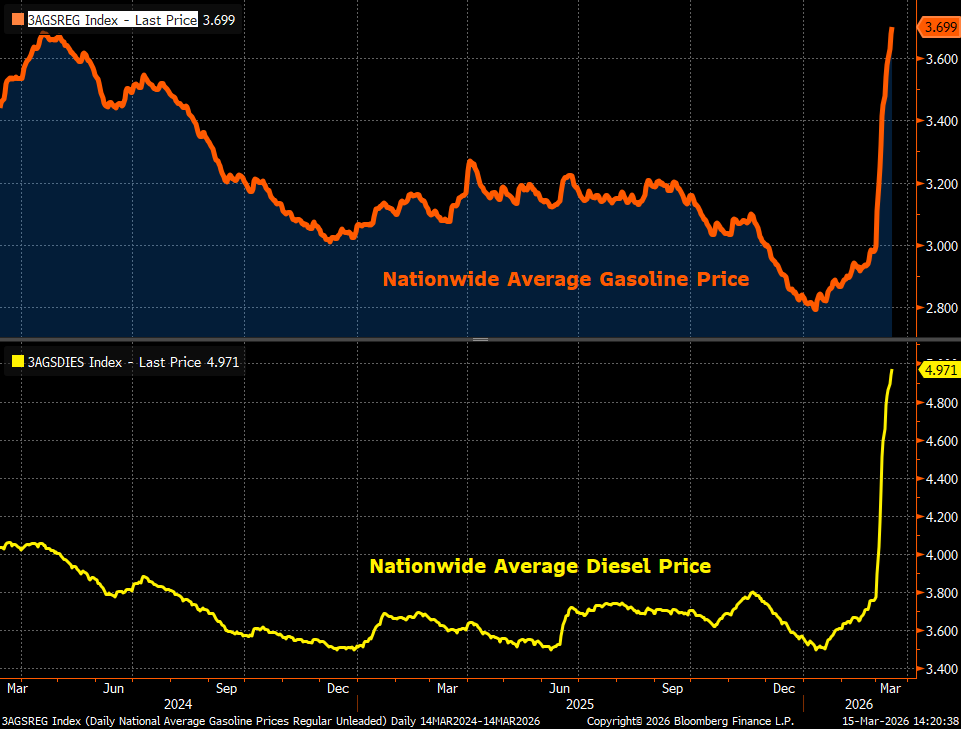
All this is why gasoline and diesel prices have surged, despite “energy independence.”
- Nationwide average gasoline prices have hit $3.70/gallon, the highest since October 2023. It was $2.80/gall just two months ago. We could very well see $4.0/gallon in a couple of weeks if this continues.
- Nationwide average diesel prices have hit $4.97/gallon, the highest since December 2022. It was under $3.50/gallon two months ago, and it looks like the trajectory is higher.
It would be one thing if the impact were just on gas prices, as a quick resolution to the conflict could send prices the other way (lower). But it’s not.
- Higher diesel prices will put upward pressure on food prices, as diesel is used to transport food.
- Fertilizers are made of urea, and that’s being disrupted by blocked exports from the Middle East. Fertilizer costs are surging, and that’ll feed its way into the global food production system later this year.
- Fuel oil prices are surging across the globe, sending container freight costs higher than what we saw in 2008 and 2022, and that’ll pass through to goods prices (and inflation).
- The Middle East is also a big source of helium, and that’s critical for semiconductor manufacturing. South Korean chip manufacturers get most of their helium from Qatar, and any disruption will lead to outright shortages, let alone increase the price of chips, and there was already a shortage prior to the crisis.
The decrease in the oil available is already disrupting the production of several products derived from petroleum (in addition to the ones mentioned above). Returning to normal will take several weeks, even if the crisis ended today. And the longer the crisis continues, the greater the ongoing disruption and time required to get back to “normal.”
Rate Hikes Are Back on the Menu
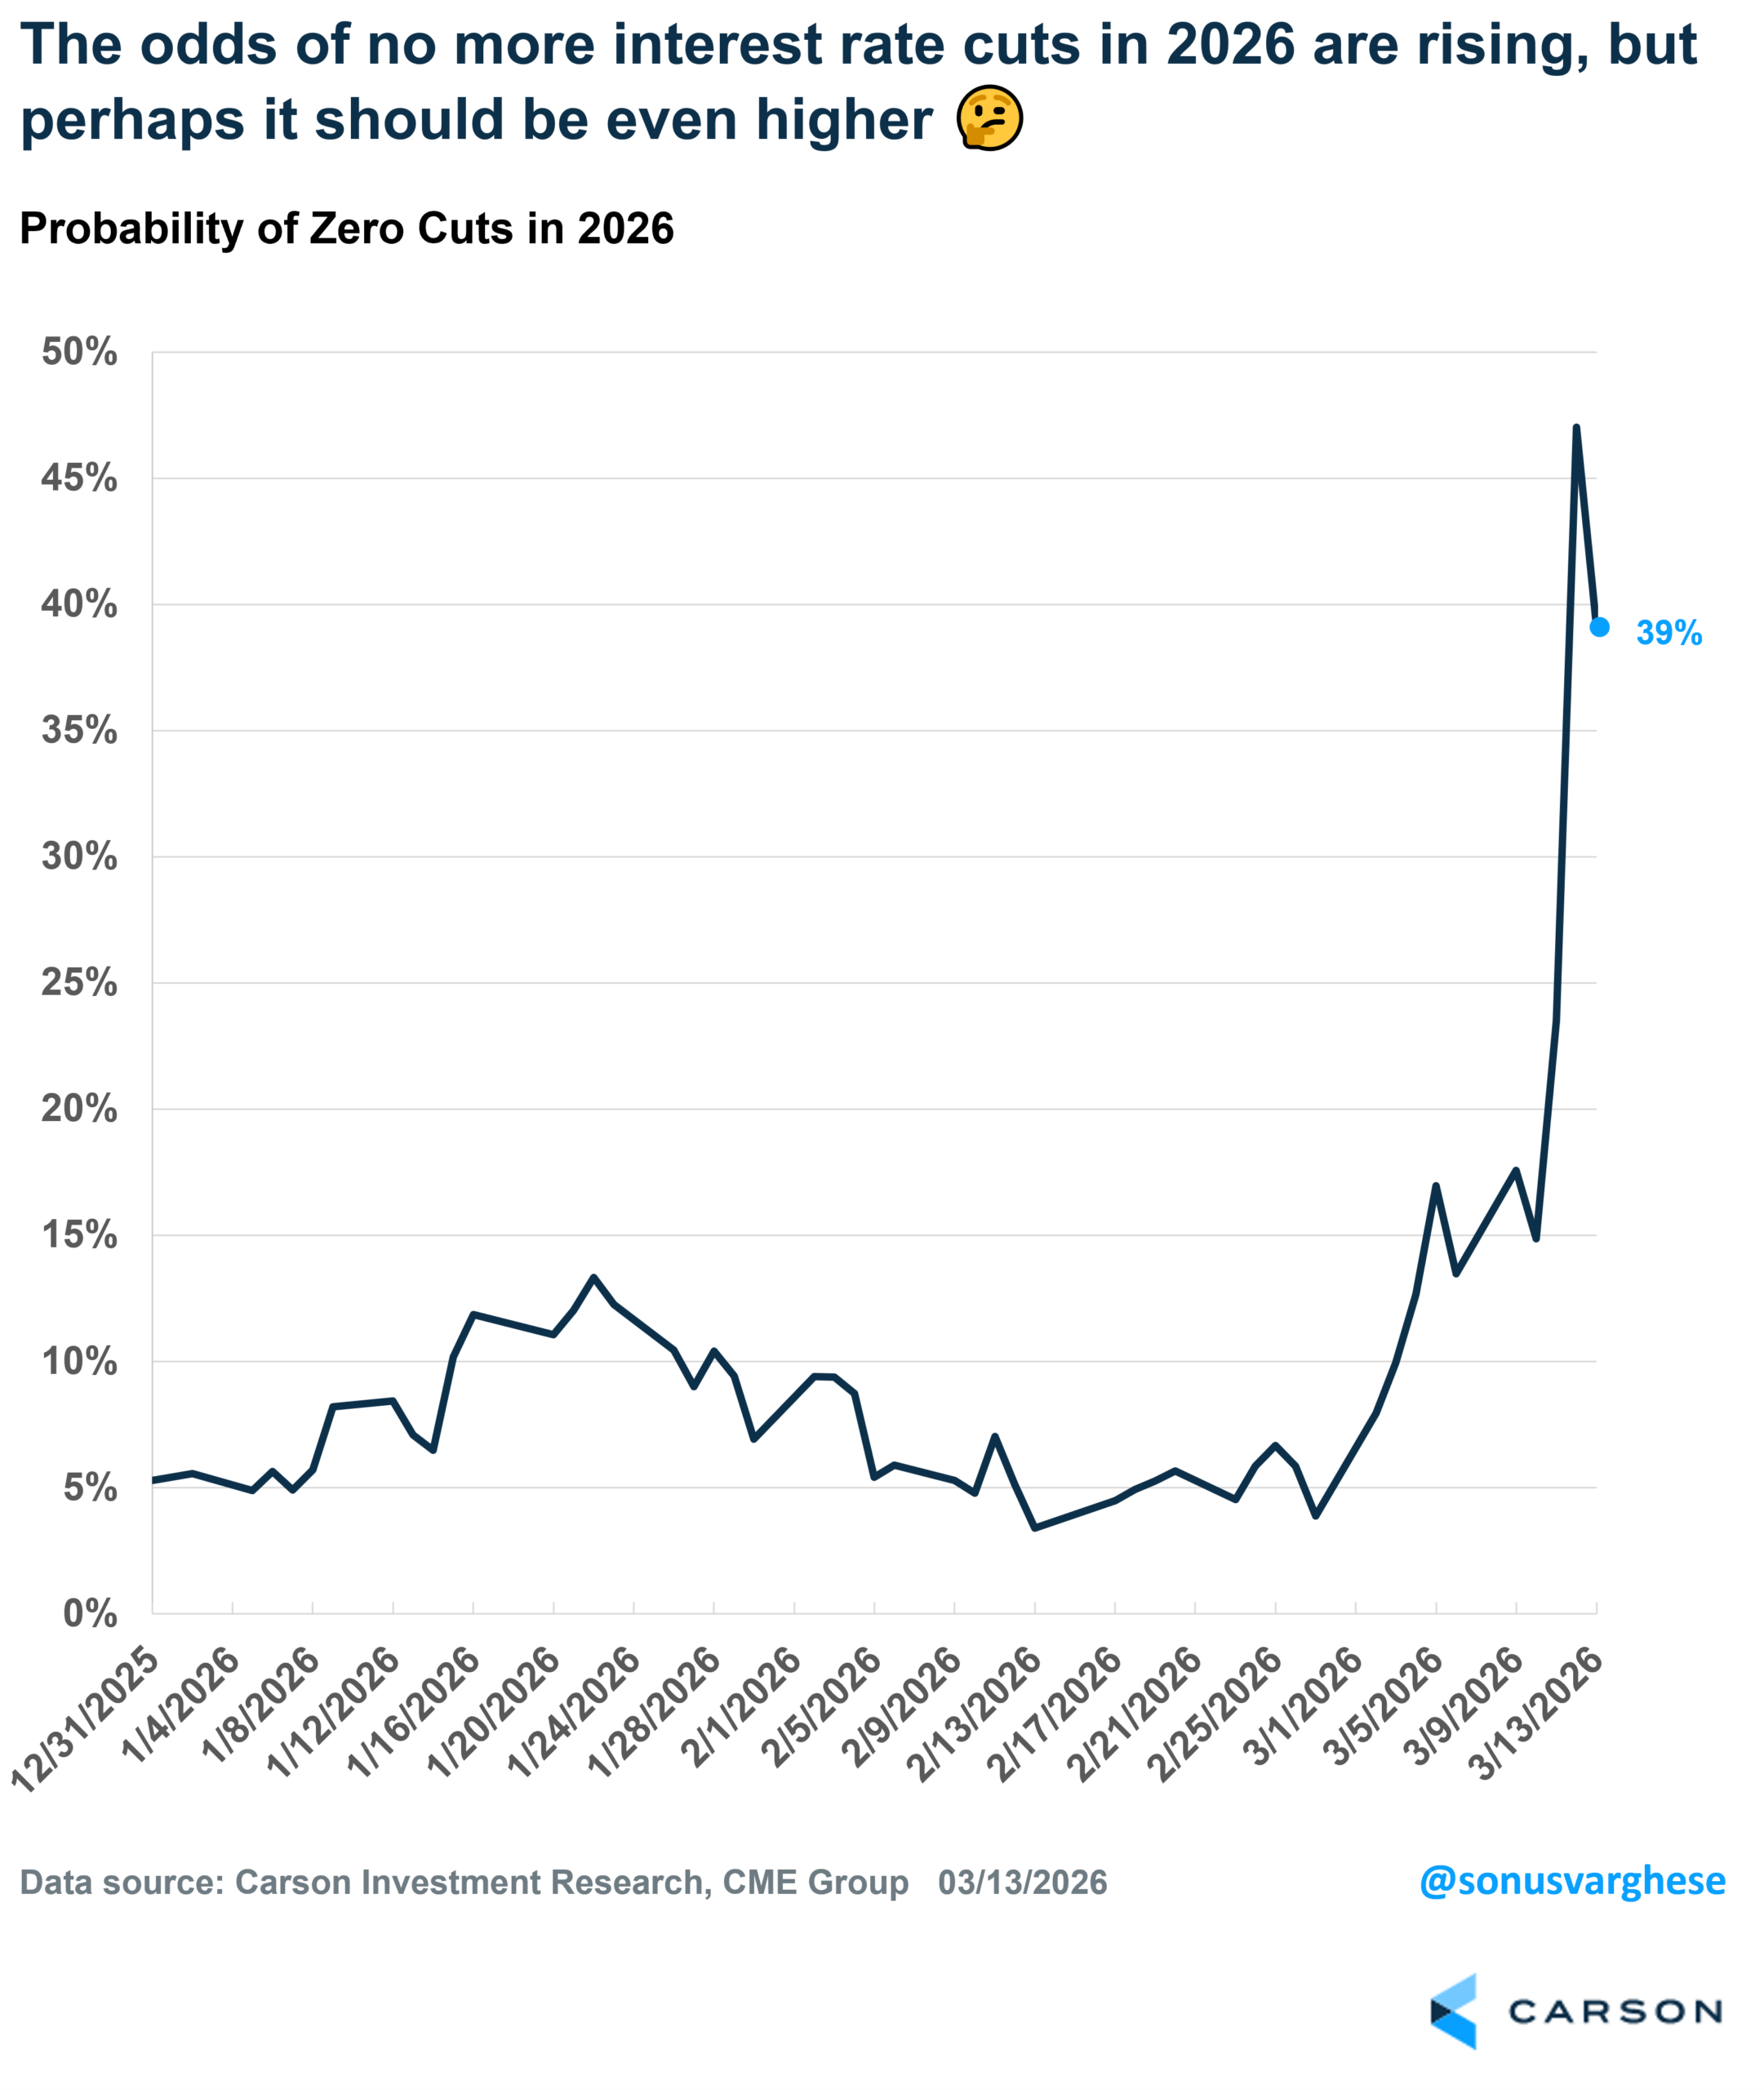
As I pointed out above, the inflation picture wasn’t pretty even prior to the crisis. Just based on that, the odds of any further interest rate cuts by the Fed this year would be much lower. The markets are coming around to this outlook as well. The probability of no more cuts in 2026, based on fed funds futures, was less than 5% just before the crisis started (on 2/27), i.e. the market was pricing in 95%+ probability that the Fed would cut at least one more time this year. That’s shifted a lot, and right now markets are pricing in a 39% probability that the Fed will not cut rates this year. That still implies the market believes odds favor at least one more cut, but the inflation picture says otherwise.
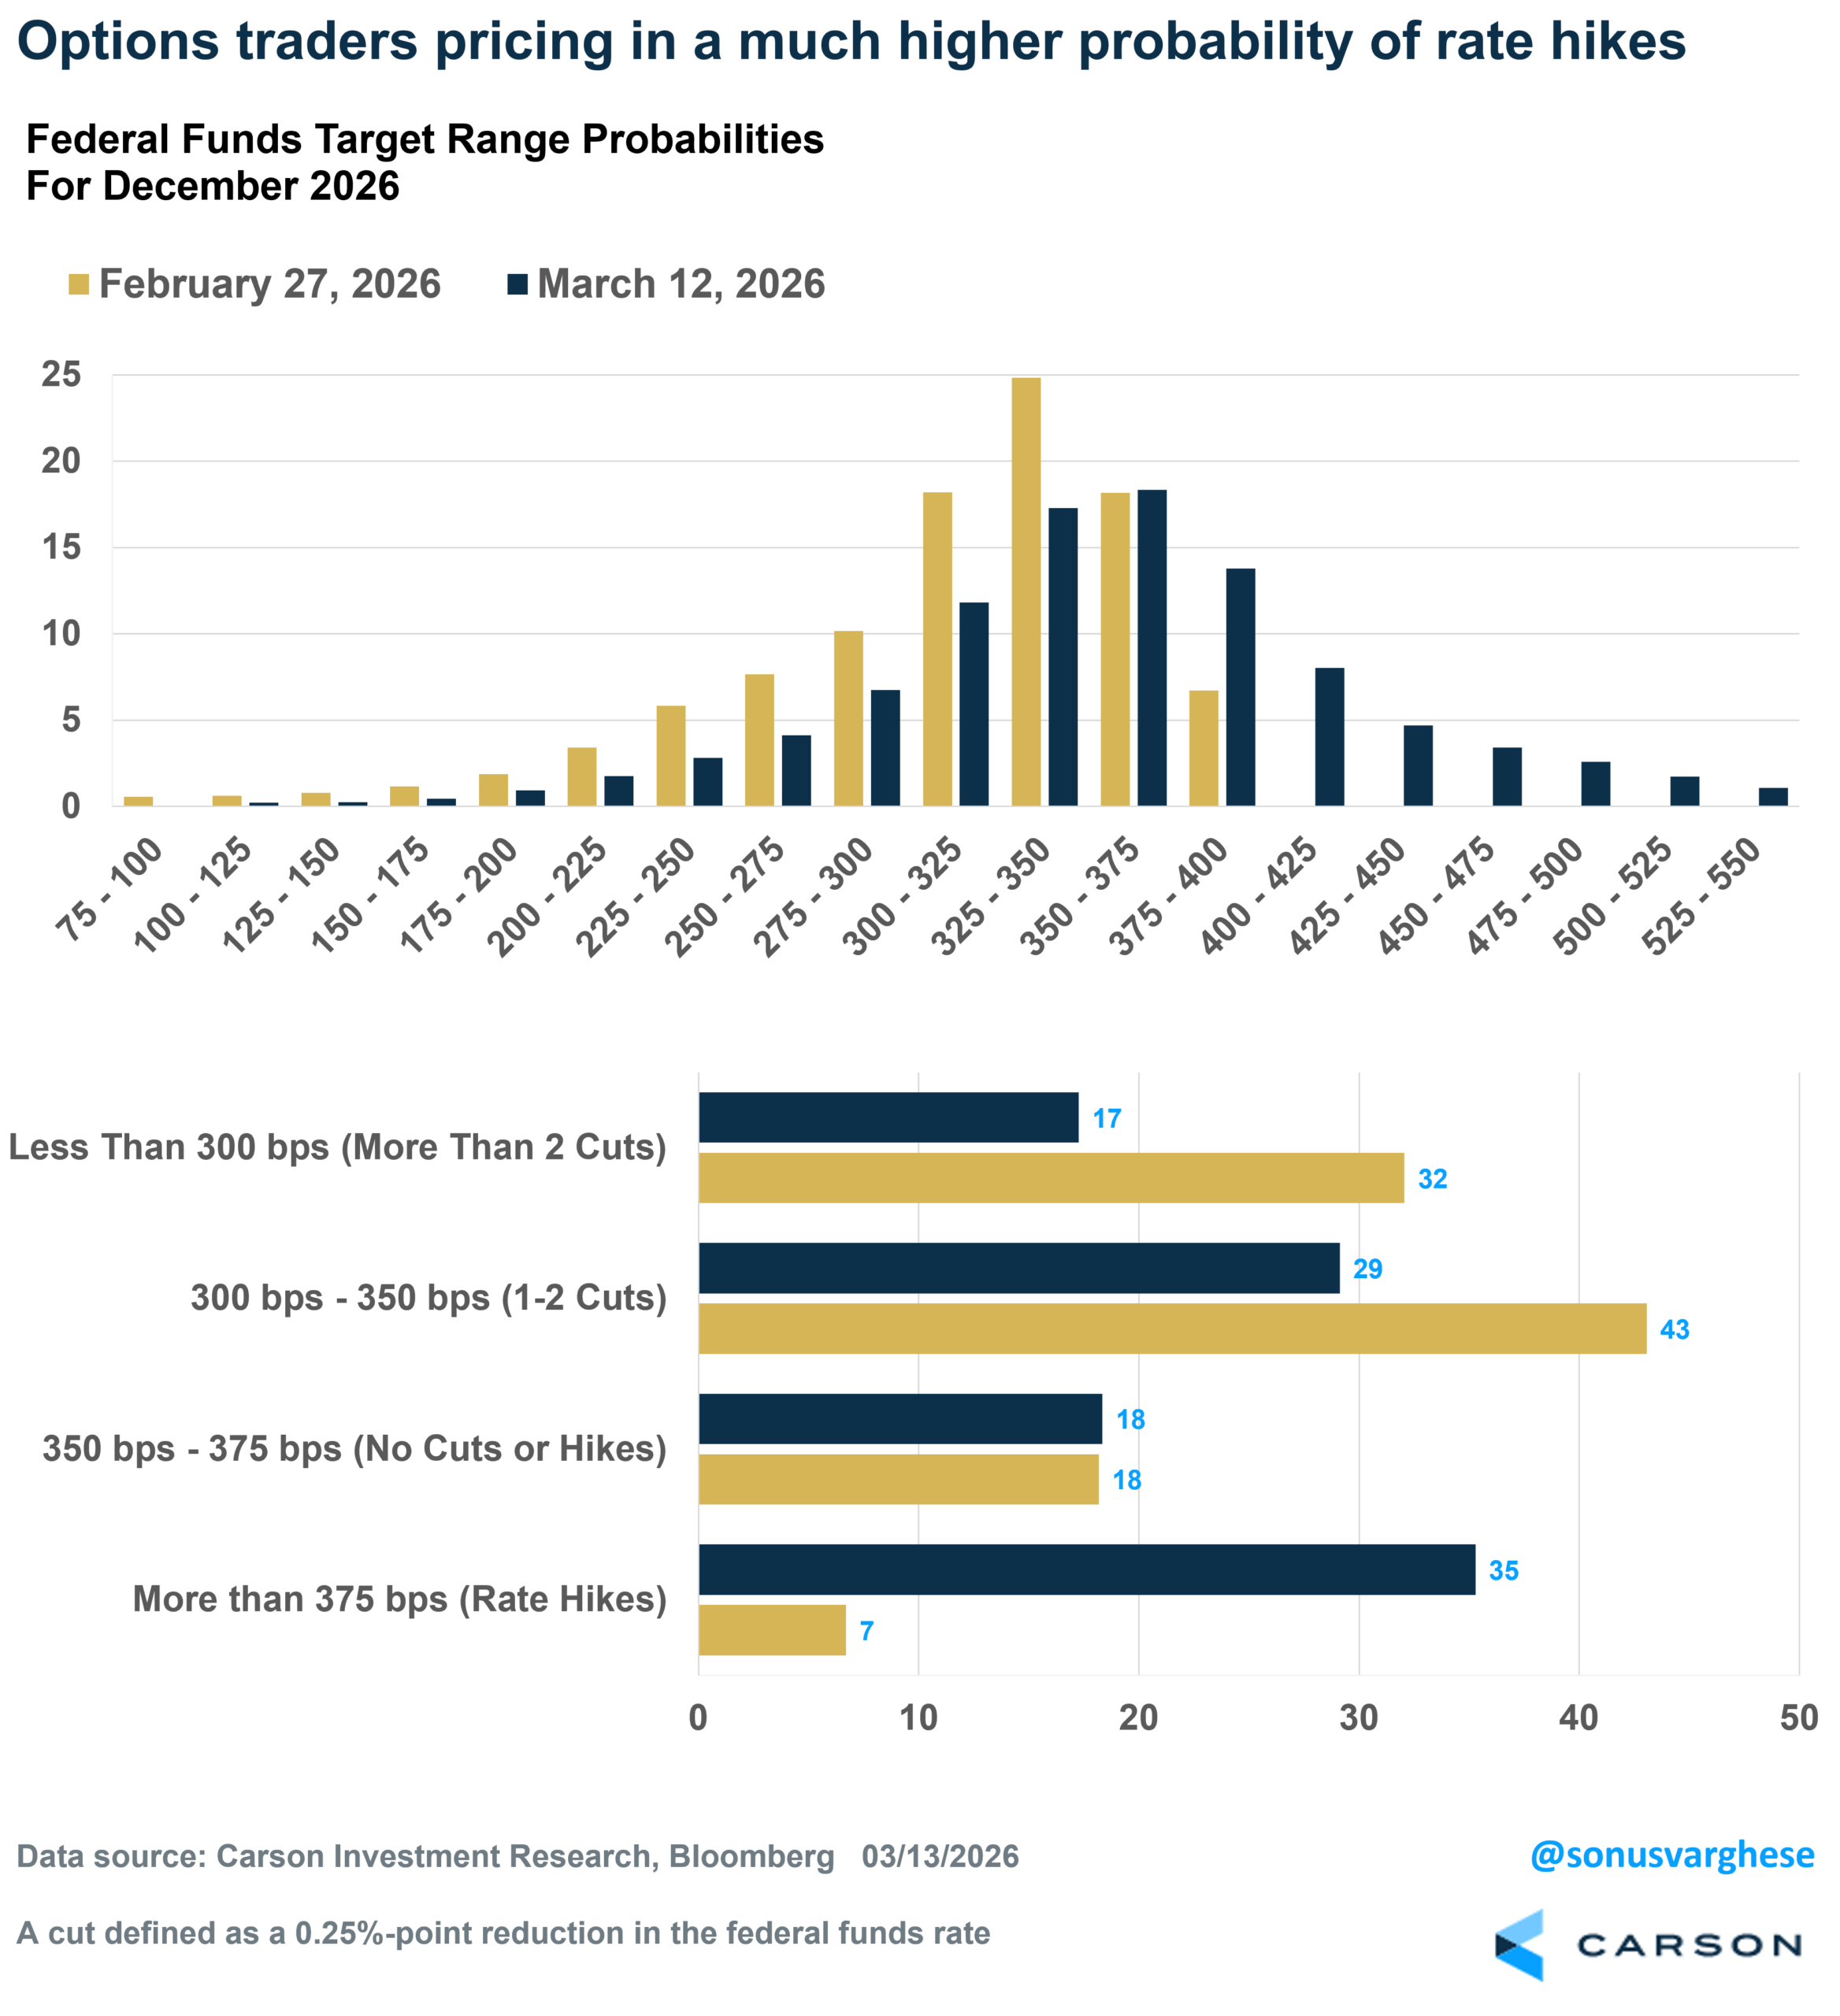
Options market traders are actually able to bet on more specific outcomes related to the Fed’s target policy rate, and that’s helpful because it gives us a better picture of the full distribution of what market participants are thinking (and putting their money on). There’s been a significant shift here as well. Prior to the crisis (2/27), options markets implied just a 7% probability of no rate hikes in 2026. That’s now increased to 35%.
Here’s a line Fed Chair Jerome Powell has repeatedly said since the inflation surge in 2022:
“Restoring price stability is a necessary prerequisite to achieving maximum, sustainable employment.”
We have anything but price stability now, and the outlook doesn’t look great. Don’t be surprised if the Fed starts talking about the possibility of raising interest rates sooner rather than later. Even the minutes of the Fed’s January meeting show some Fed members opening up to the topic as “several participants indicated that they would have supported a two-sided description of the Committee’s future interest rate decisions, reflecting the possibility that upward adjustments to the target range for the federal funds rate could be appropriate if inflation remains at above-target levels.” That was before the current conflict started and energy prices surged.
In our 2026 Outlook: Riding the Wave, we talked about several factors that gave the economy a cushion against potential economic shocks in 2026. Lower Interest rates were just one of them. Others included fiscal stimulus, strong business and household balance sheets, the ongoing AI buildout, and strong earnings momentum. Losing one of them (if we’re not talking actual rate hikes) raises risks but does not materially change the picture, although it may shift likely winners and losers. (Bonds look worse right now than they did at the start of the year, as do international stocks, which are more vulnerable to an oil supply shock, although both changes depend on how long the conflict lasts.) Nevertheless, the US and global economy are more fragile than they were in 2022 or even 2024, and the US is already dealing with modest shocks from tariffs and flat job growth over the last 10 months. The key factor, from a market perspective, is how long the conflict lasts, how much damage is done to oil infrastructure in the process, and how long the Strait of Hormuz remains closed. For now, we’re still watching for a resolution in weeks rather than months, but effects will be stickier the longer the conflict lasts.
For more content by Sonu Varghese, Chief Macro Strategist, click here.
8826784.1. – 17MAR26A
