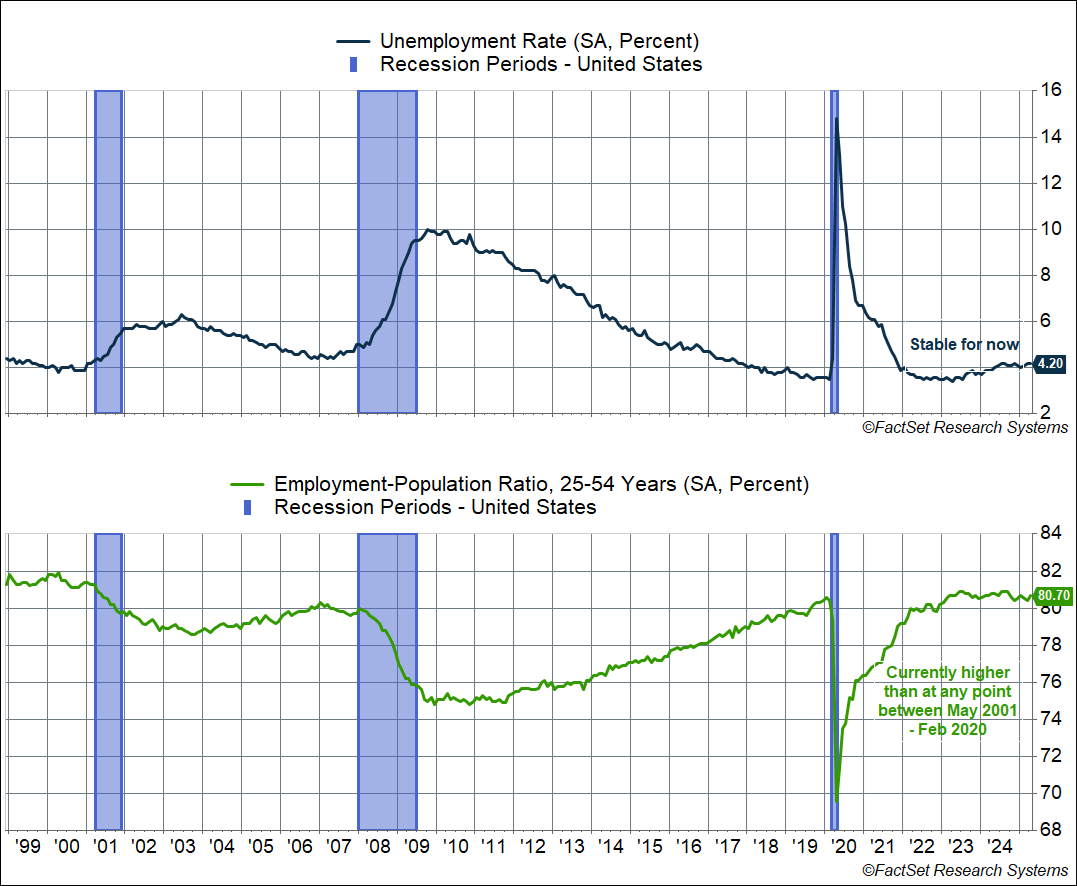
The economy created 177,000 jobs in April, above expectations for 138,000 jobs. At the same time, this number can be revised quite a lot. (Job creation in February and March were revised down by a combined 58,000.) This is why the 3-month average is more useful, and right now that’s at 155,000. That’s not great, but not too bad either since it’s likely more than enough to keep up with population growth (especially since immigration has fallen). It’s also why the unemployment rate remained unchanged at 4.2%. Slightly more positive is the fact that the prime-age (25-54) employment-population ratio rose to 80.7%, higher than at any point between 2001 and 2019, and not too far below the recent peak of 80.9%.
If you were expecting Liberation Day to result in a poor payroll report in April, this was not it. And that should not have been the expectation either, since the data for this report was taken in the second week of April – before any impact from the more extreme tariffs on China.
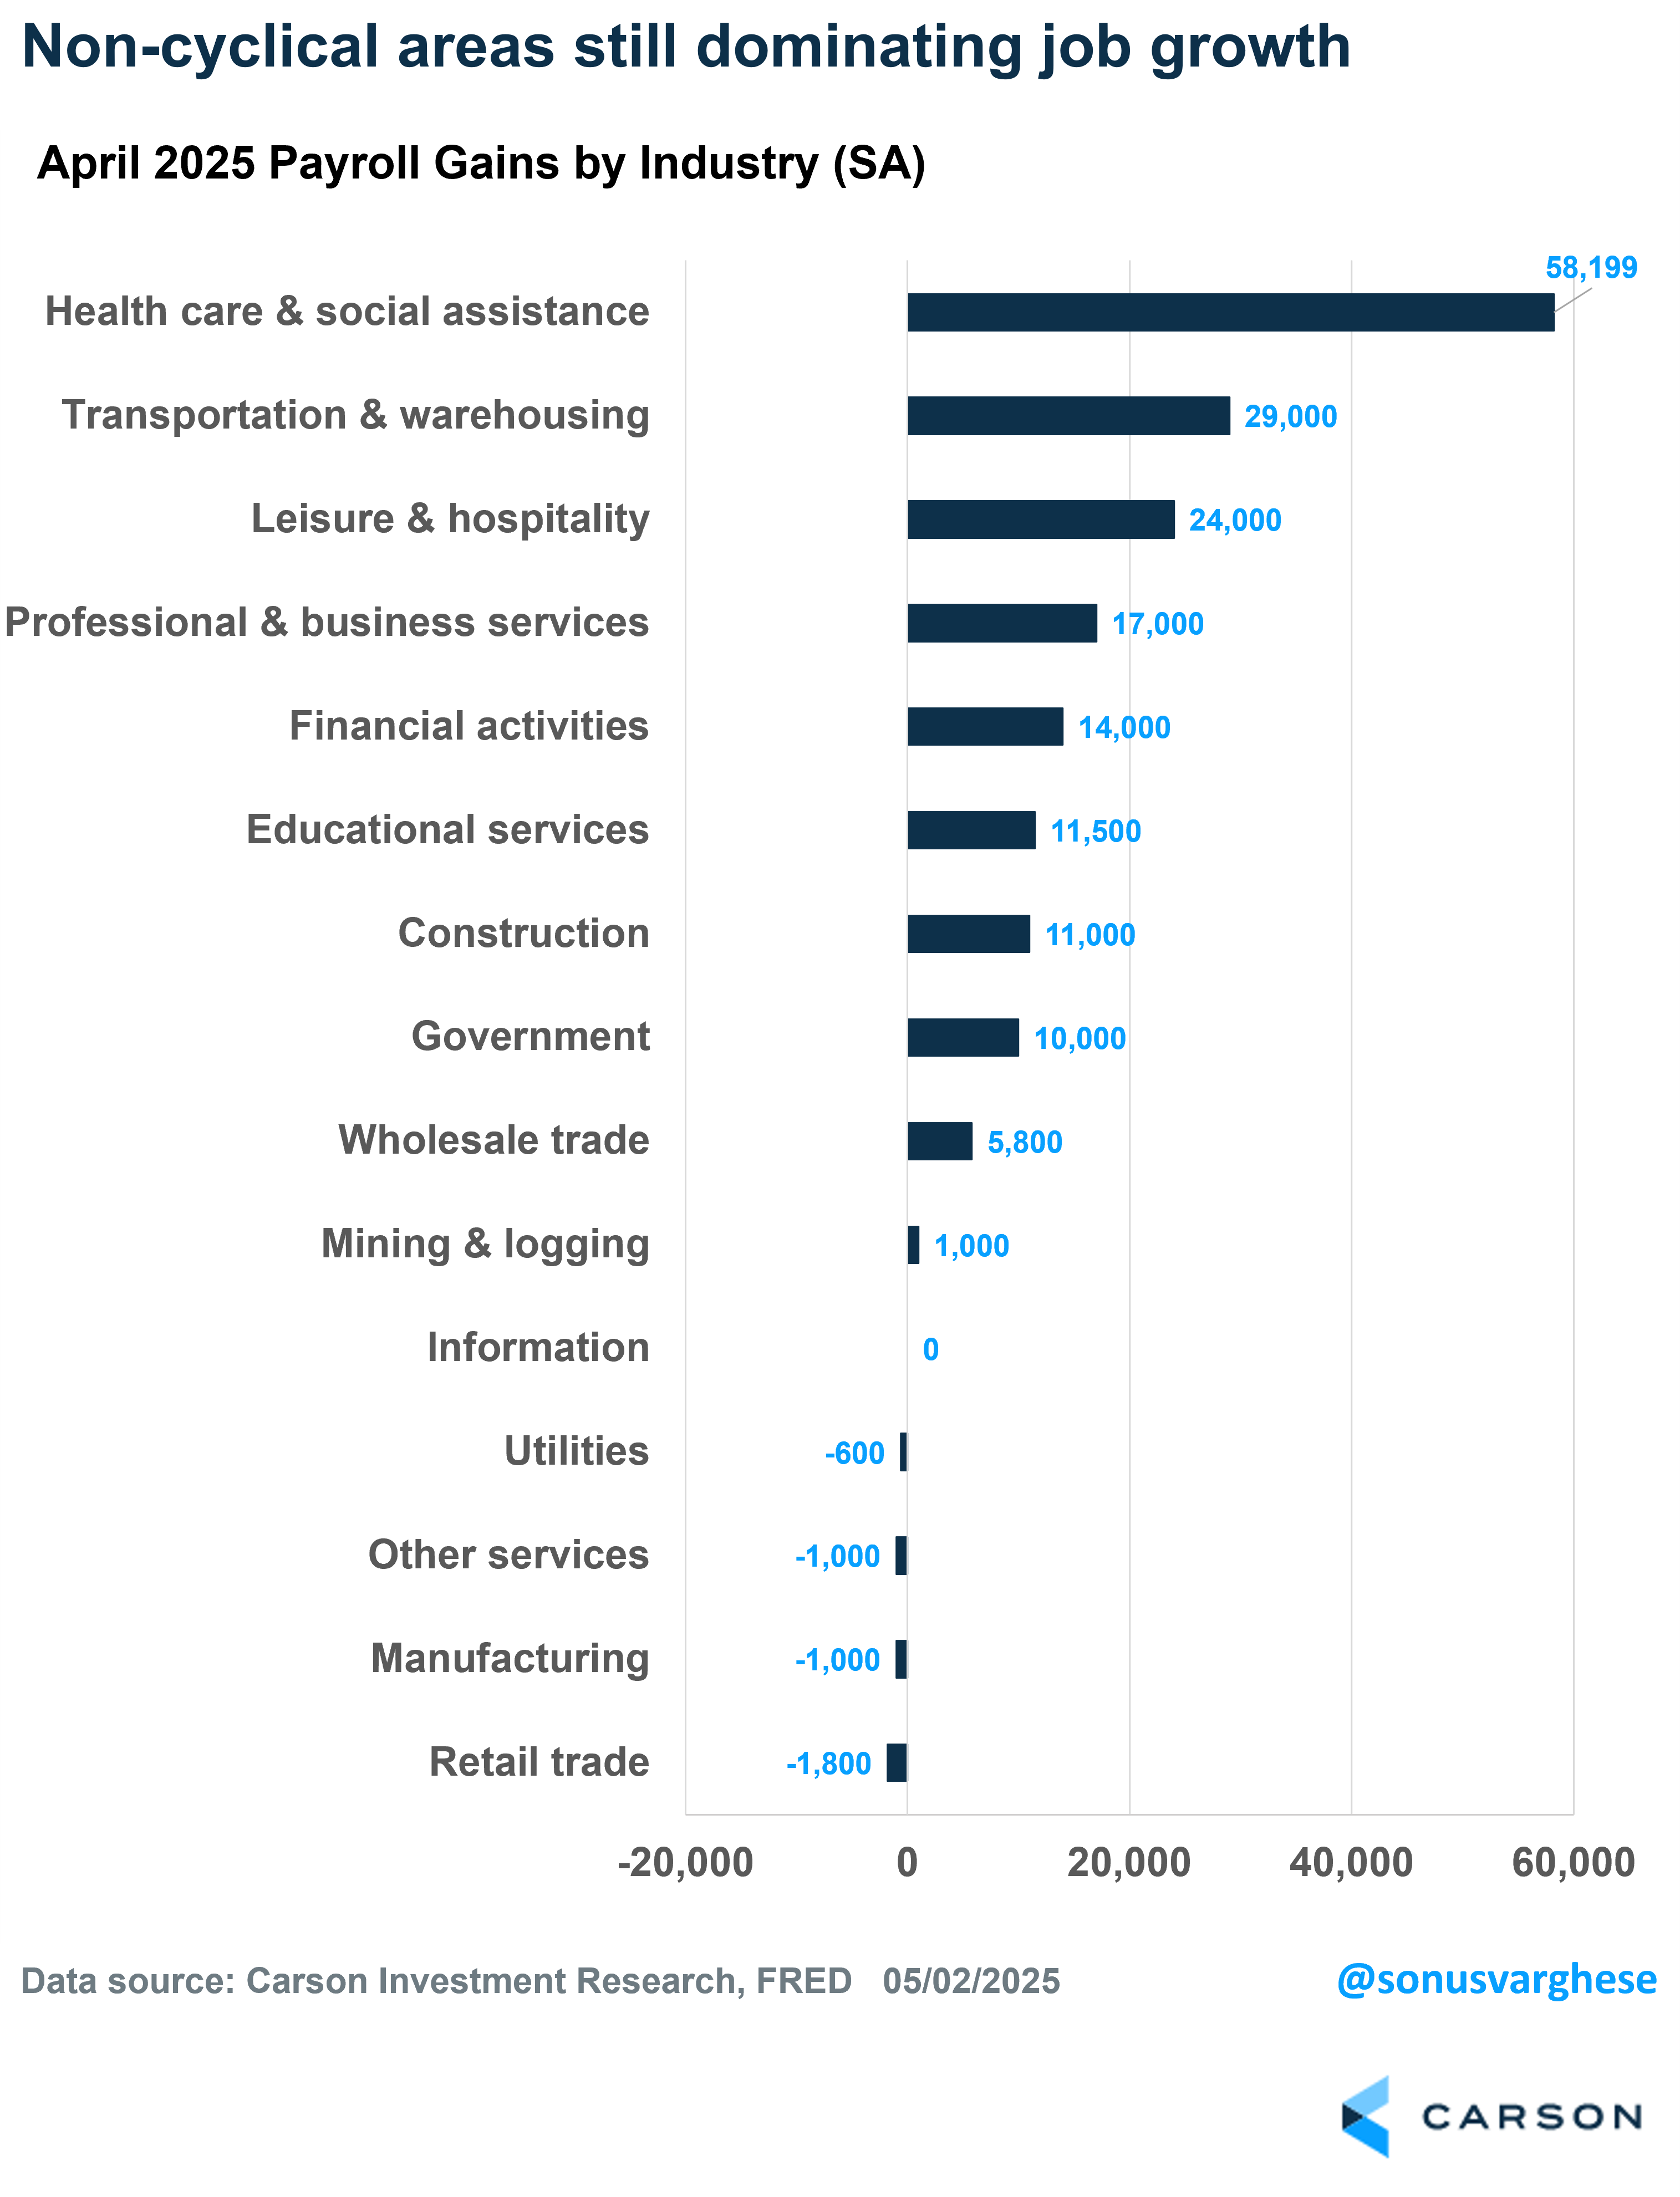
At the same, the details of the report show that job creation continues to be dominated by the non-cyclical areas of the economy. Health care and social assistance, private education, and government created 80,000 of the jobs in April (45%). Cyclical areas like construction, manufacturing, and professional and business services added just 27,000 (15%). This continues the theme of what we’ve seen over the last 6 – 12 months, with cyclical areas on the weaker side and job creation driven by non-cyclical areas of the economy (greater than 50% over the last six months).
The cyclical areas of the economy, whether manufacturing or housing, are not being helped by elevated interest rates. In our Outlook 2025, one of the key risks we highlighted was high interest rates (in addition to the threat of tariffs). And now it looks like we may have to live with high interest rates for longer.
The Fed Is Likely To Stay on Pause
The Federal Reserve (Fed) is meeting on May 6-7, and this report completely shuts the door on any possibility of a rate cut at that meeting. Markets weren’t expecting a cut anyway, despite a big push from the White House. However, markets are pricing in a rate cut in June, and three more beyond that before the year is out. This seems overly optimistic given where the labor market is right now. Add to that the expected upward pressure on inflation from tariffs, which is probably not going to show up at least until the third quarter, and the Fed may very well be on pause until September.
I’ve noted before that there is uncertainty related to the tariff situation, since we have no idea what the end game is. But what it certainly does do in the near term is that it keeps the Fed on hold because of inflation uncertainty.
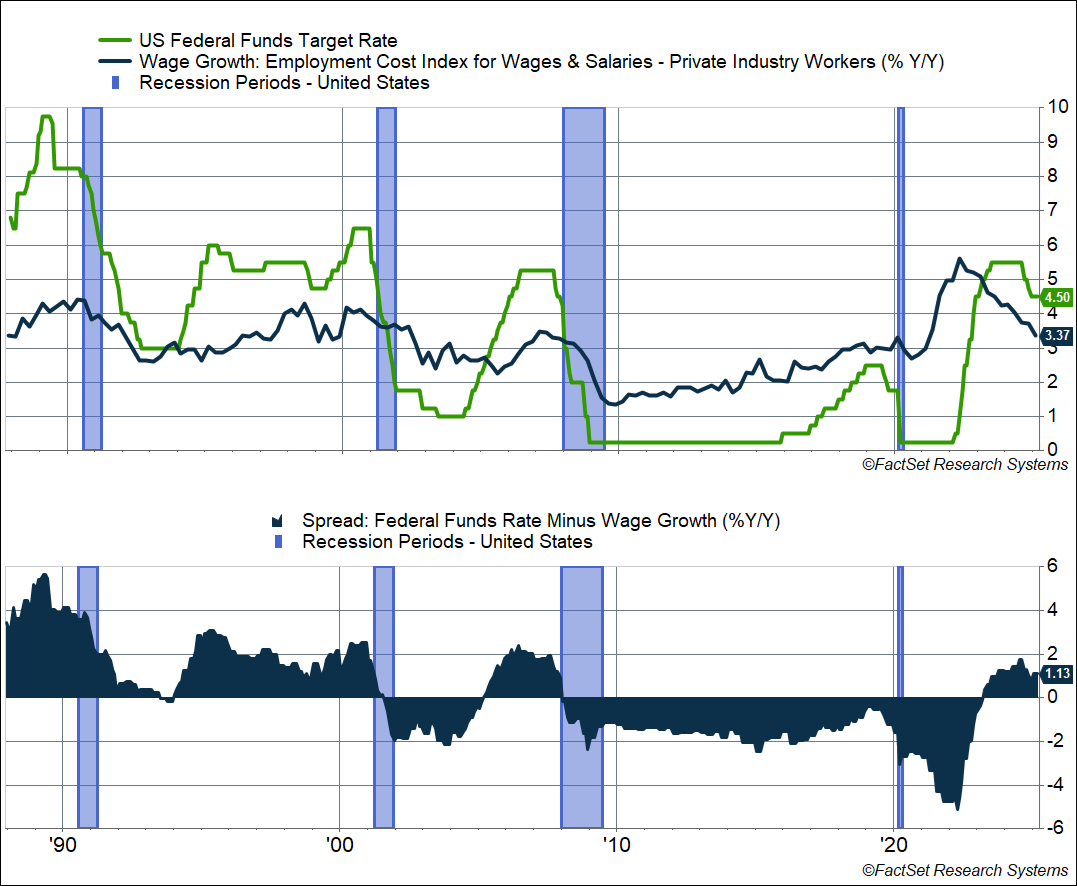
Make no mistake, the status quo of the Fed staying on pause means policy is actually getting tighter and pushing a further slowdown in the economy. The Employment Cost Index for the first quarter (Q1) showed private sector wages and salaries are up 3.4% from last year, well below the Fed’s policy rate of 4.25-4.5%. Wage growth has been on a downtrend over the past year, and if the Fed pauses here that means policy is getting tighter. Historically, the fed funds rate rising well above the pace of wages, i.e. increasingly tight monetary policy, has constricted the economy and ultimately these situations ended up in recessions.
Here’s an example: if mortgage rates are 7% but wage growth is slowing from near 5% to almost 3%, that means home affordability is getting worse and households will step back from buying homes, which in turn hits the housing industry.
There’s a reason why Treasury Secretary Bessent wants lower interest rates (not to mention President Trump), arguing that it’ll benefit “Main Street.” Until a month ago, they didn’t seem too concerned with a slower economy, since interest rates would arguably fall in that scenario. The problem is that tariff policy is pushing the Fed in exactly the opposite direction. Also, with respect to a slower economy, be careful what you wish for because things can turn on a dime and stay that way for a long time. Which brings us to the Q1 GDP.
A Messy, Muddy, Noisy GDP Report
Real GDP growth clocked in at a -0.3% annualized pace in Q1, slightly below expectations for a -0.2% reading. Keep in mind that this is just the first estimate, and this number is likely to go through significant revisions. Still, this was especially notable because it’s the first negative reading for real GDP growth in three years (since Q1 2022). Over the last two years (2023 – 2024), real GDP growth clocked in at an annualized pace of 2.9%. So this is a significant slowdown.
At the same time, this was an extremely messy GDP growth reading.
The chart below shows a breakdown of the components, how they contributed to the headline figure, and their respective quarterly growth rate (annualized). As you can see the big drag is from net exports, which pulled GDP lower by a whopping 4.8 percentage points. This was mostly because imports surged by almost 51% in Q1, as households and businesses began front-running tariffs.
However, I want to be careful here — it’s a little misleading to say imports drag from GDP. GDP is domestic production (measured by sales), and something that is imported does not count toward domestic production. For example, consumers bought a lot of footwear and clothing while businesses spent a lot on equipment (IT equipment spending surged by 22.5%) and a lot of it was clearly imported, so it’s counted in the consumption and investment data, but it shouldn’t. So netting out imports is the “easiest” way to make sure imports don’t count toward domestic product.
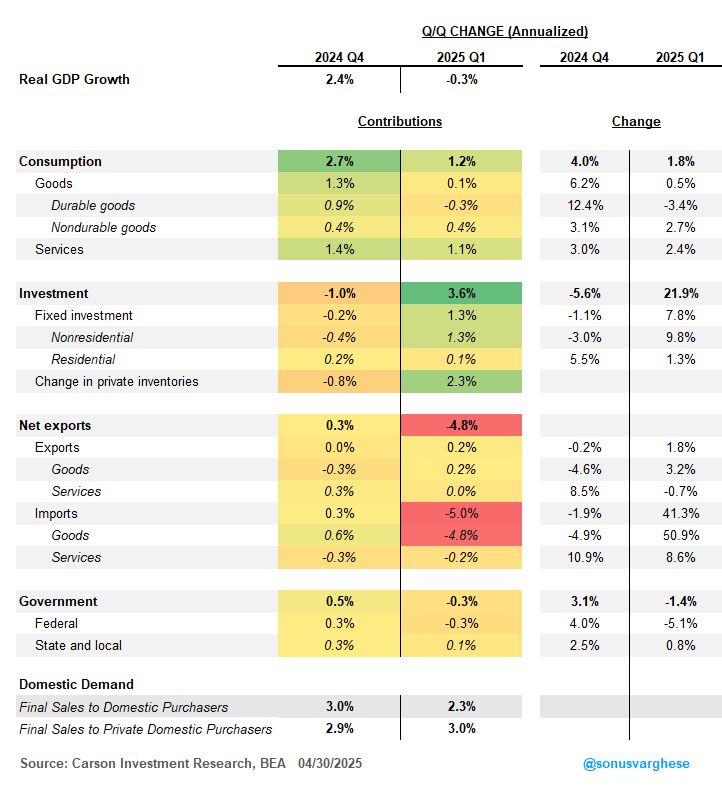
A big chunk of imports went towards inventory buildup, and as you can see above, change in private inventories was the single largest contributor to GDP growth, 2.3 percentage points (before netting out imports). It was the largest increase since 2021 Q4.
Of course, this is likely to shift in Q2. In fact, for GDP growth, it’s actually “change in private inventories” that matter. So even if inventories continue to rise in Q2, for example, if companies rush to buy more goods before the end of the 90-day tariff pause, if it doesn’t rise as much as it did in Q1, inventories will drag from GDP growth.
So, there’s a reasonable chance that GDP growth in Q2 may also be negative. It’ll also depend on how much imports collapse, and consumers and businesses switch to US-made goods. If imports collapse, we could see the reverse of what happened in Q1, with net exports adding to GDP growth in a big way (unless exports also collapse).
The long and short of this is this: GDP readings over the next quarter or two are likely to be very volatile. And even revisions to Q1 GDP.
Usually, the best way to gauge underlying economic strength is to look at “real final sales to domestic purchasers” (final demand). This measure strips out the volatile net exports and inventories components of GDP, and just isolates household, business, and government spending. This is something I’ve highlighted over the last three years when net exports and inventories were especially volatile. Here’s the good news
- Final demand rose 2.3% in Q1 versus 3.2% in 2023-2024 and 2.7% in 2018-2019.
- Final private demand (ex government) rose 3.0% in Q1 versus 3.1% in 2023-2024 and 2.6% in 2018-2019.
The private demand reading is especially strong and on the face of it, a big positive.
However, the problem is that it includes the big surge in IT equipment spending on the business side and increased spending on things like clothing and footwear on the household side — most of which were likely imported.
In other words, the Q1 readings of final demand are noisy, and it shouldn’t completely be taken at face value. At the same time, it does tell you that demand didn’t collapse in Q1 — economic activity slowed down, but we didn’t see anything close to a recession. Especially when you look at the underlying details.
Investment Surges, But It’s Messy
Non-residential investment (business investment) jumped almost 10% in Q1, but this was almost entirely driven by a 22.5% surge in equipment spending. And almost all of it was IT equipment spending. Some of this is probably attributable to AI spending (like data warehouses), but the size of the increase suggests this was tariff front-running. Which means we shouldn’t expect it to continue in Q2.
Another category that likely saw a boost due to IT spending was intellectual property investment, which rose 4.1%. Almost all of it was software investment.
This tells you that AI spending was finally starting to show up in the GDP data, but it’s now completely lost in the noise due to tariffs, making it hard to parse through what’s actually happening, let alone how much it matters now.
Housing (residential investment) was not a drag on GDP, but that’s small cause for comfort when housing activity is being pulled down by the weight of elevated interest rates. A strong economy would coincide with strong housing activity, but that’s not what we have now.
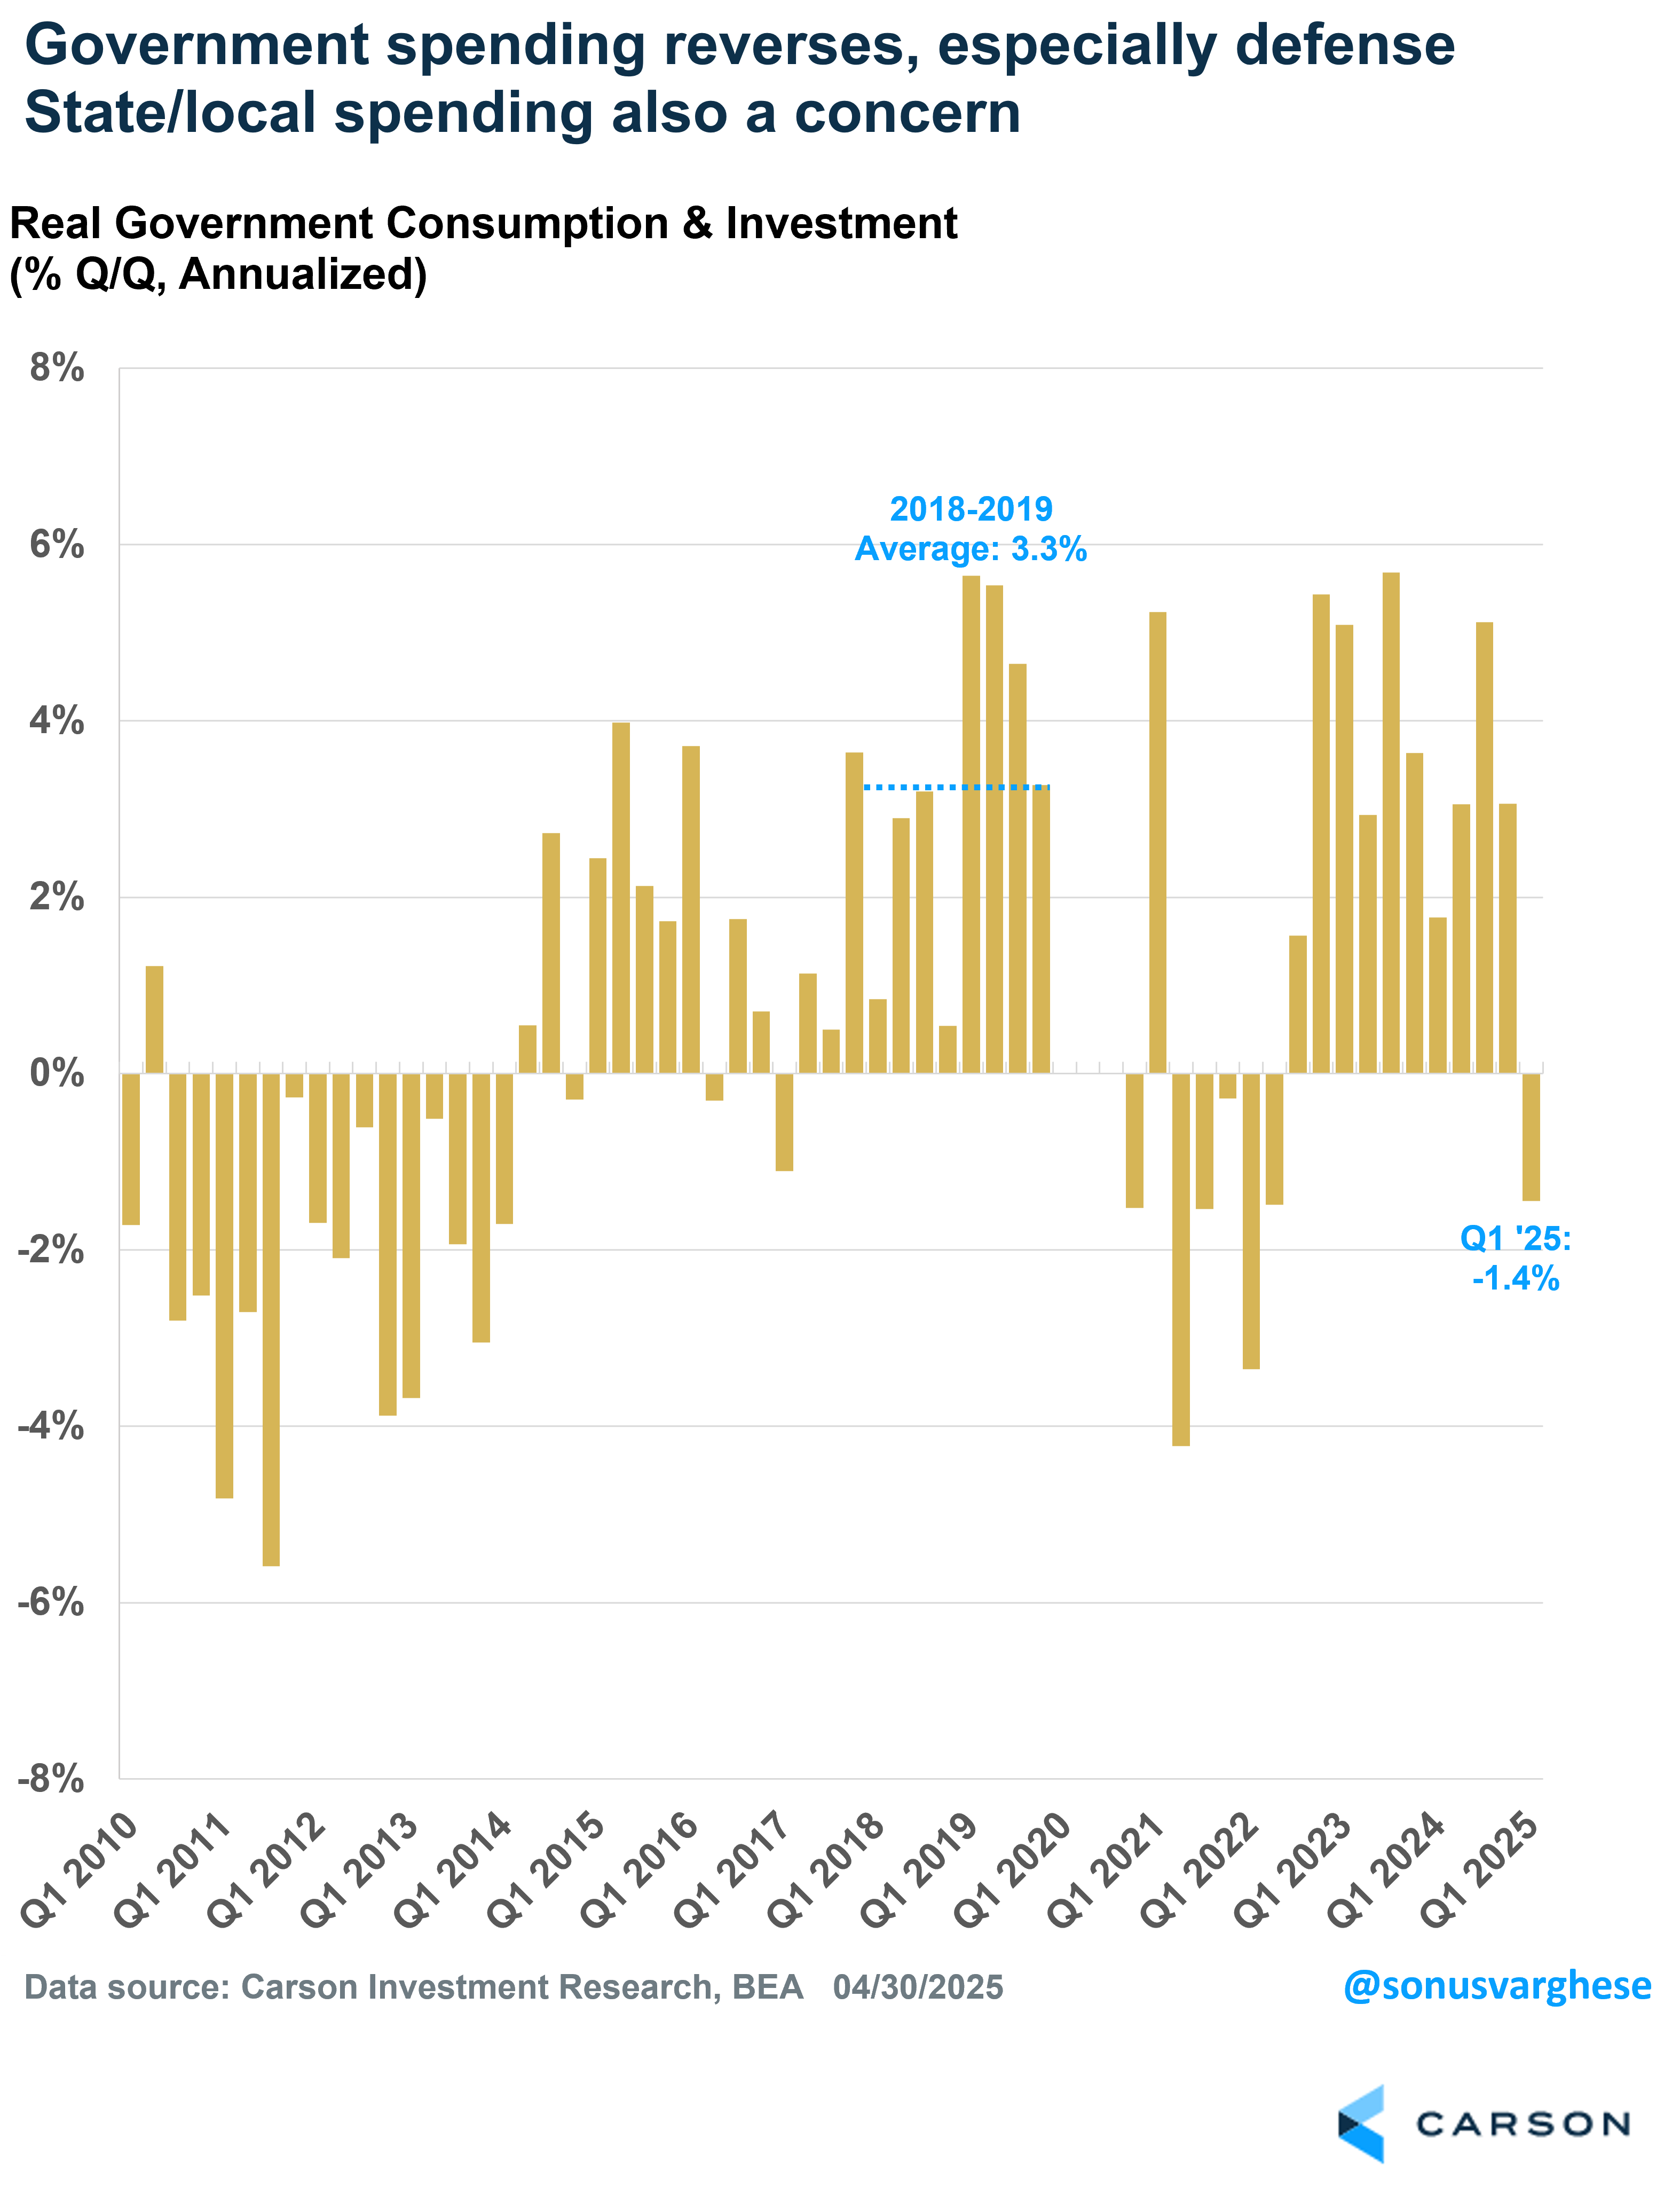
Government Spending Pulled Back, But Probably Not Where You Think
Government spending dragged from GDP growth for the first time since Q2 2022. This was entirely driven by a 5.1% decline in federal government spending but rather surprisingly, this was because defense spending fell 8% in Q1. Nondefense spending also pulled back, but just by 1%.
More worryingly, state and local government spending pulled back in a big way, rising just 0.8% in Q1. This is not entirely surprising because state and local governments are running out of the Covid surplus they had, and if consumption and investment are pulling lower, tax revenues are likely lower.
State/local government spending is almost twice the size of federal spending (11% of GDP versus 6% of GDP) and so the slowdown is concerning. Over the last two years, overall government spending rose at an annualized pace of 3.8%, mostly driven by state and local governments. In fact, this was a big reason why a recession was avoided in 2022 and why the economy grew almost 3% over the last two years (along with strong services spending).
Note that government spending was strong even in 2018-2019 (during Trump’s first term), when it averaged an annualized pace of 3.3%.
Consumption Eases, But It’s Muddy
Household consumption rose just 1.8% in Q1, which is the slowest pace since Q2 2023. However, a big reason for the pullback was a sharp drop in durable goods spending, which fell 3.4% (versus 12.4% in Q4). That was driven by lower auto sales in January and February, mostly because of bad weather. We did see a big recovery in March but not enough to stem the drop, and it’s also likely the March increase was also due to consumers trying to front-run tariffs. Which means we may not see a huge pickup in auto sales in Q2.
The good news is that services spending rose a solid 2.4%, however, it is a significant slowdown from the annualized pace of 2.9% over the past two years. A 2.4% growth rate for services spending is not bad on an absolute basis, and it’s higher than the pre-pandemic pace of 1.8% (2010-2019), but it’s concerning if this is the beginning of a downtrend.
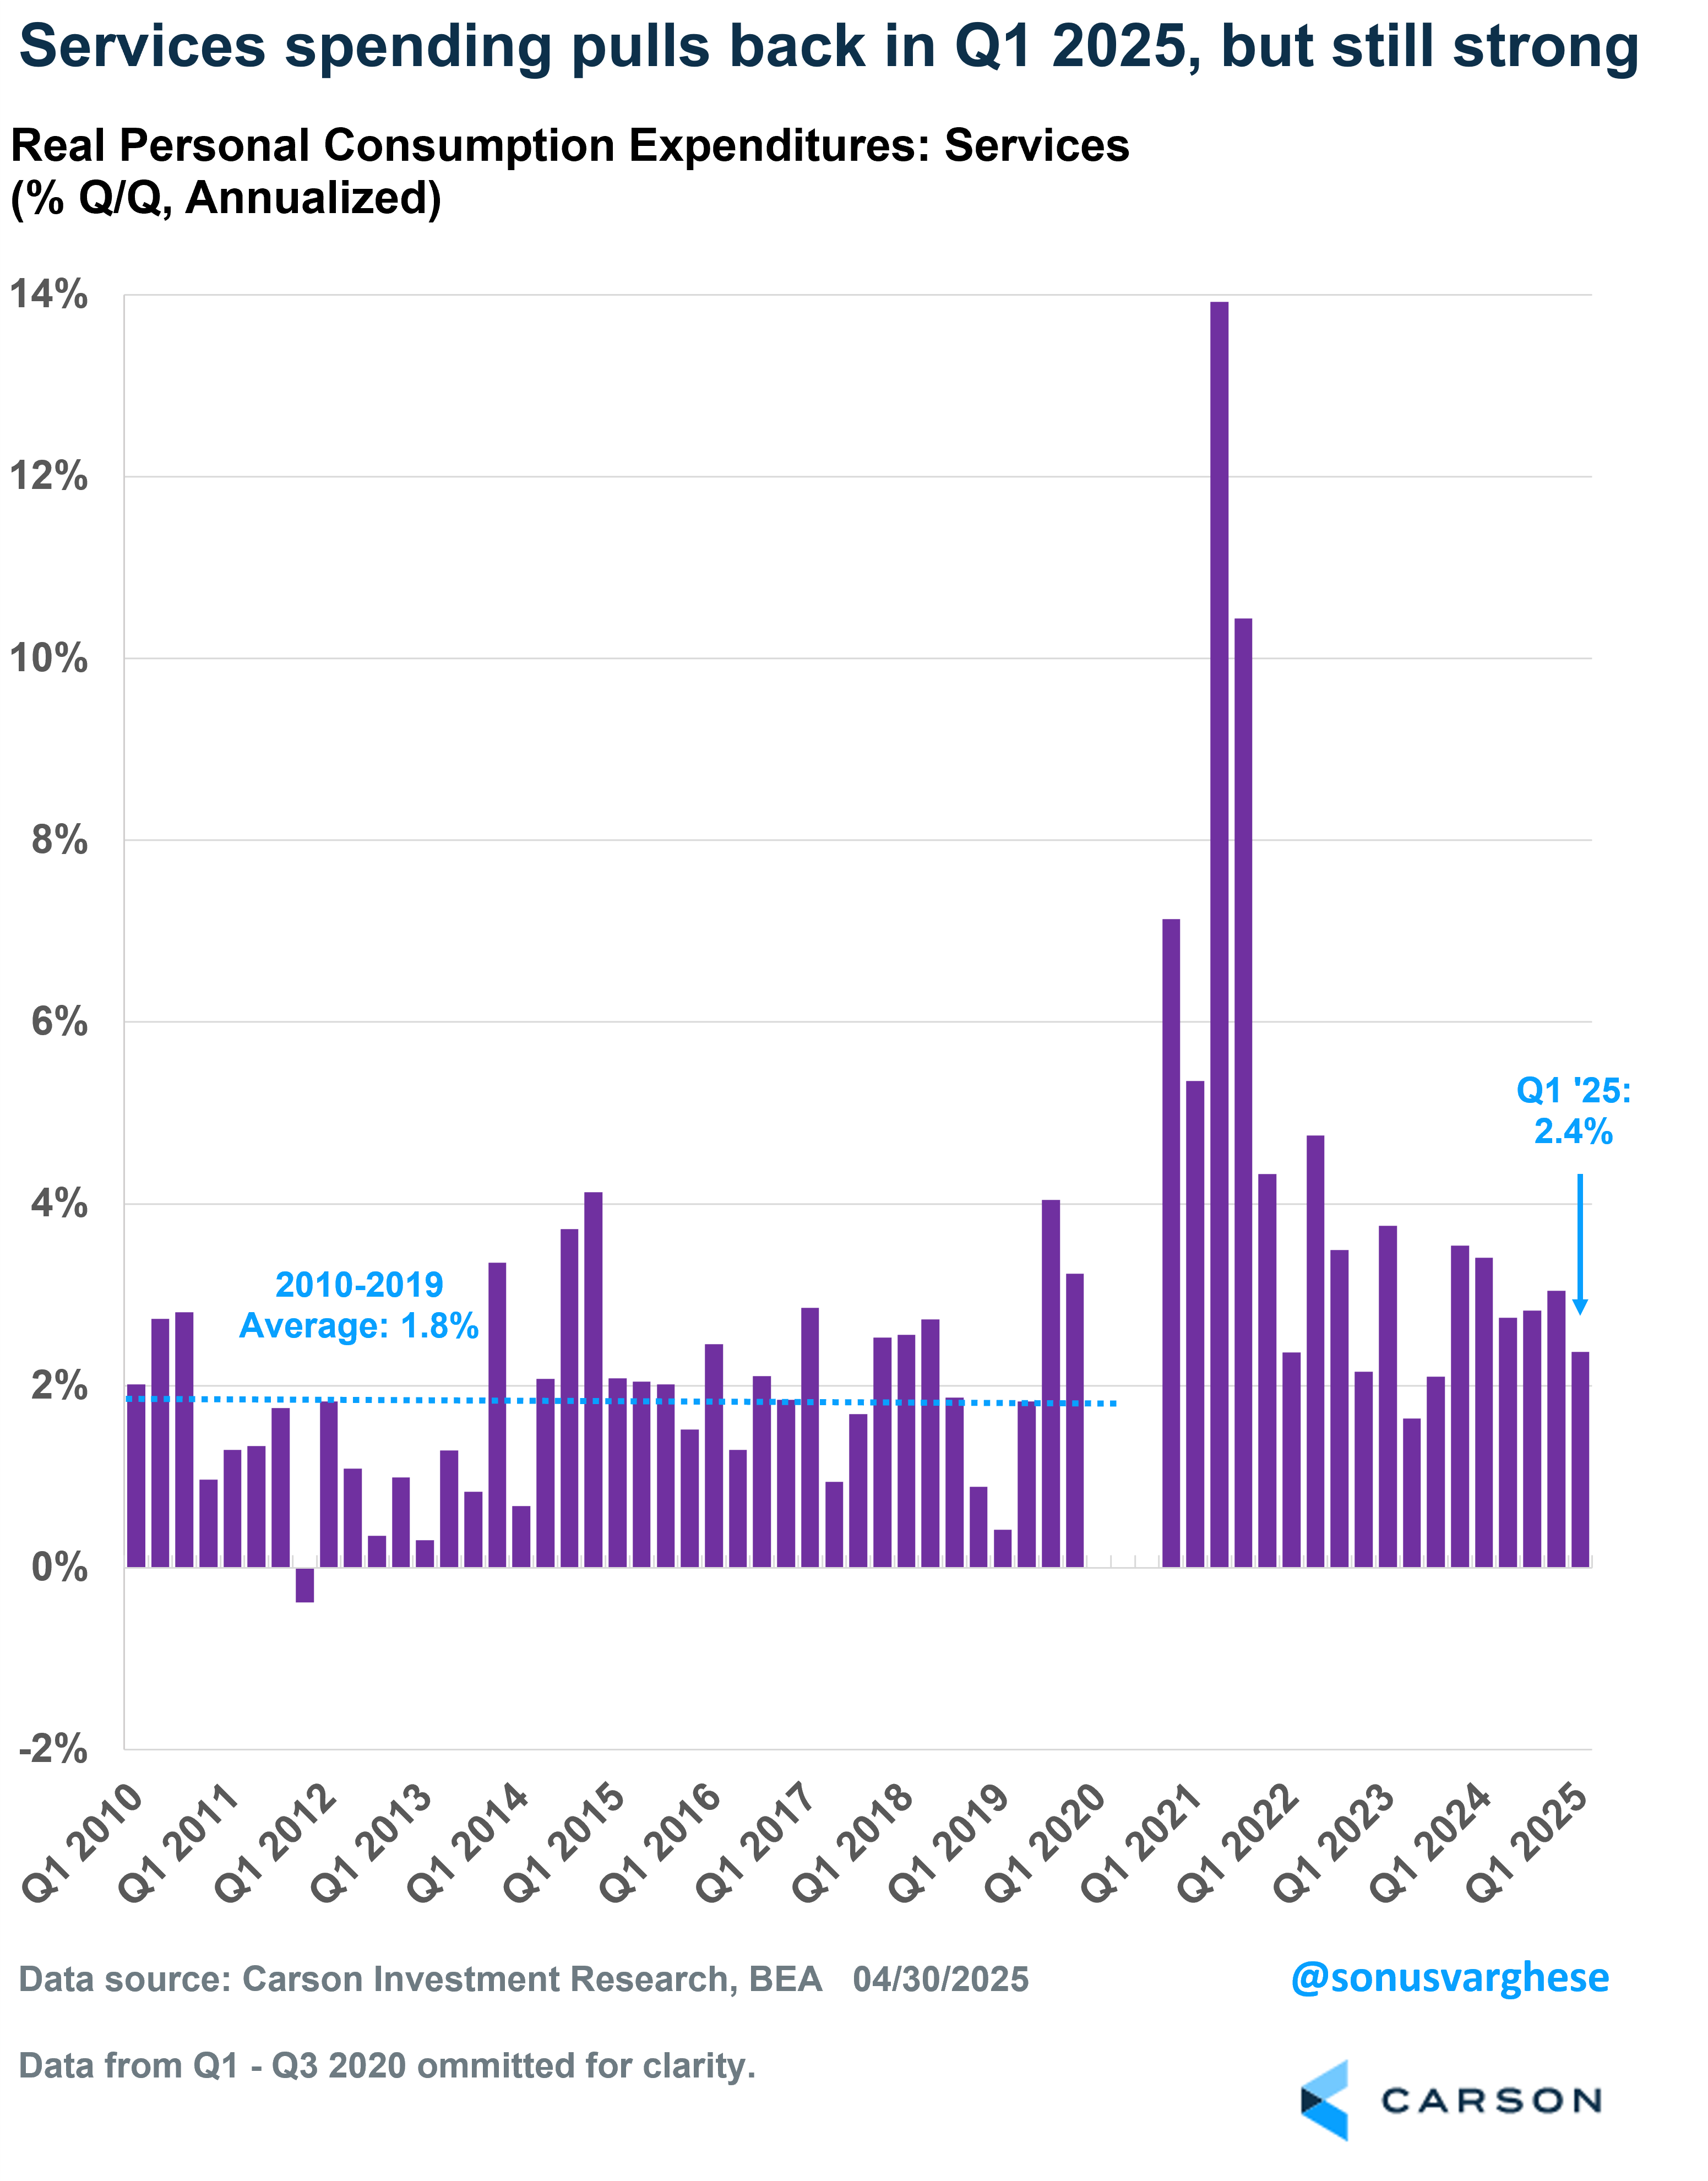
Keep in mind that services spending makes up 45% of GDP, and so it’s key. And since incomes drive spending, the labor market is key going forward. Any growing and persistent weakness in the labor market will take services spending lower and then other shocks could easily take the economy into a downturn.
Of course, all this was before the tariffs, and the big question is what happens next. As I mentioned above, the tariff end game is uncertain. Markets are certainly pricing the situation as if it’s all a bad dream that will go away, which is possible, as I wrote in my bull versus bear case blog. For now, what we do know is that the economy was slowing going into the tariff shock, but it wasn’t close to a recession. However, the tariff uncertainty means the Fed is likely going to pause and that means policy is implicitly getting tighter. That means we shouldn’t be surprised if the economy continues to slow (never mind GDP readings driven by volatile data), with increasing odds of a recession in late 2025 or early 2026.
Stay on Top of Market Trends
The Carson Investment Research newsletter offers up-to-date market news, analysis and insights. Subscribe today!
"*" indicates required fields
For more content by Sonu Varghese, VP, Global Macro Strategist click here.
7927666.1-0525-A
