Every time we get a soft consumption print, concern rises that the consumer is tapped out. This time it’s retail sales, which fell 0.6% in July, while core retail sales (excluding autos and gasoline stations) fell 0.4%. But Amazon Prime Day shifted to June, pulling sales forward. Zooming out, retail sales have run at a 2.4% annualized pace over the past three months, and core sales at 2.1%. That’s not great and marks a momentum shift after strong readings earlier this year, likely helped by larger-than-usual tax refunds. These numbers are nominal, though. Adjusted for inflation, consumption is probably treading water, which is why real GDP growth is running below trend.
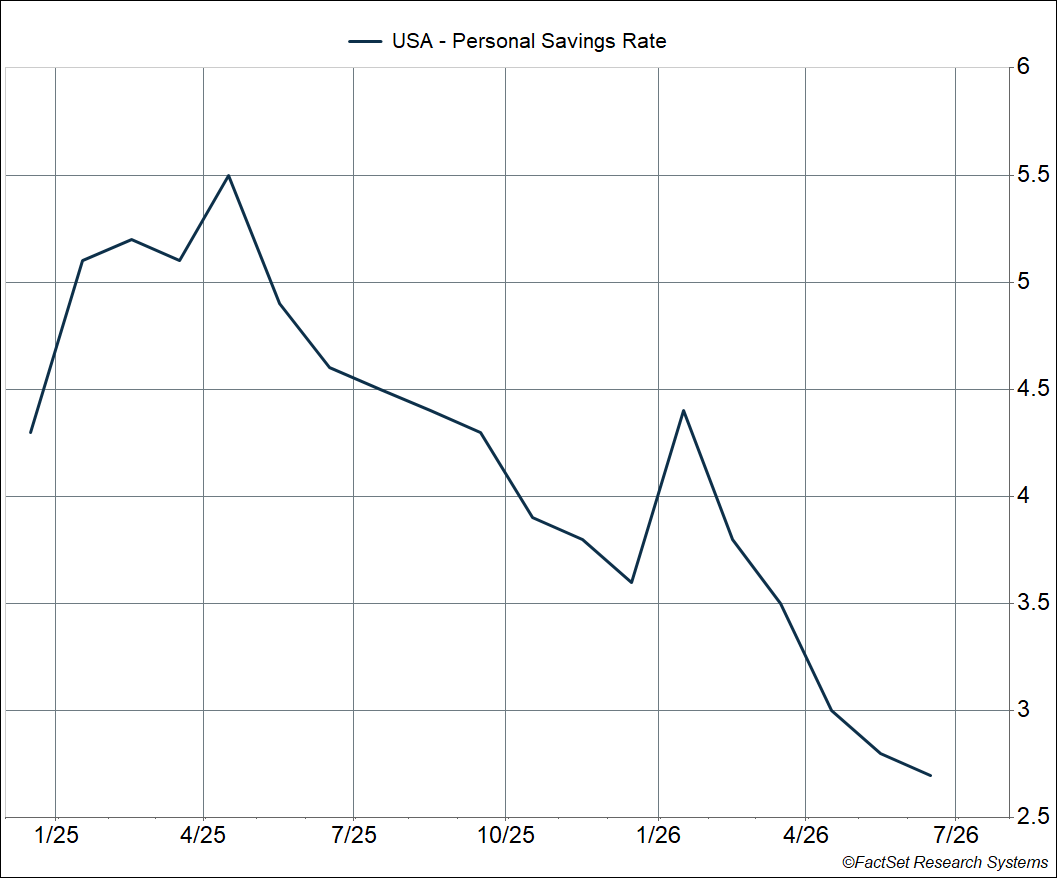
Inflation’s still a big problem for consumers (as I wrote in my prior blog), but they’re still spending. How? Income growth is relatively strong but barely keeping up with inflation. More interestingly, consumers are saving less than they used to rather than taking on more debt to finance consumption.
The savings rate has fallen from 4.3% at the end of 2024 to 2.5% in June. This is NOT a “drawdown” in savings; it measures the difference between aggregate disposable income and consumption each month, as a share of income. Consumers are simply saving less, perhaps because they feel wealthier thanks to a booming stock market and higher home equity.
- The S&P 500 has gained 155% from the end of 2019 through July 2026
- Home prices (Case-Shiller National Home Price Index) are up over 50% over this period
On the other hand, credit card debt has fallen 1.1% from the end of 2025 (via the New York Federal Reserve’s quarterly report on household credit and debt). At the same time, disposable income is up 2.4%. In short, households became less levered again this year.
For perspective, in 2019 (full year)
- Total household debt grew by 4.4%
- Credit card debt grew by 6.6%
- Disposable income grew by 2.7%
It’s remarkable that disposable income grew faster than overall debt in 2023-2025. In 2026, the gap widened further, with debt actually shrinking.
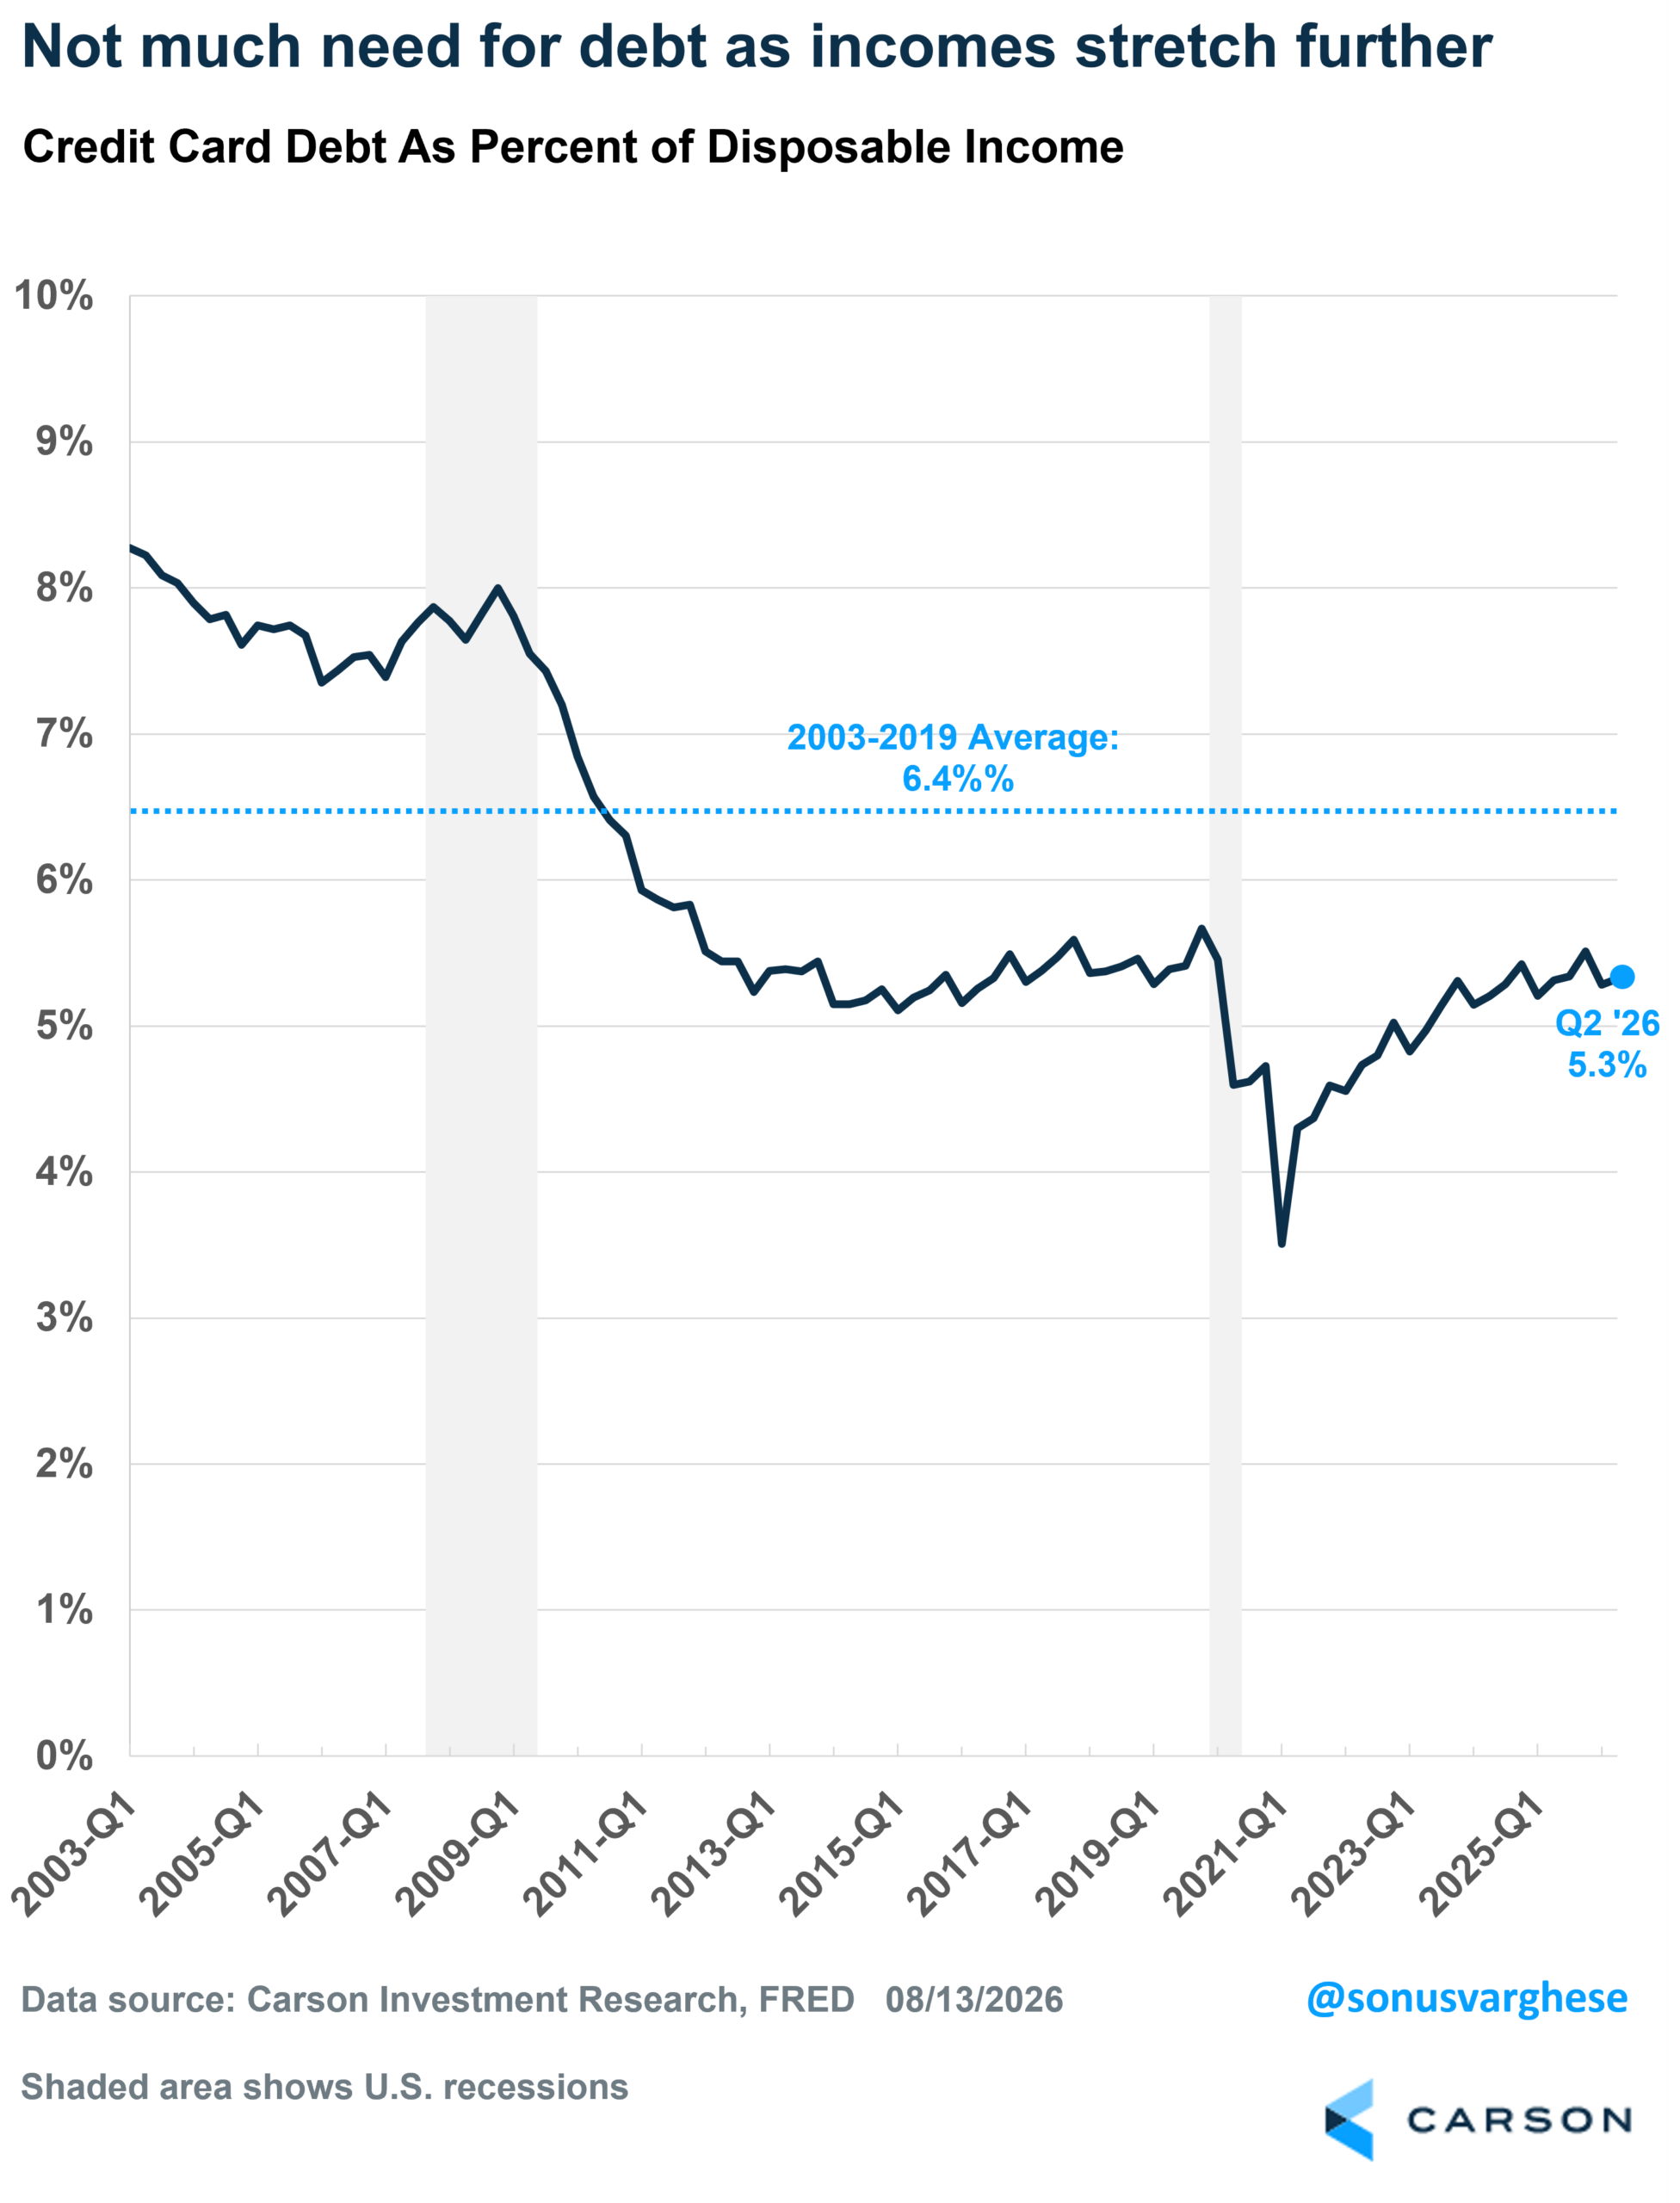
Credit card debt is 5.3% of disposable income. It was 5.7% in Q4 2019, and the 2003-2019 average is 6.4%.
Debt service still relatively on the lower side
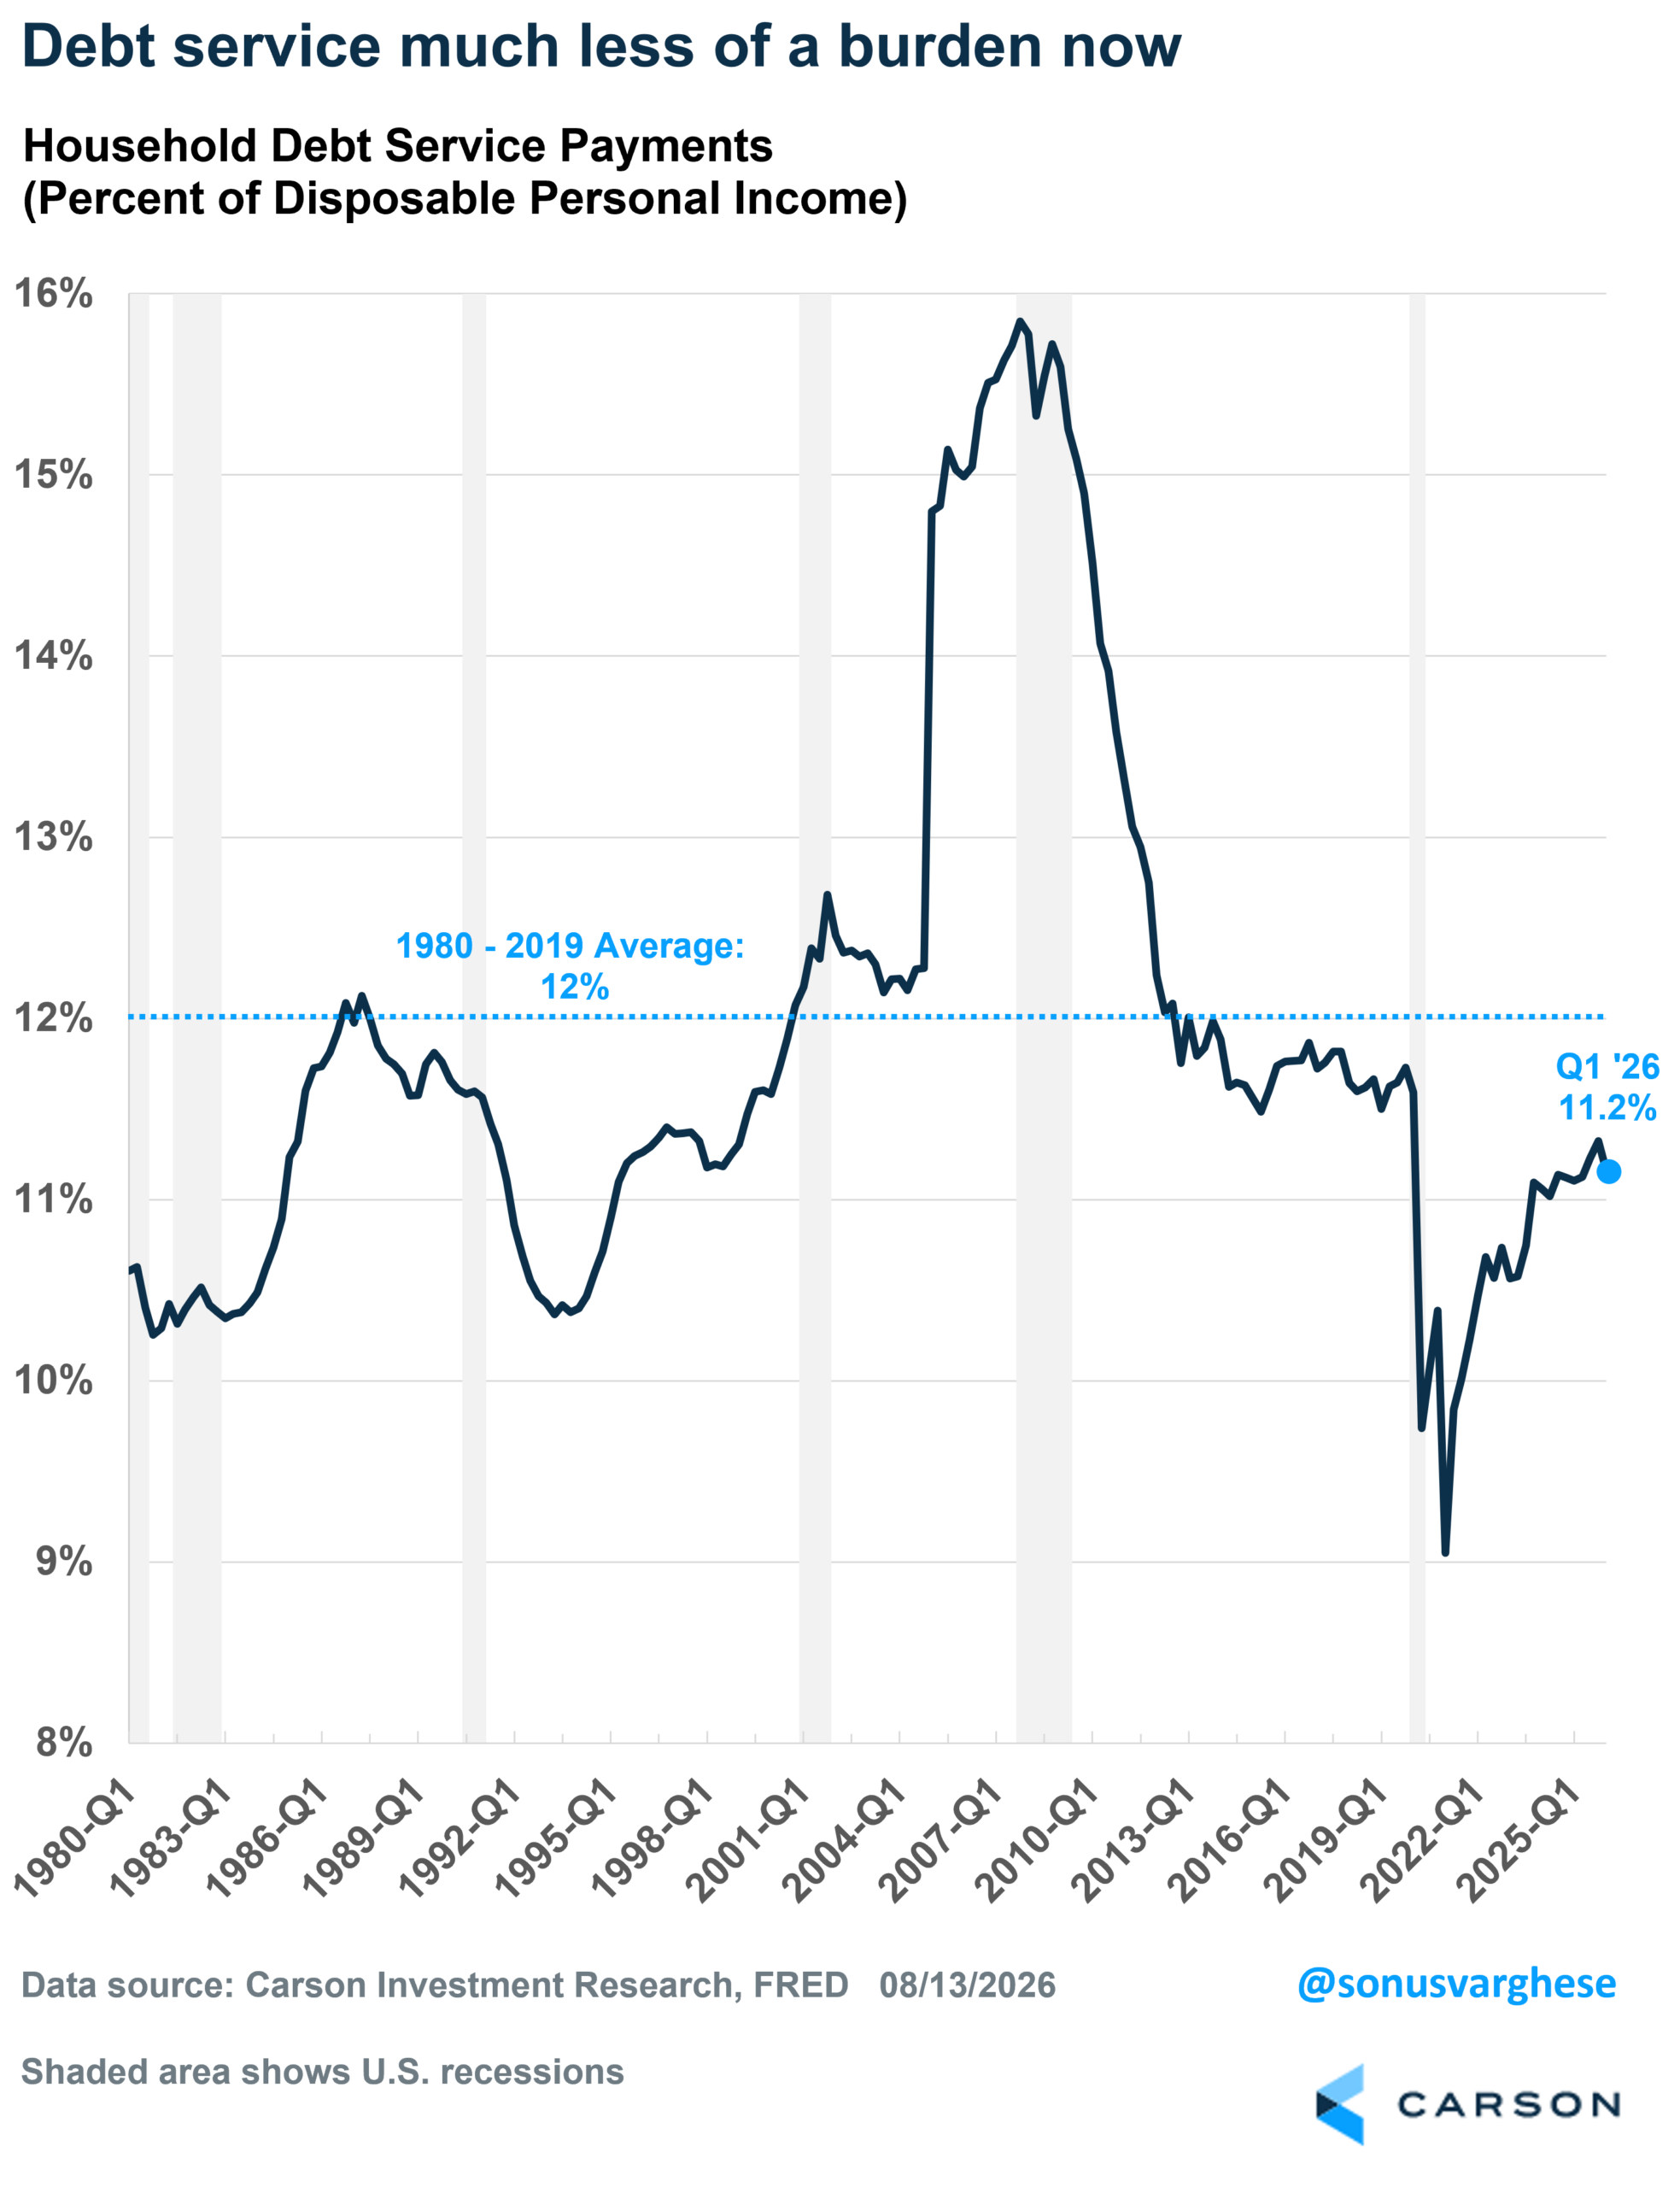
Disposable income is what matters for servicing the debt. Debt service payments are just 11.2% of disposable income.
- Below the 1980-2019 average of 12%
- And even below the 2019 level of 11.7%
Recall that 2019 came after a decade of deleveraging following the financial crisis. Yet debt service today is running even below 2019 levels.
Utilization remains relatively mild
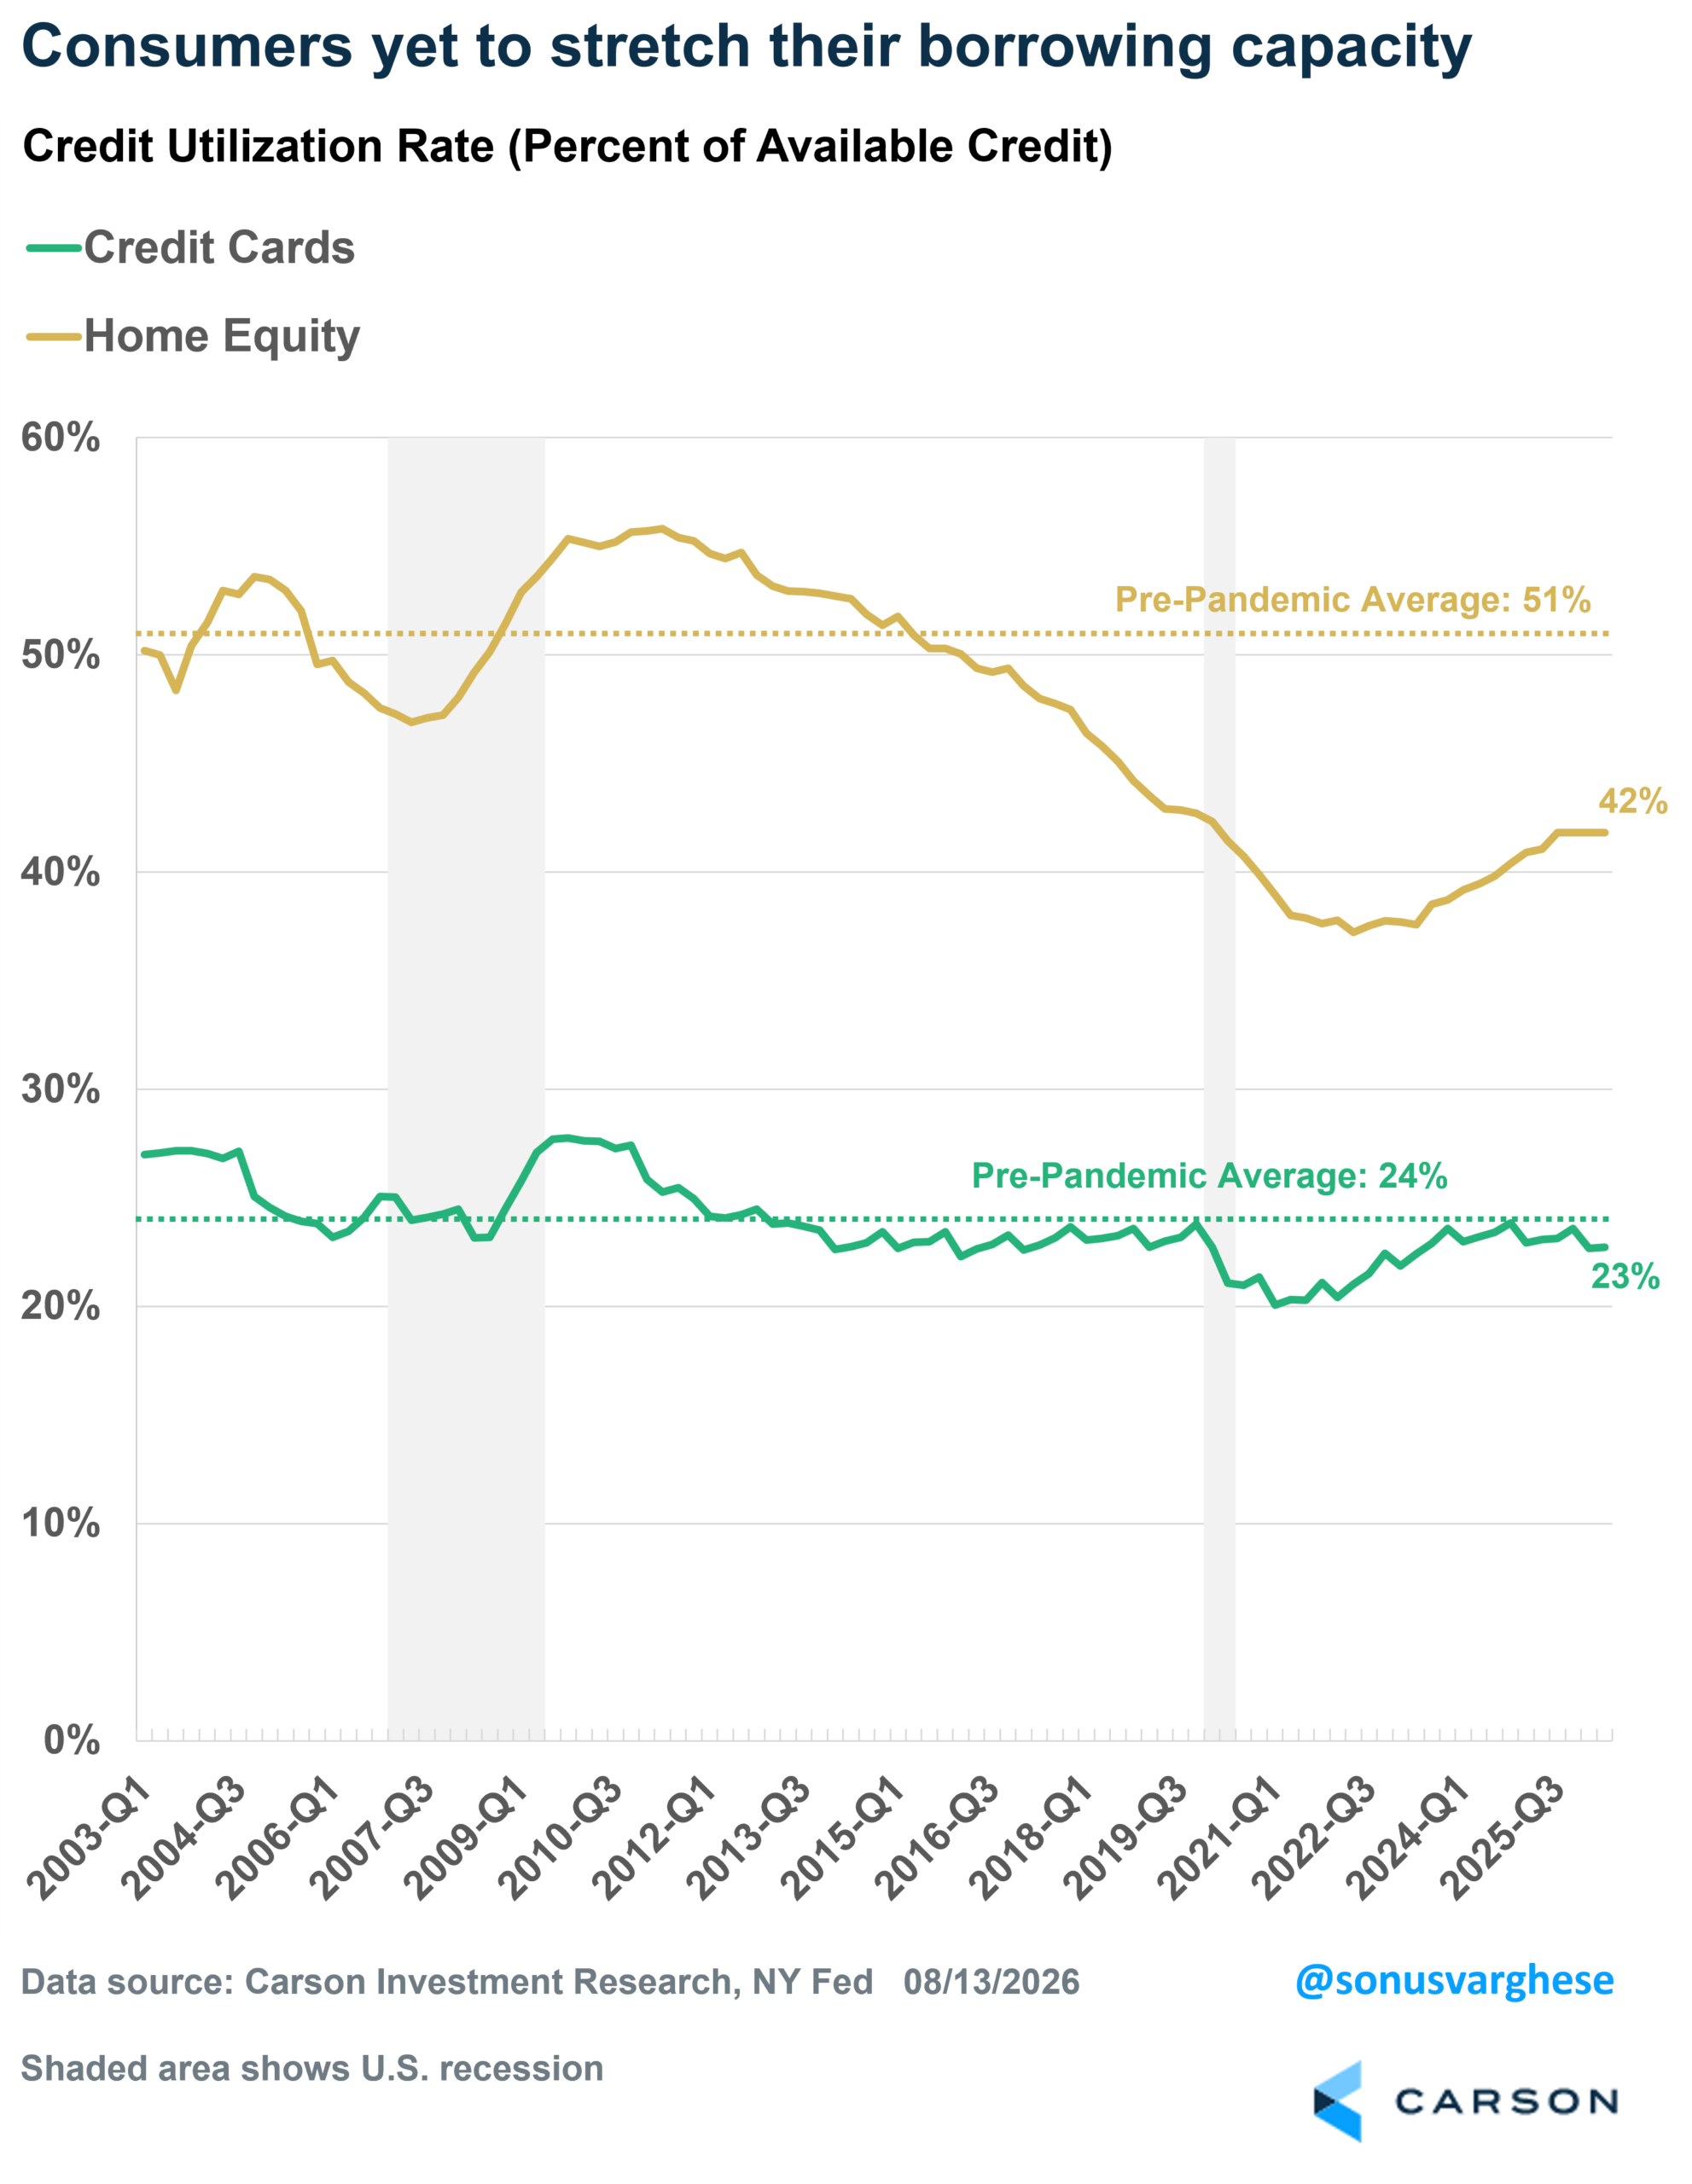
Credit card limits rose $85 Bil in Q2, while balances rose $21 Bil, leaving available credit up $64 Bil. Credit utilization was unchanged at 23%, versus a 24% pre-pandemic average
Home equity credit utilization rose from 42.6% to 43.1%, leaving it well below the historical average of 51%!
Mortgage originations eased, but auto originations hit a record
Mortgage originations fell 4.7% in Q2, down $25 Bil to $505 Bil, including refinances. That’s not surprising given higher interest rates amid persistently elevated inflation.
Most of the decline came from “high quality” borrowers with credit scores above 760 (-$22 Bil). That group still accounts for 58% of originations and has driven most mortgage borrowing in recent years. Lower-score borrowers, especially subprime borrowers (scores below 620), are taking out far fewer mortgages, in sharp contrast to the mid-2000s.
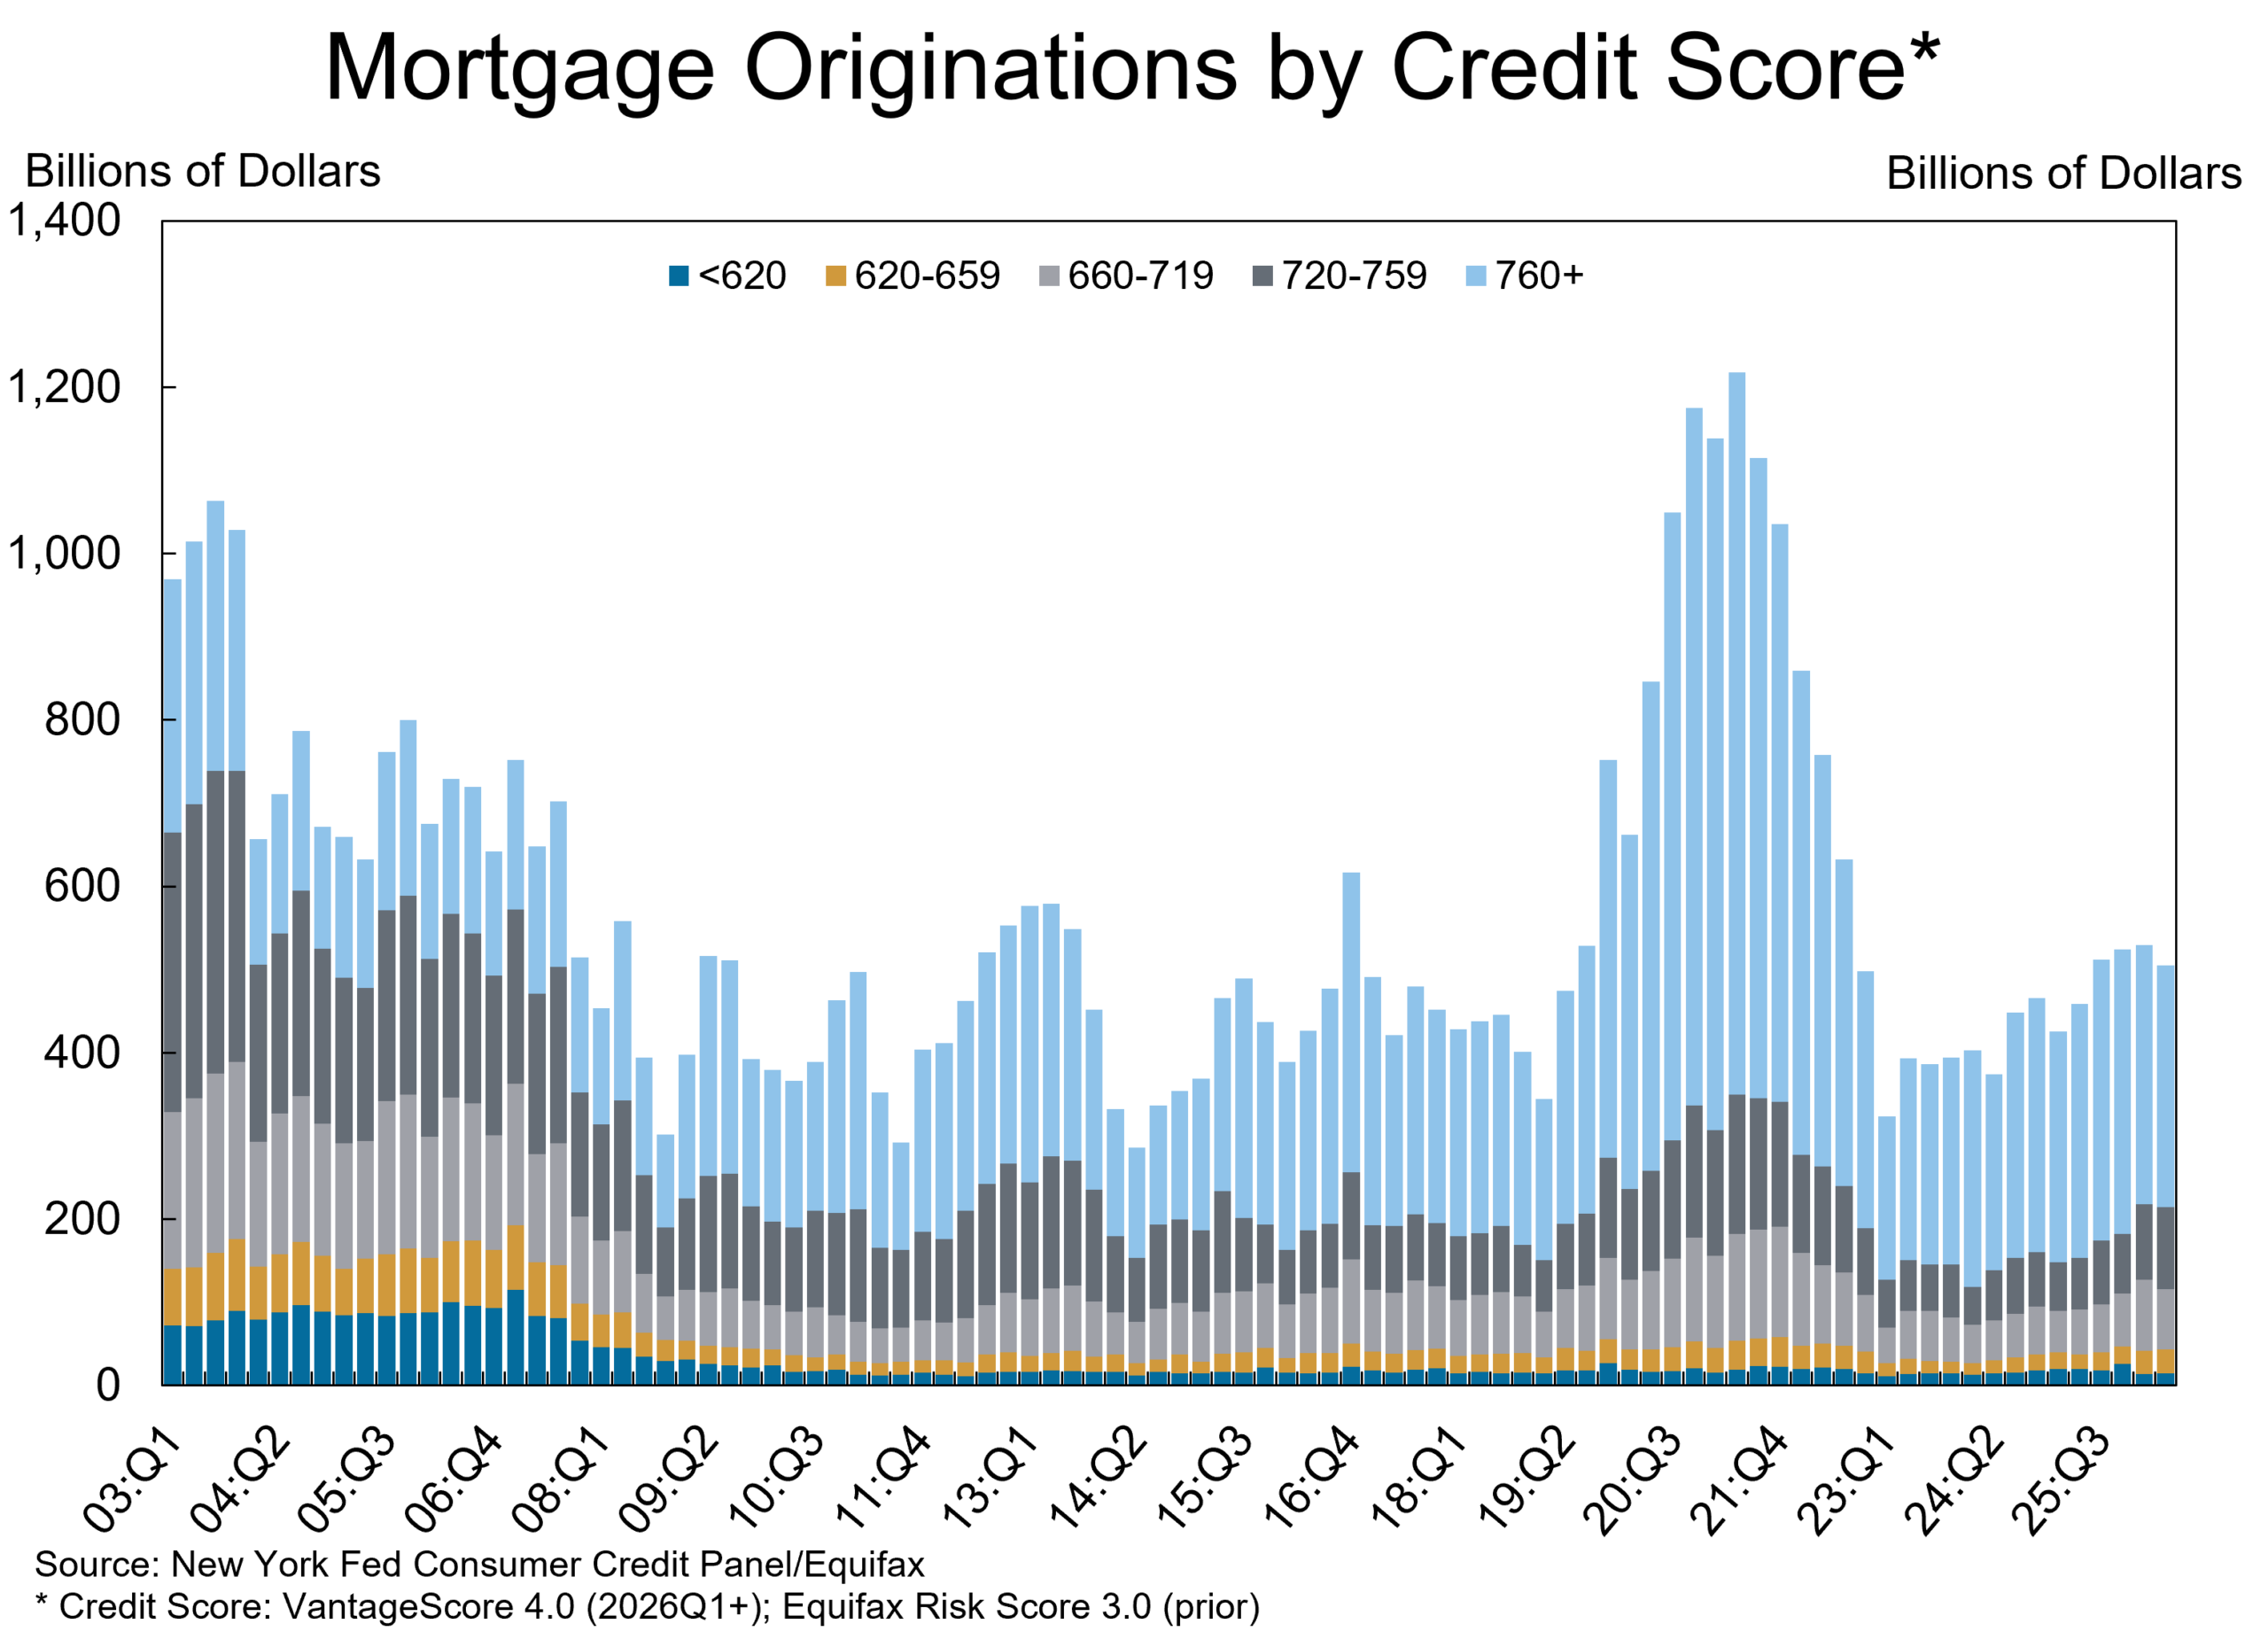
Quality matters. Credit growth is less important than in prior cycles, and borrowing is concentrated among the highest-rated borrowers, unlike in the mid-2000s.
This also suggests there’s a lot of “dry powder” in home equity waiting to be unlocked if mortgage rates pull back. That makes the chart above especially important for the economy over the next few years. Assuming home prices hold and mortgage rates fall toward 5-6%, housing could provide a meaningful tailwind. Even if we enter a recession, lower rates could pull mortgage rates down sharply and help housing lead the economy out.
Auto loans are especially interesting. Originations jumped 15.8% to $211 Bil, the strongest quarter in the history of the data. Credit quality held up too: the median score is 716, well above the ~680 average in the mid-2000s. That’s another sign consumers feel reasonably good about the economy. If they were deeply worried about their jobs, they’d be less likely to make a big-ticket purchase like a car.
Quality matters here too. The 10th percentile credit score for auto originations is around 580, versus an average of 550 in the mid-2000s. Borrowers below 620 are 16% of originations now, versus 20% pre-pandemic and 28% in the mid-2000s.
The long and short of it: even if there is a recession in the next 12-24 months, a debt crisis looks unlikely. Most new mortgage and auto borrowing is still concentrated at the top of the credit-quality spectrum.
But What About Delinquencies?
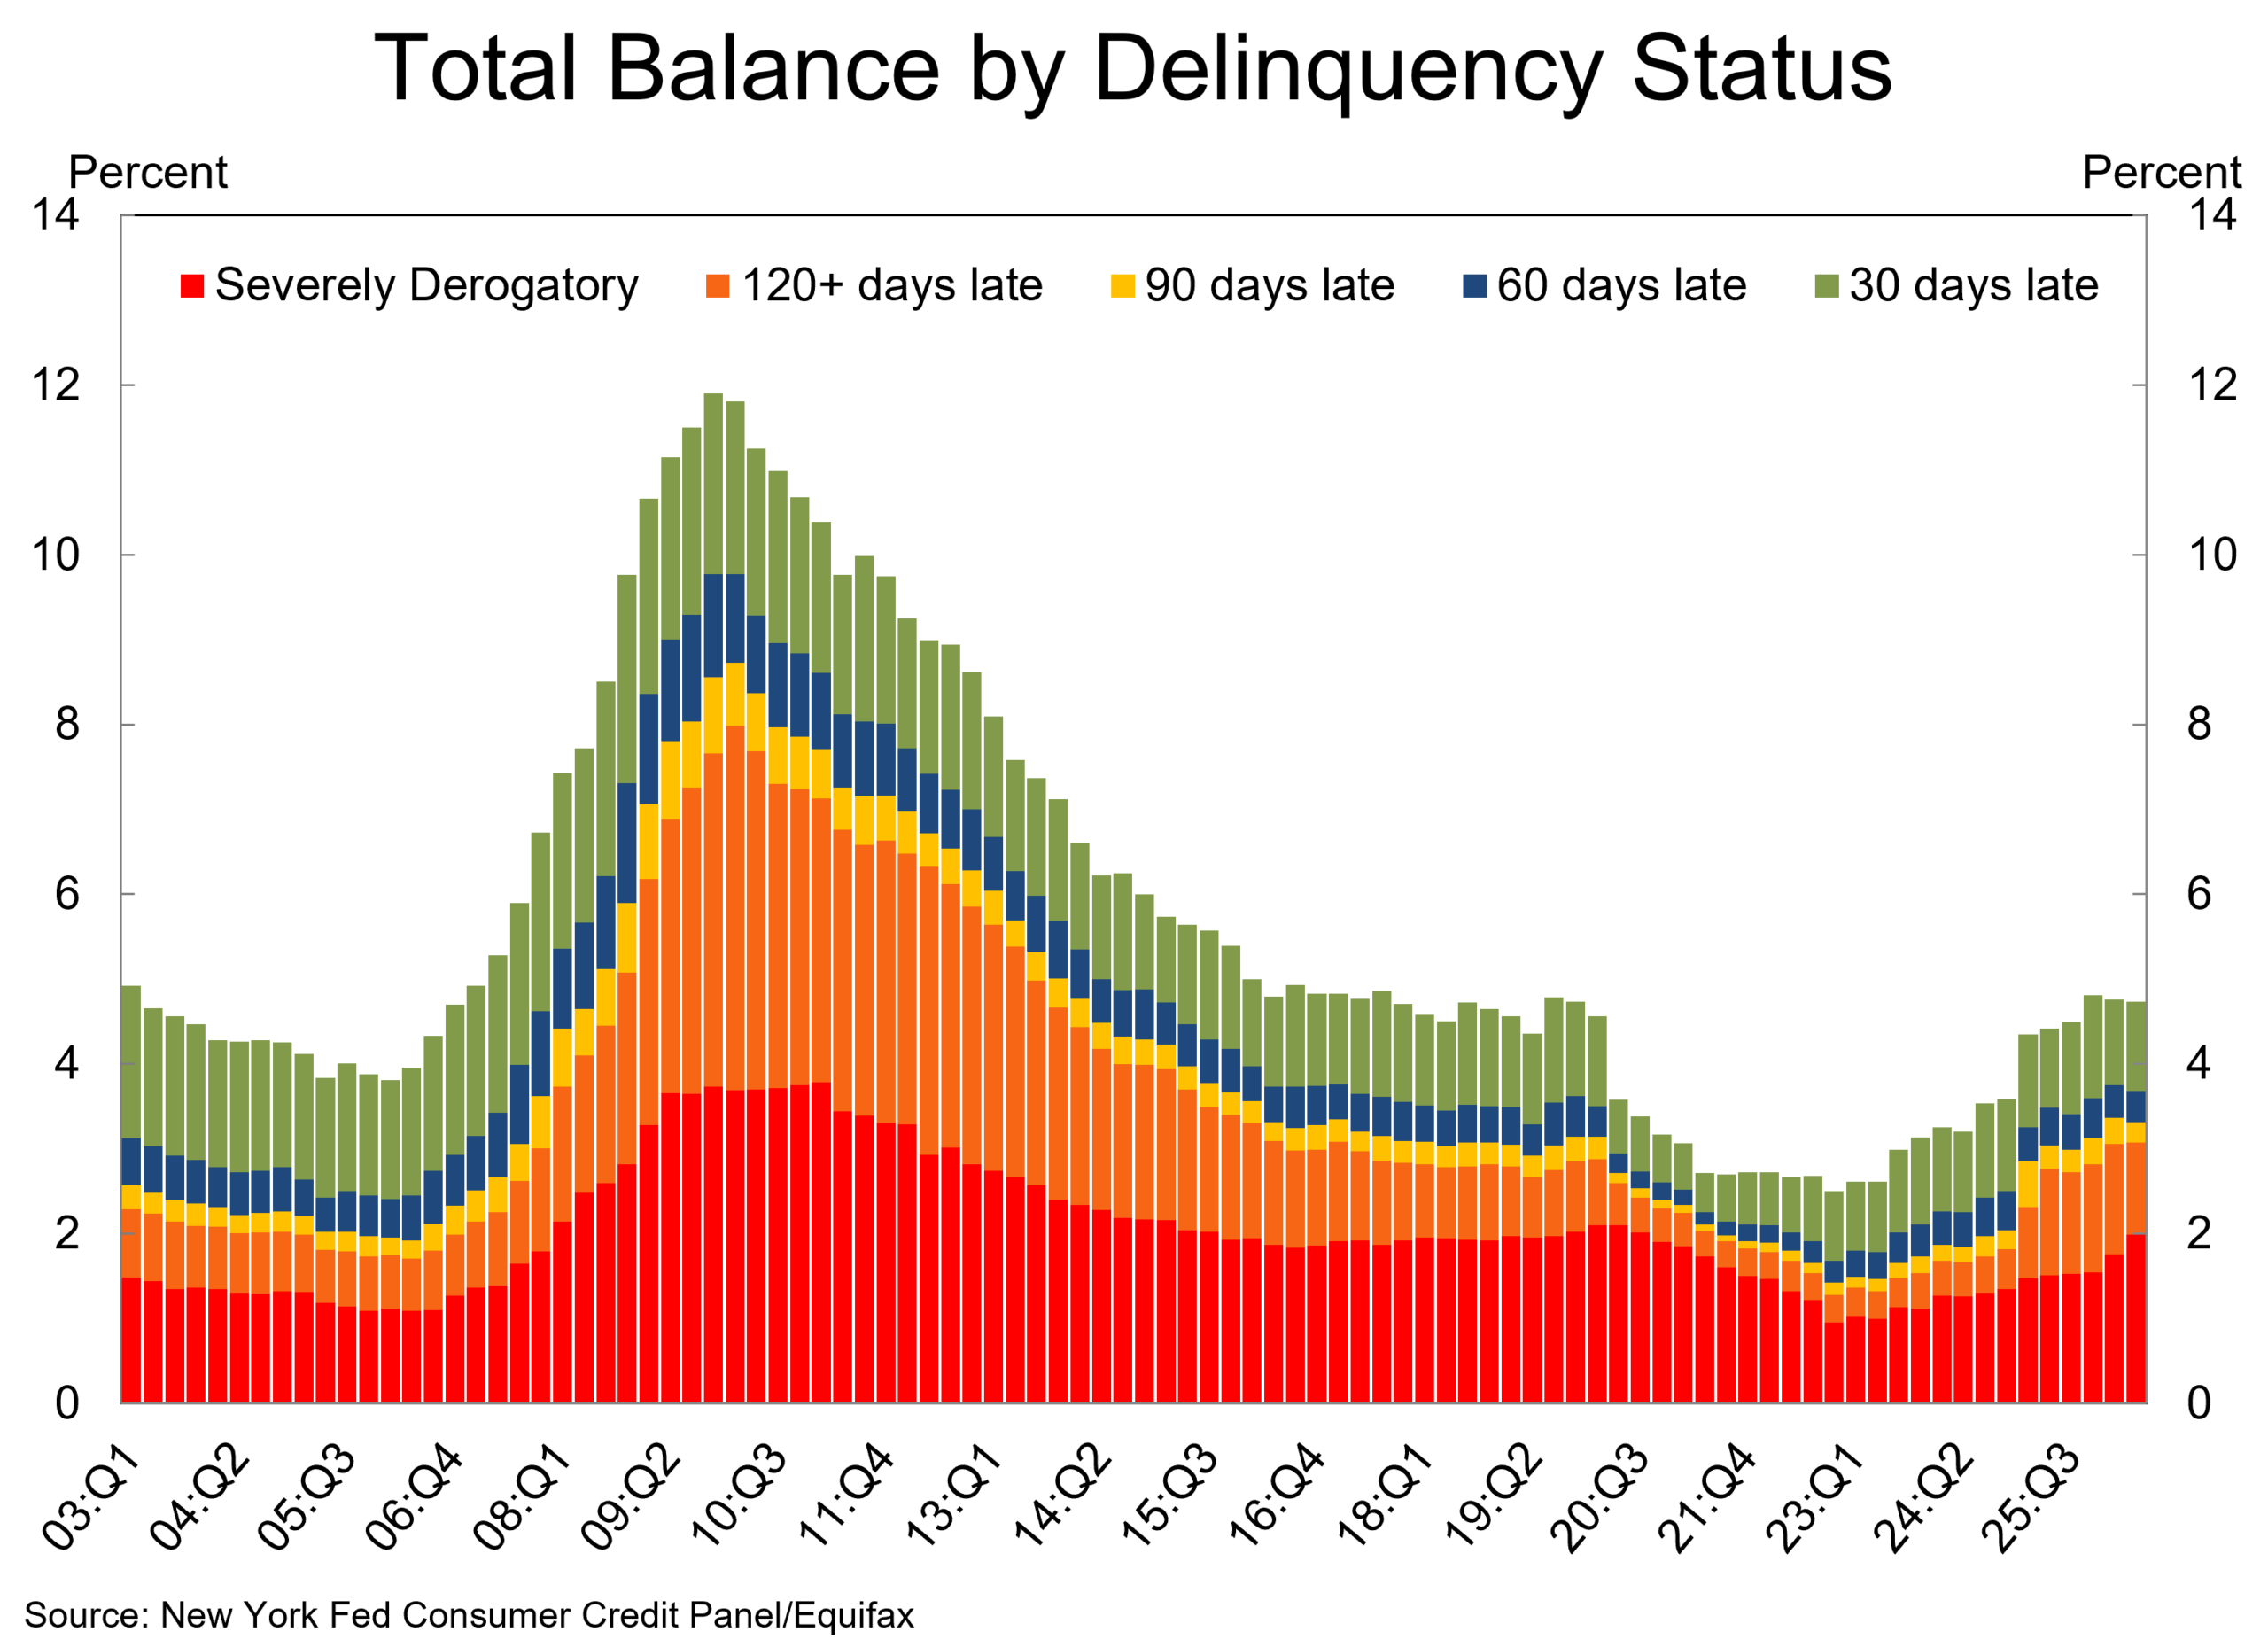
The share of total balances current on payments rose from 95.24% to 95.27%, exactly the Q4 2019 level and well above 93.3% in Q4 2007.
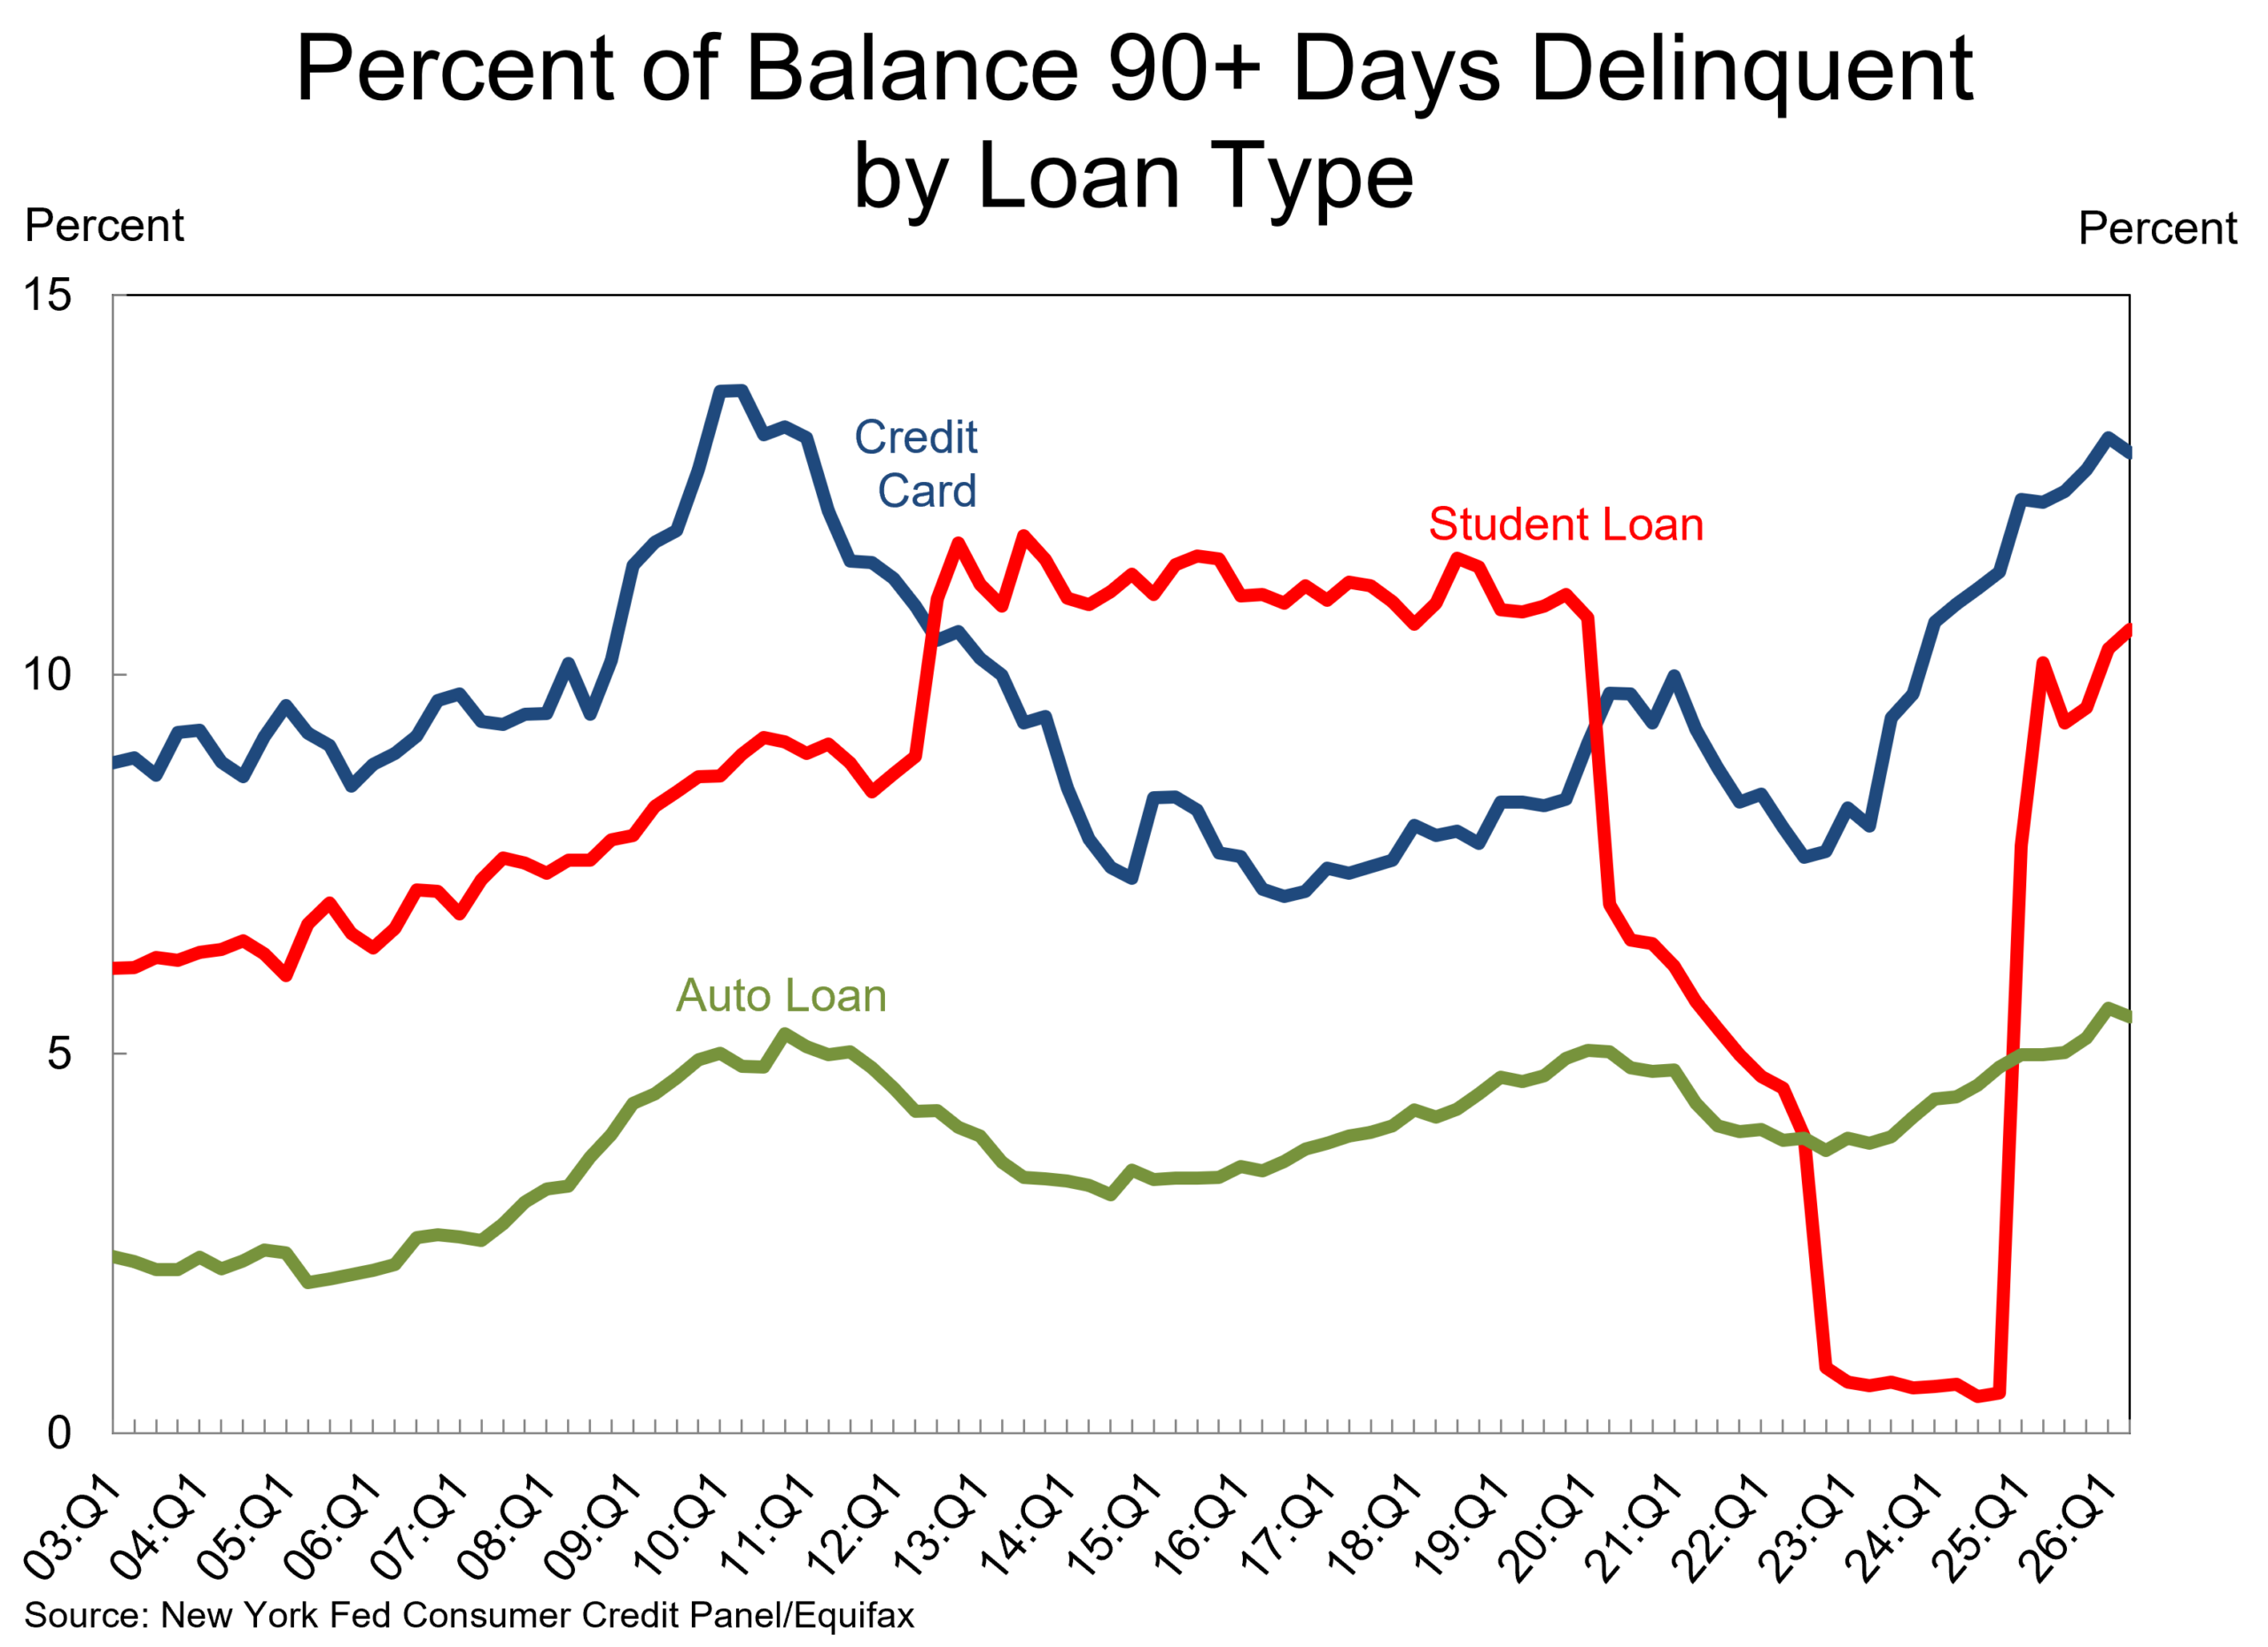
Here’s the percentage of balances that are 90+ days delinquent right now:
- Credit cards: 12.9% (was 8.4% in Q4 2019)
- Auto loans: 5.5% (was 4.9% in Q4 2019)
- Student loans: 10.6% (was 11.1% in Q4 2019)
Keep in mind that mortgages/HELOCs make up the bulk of household debt, and serious delinquencies there are running around pre-pandemic levels.
- Mortgage debt: 0.99% (was 1.07% in Q4 2019)
- HELOCs: 0.99% (was 0.84% in Q4 2019)
One concern is that transitions into serious delinquency (90+ days) are running above pre-pandemic levels. But the transition rate measures newly delinquent balances as a share of the prior quarter’s non-delinquent balance. With debt balances low, it doesn’t take much to make that rate look alarmingly high.
There’s also a weird reason as to why delinquent balances are high right now. The New York Fed published a blog post on Tuesday showing that charged-off credit card debt is simply staying on credit reports far longer than it used to. Between 2004 and 2012, about 40% of borrowers’ charged-off debts were still being reported a year later. By 2024, that share had doubled.

Stay on Top of Market Trends
The Carson Investment Research newsletter offers up-to-date market news, analysis and insights. Subscribe today!
"*" indicates required fields
That matters because “severely derogatory” balances—loans lenders have effectively written off—never leave the New York Fed’s delinquency measure. Lenders drop them once deemed uncollectible, typically 120-180 days past due, but the Fed keeps counting them. So delinquent balances can mechanically build even without new borrowers falling behind.
When researchers stripped out severely derogatory balances, delinquencies stabilized after 2024. As they noted, the stock kept rising because charged-off debts accumulated even after new delinquencies stabilized.
In other words, the headline measure overstates credit card stress. One caveat: delinquency rates remain especially elevated for borrowers in low-income areas and younger borrowers. Aggregate calm can hide real pockets of pain.
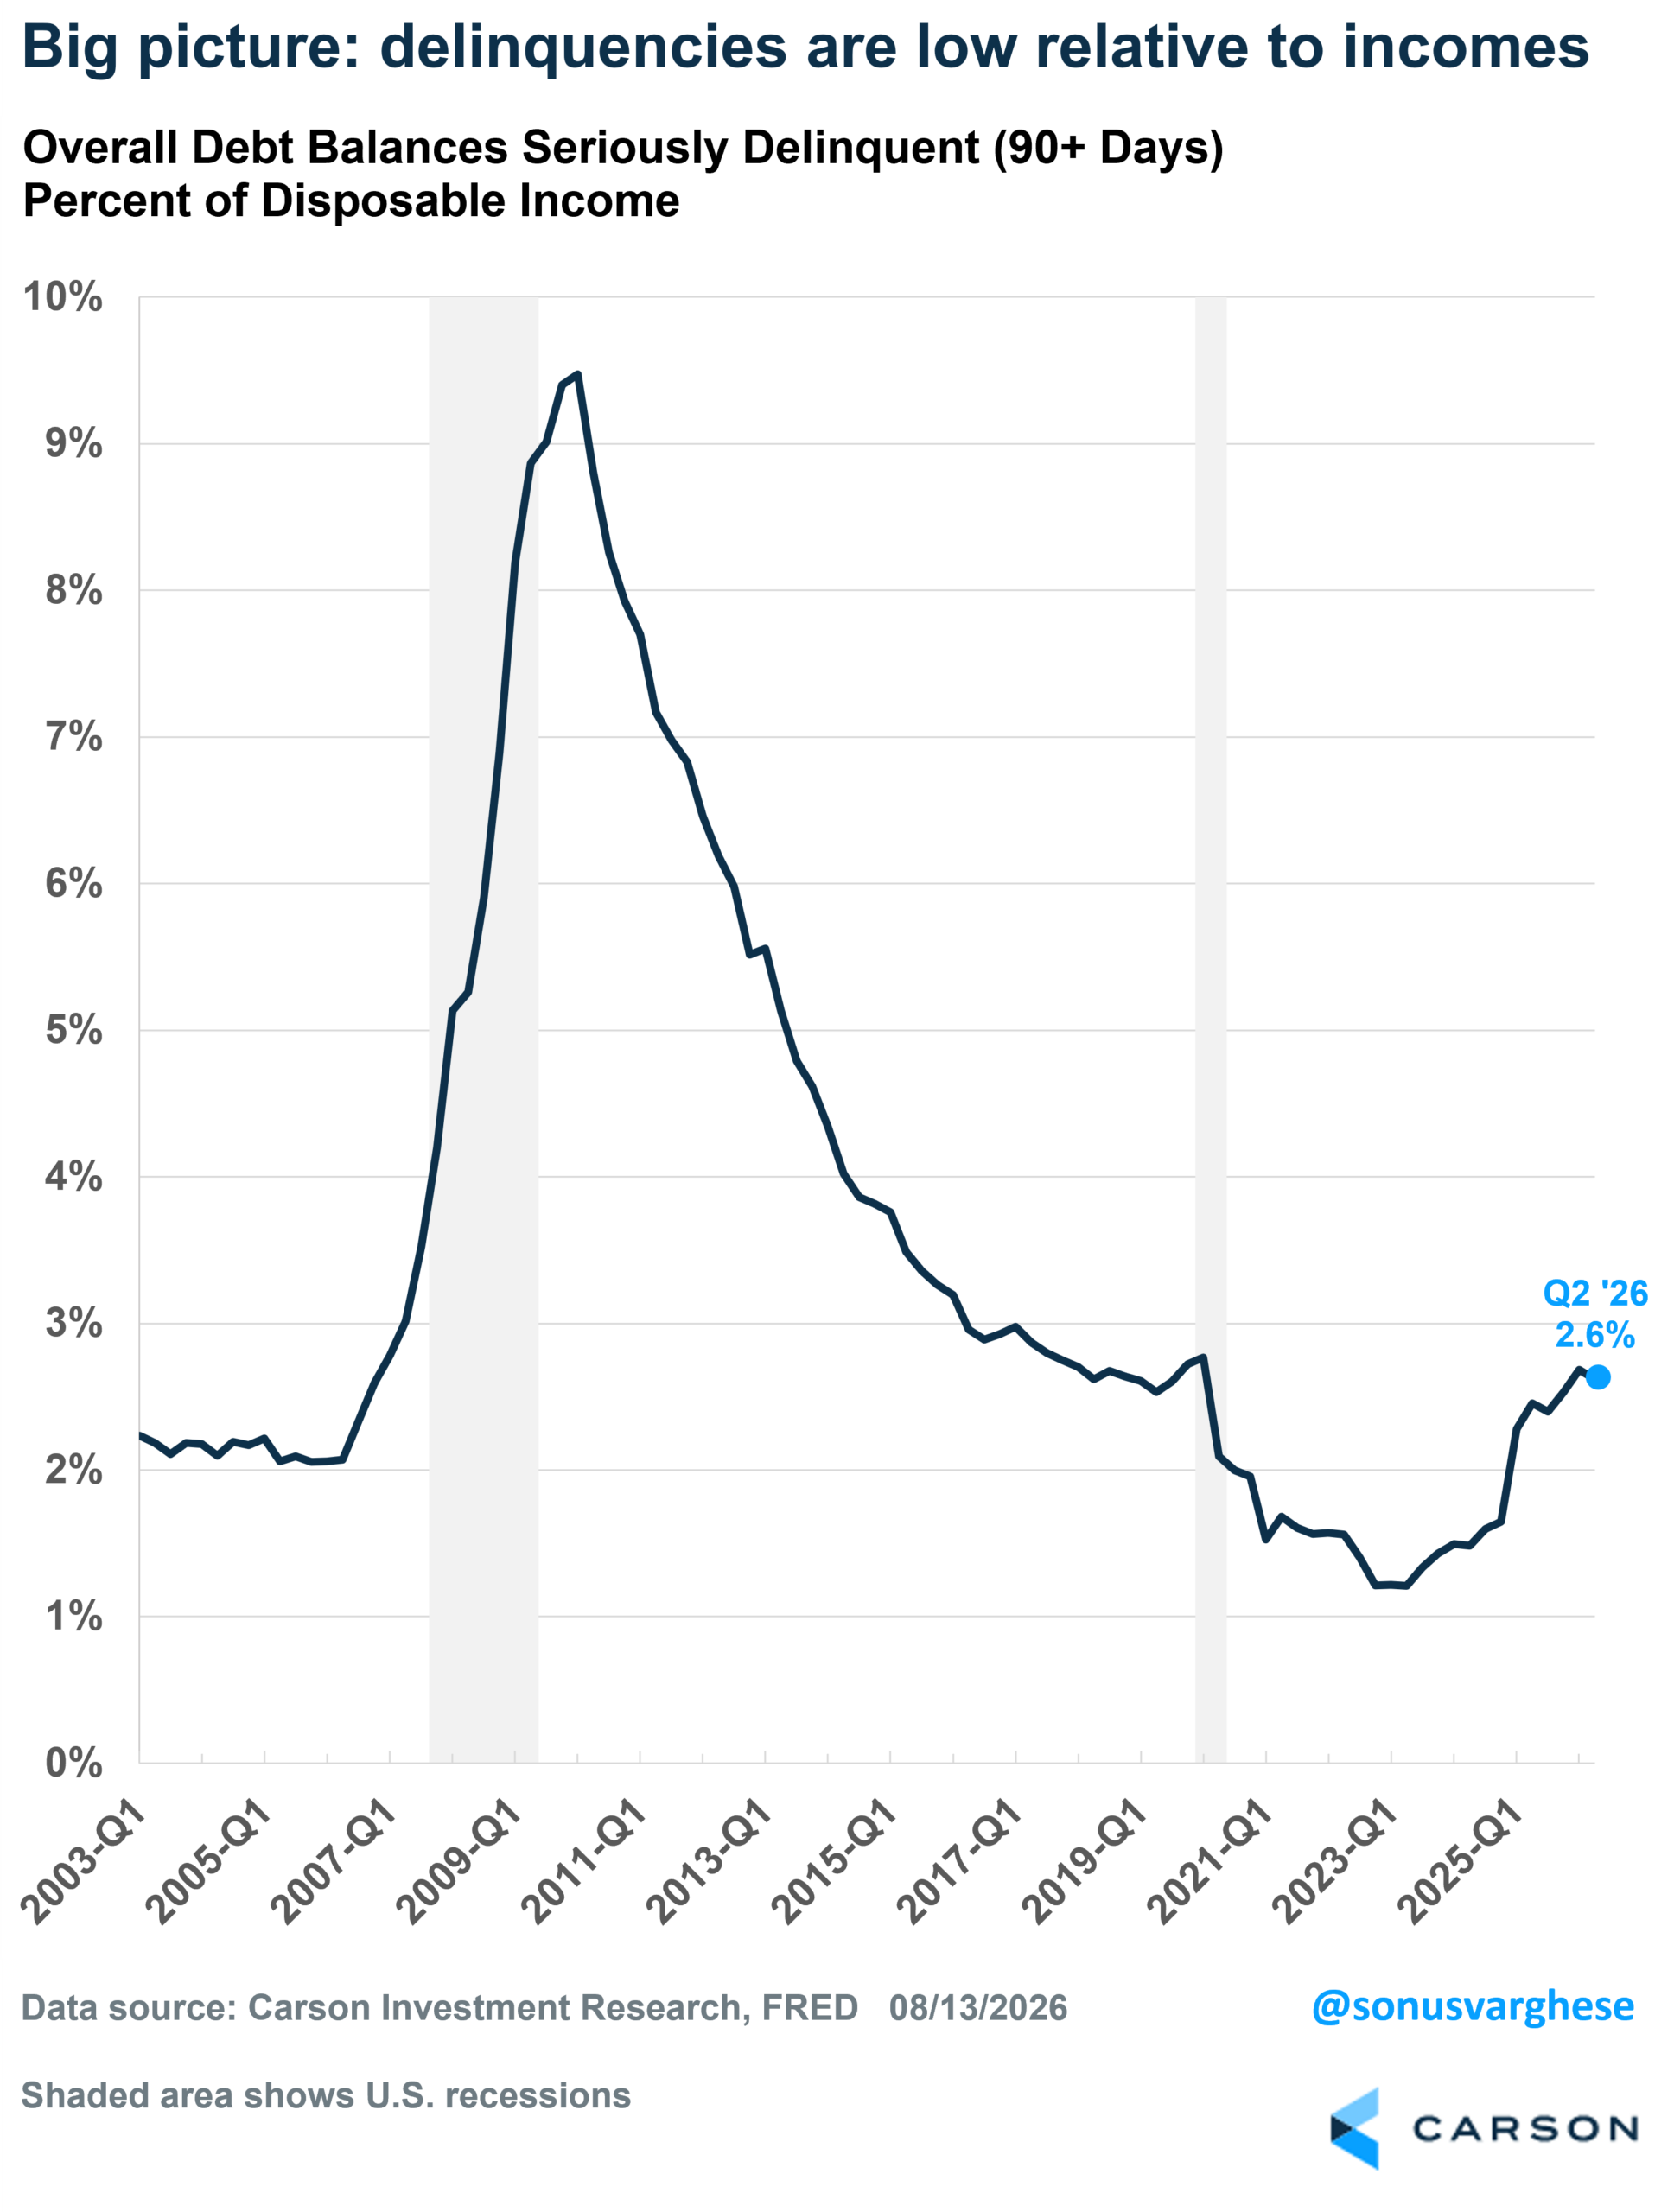
Big picture: delinquencies are low relative to incomes
Disposable income is useful for normalizing debt over time because both debt and income are nominal and tend to rise.
Seriously delinquent balances overall are just 2.6% of disposable income, down from 2.7% in Q1. Even after the student-loan restart pushed the ratio higher, it remains below the 2.7% seen in Q4 2019.
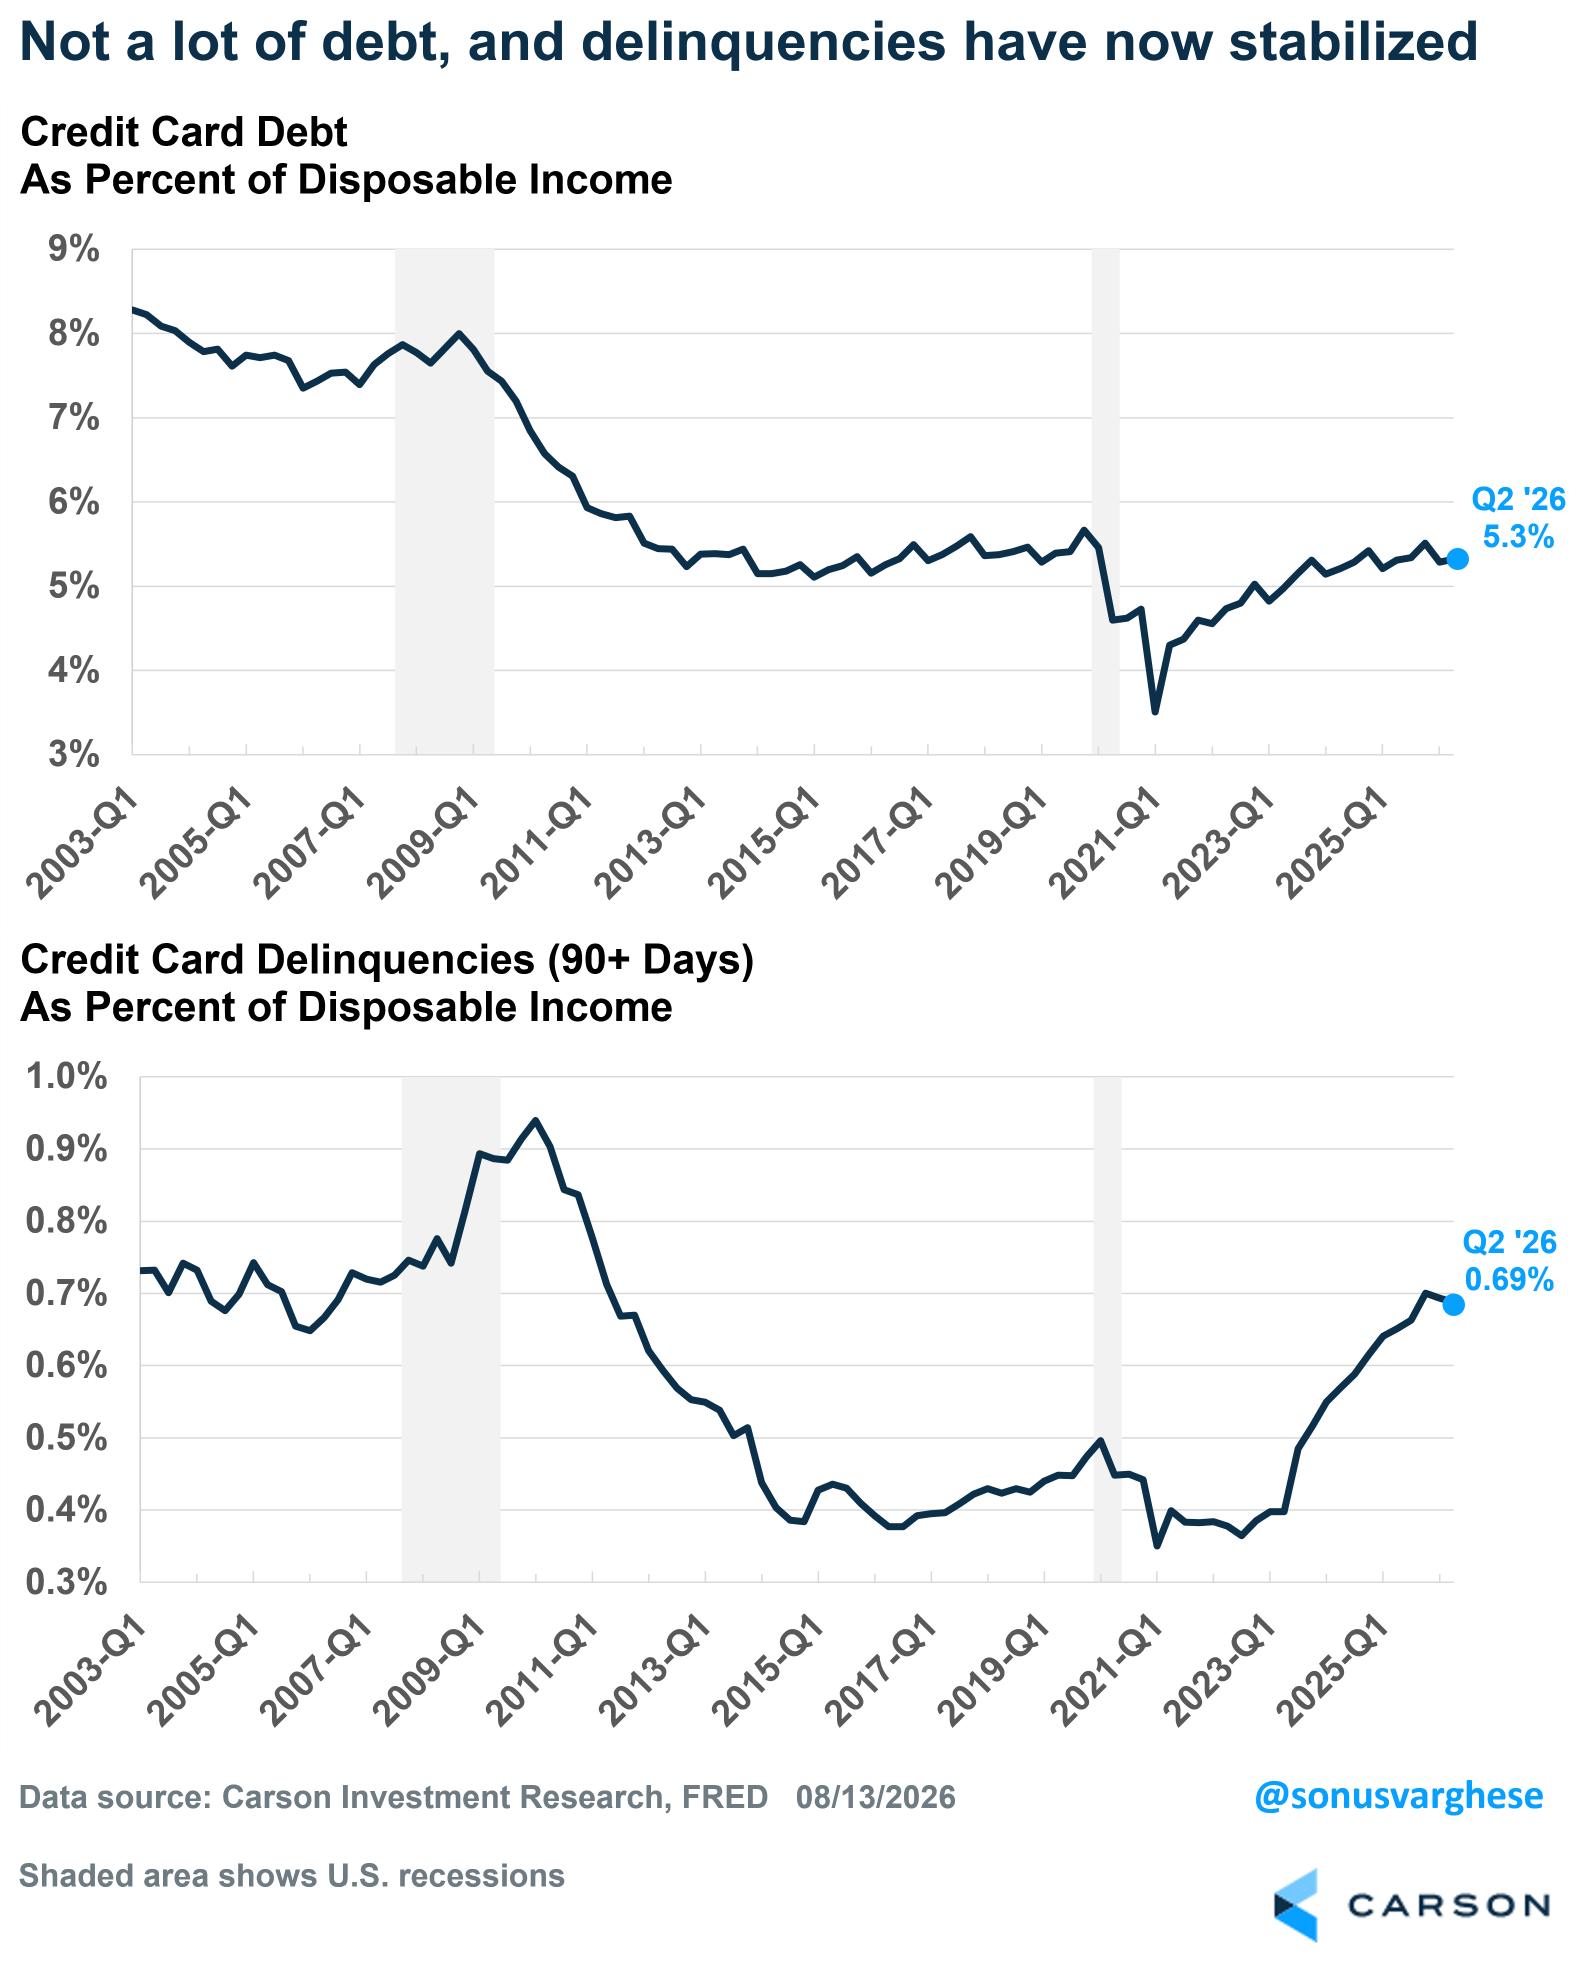
For credit cards, seriously delinquent balances are 0.69% of disposable income and have been essentially flat for three quarters (0.70%, 0.69%, 0.69%). That sits inside the 0.65%-0.75% range seen across 2003-2007—more like a normal expansion than a stress event. Overall credit card balances are also low relative to income (5.3%), and serious delinquencies have stabilized, even before adjusting for their overstatement.
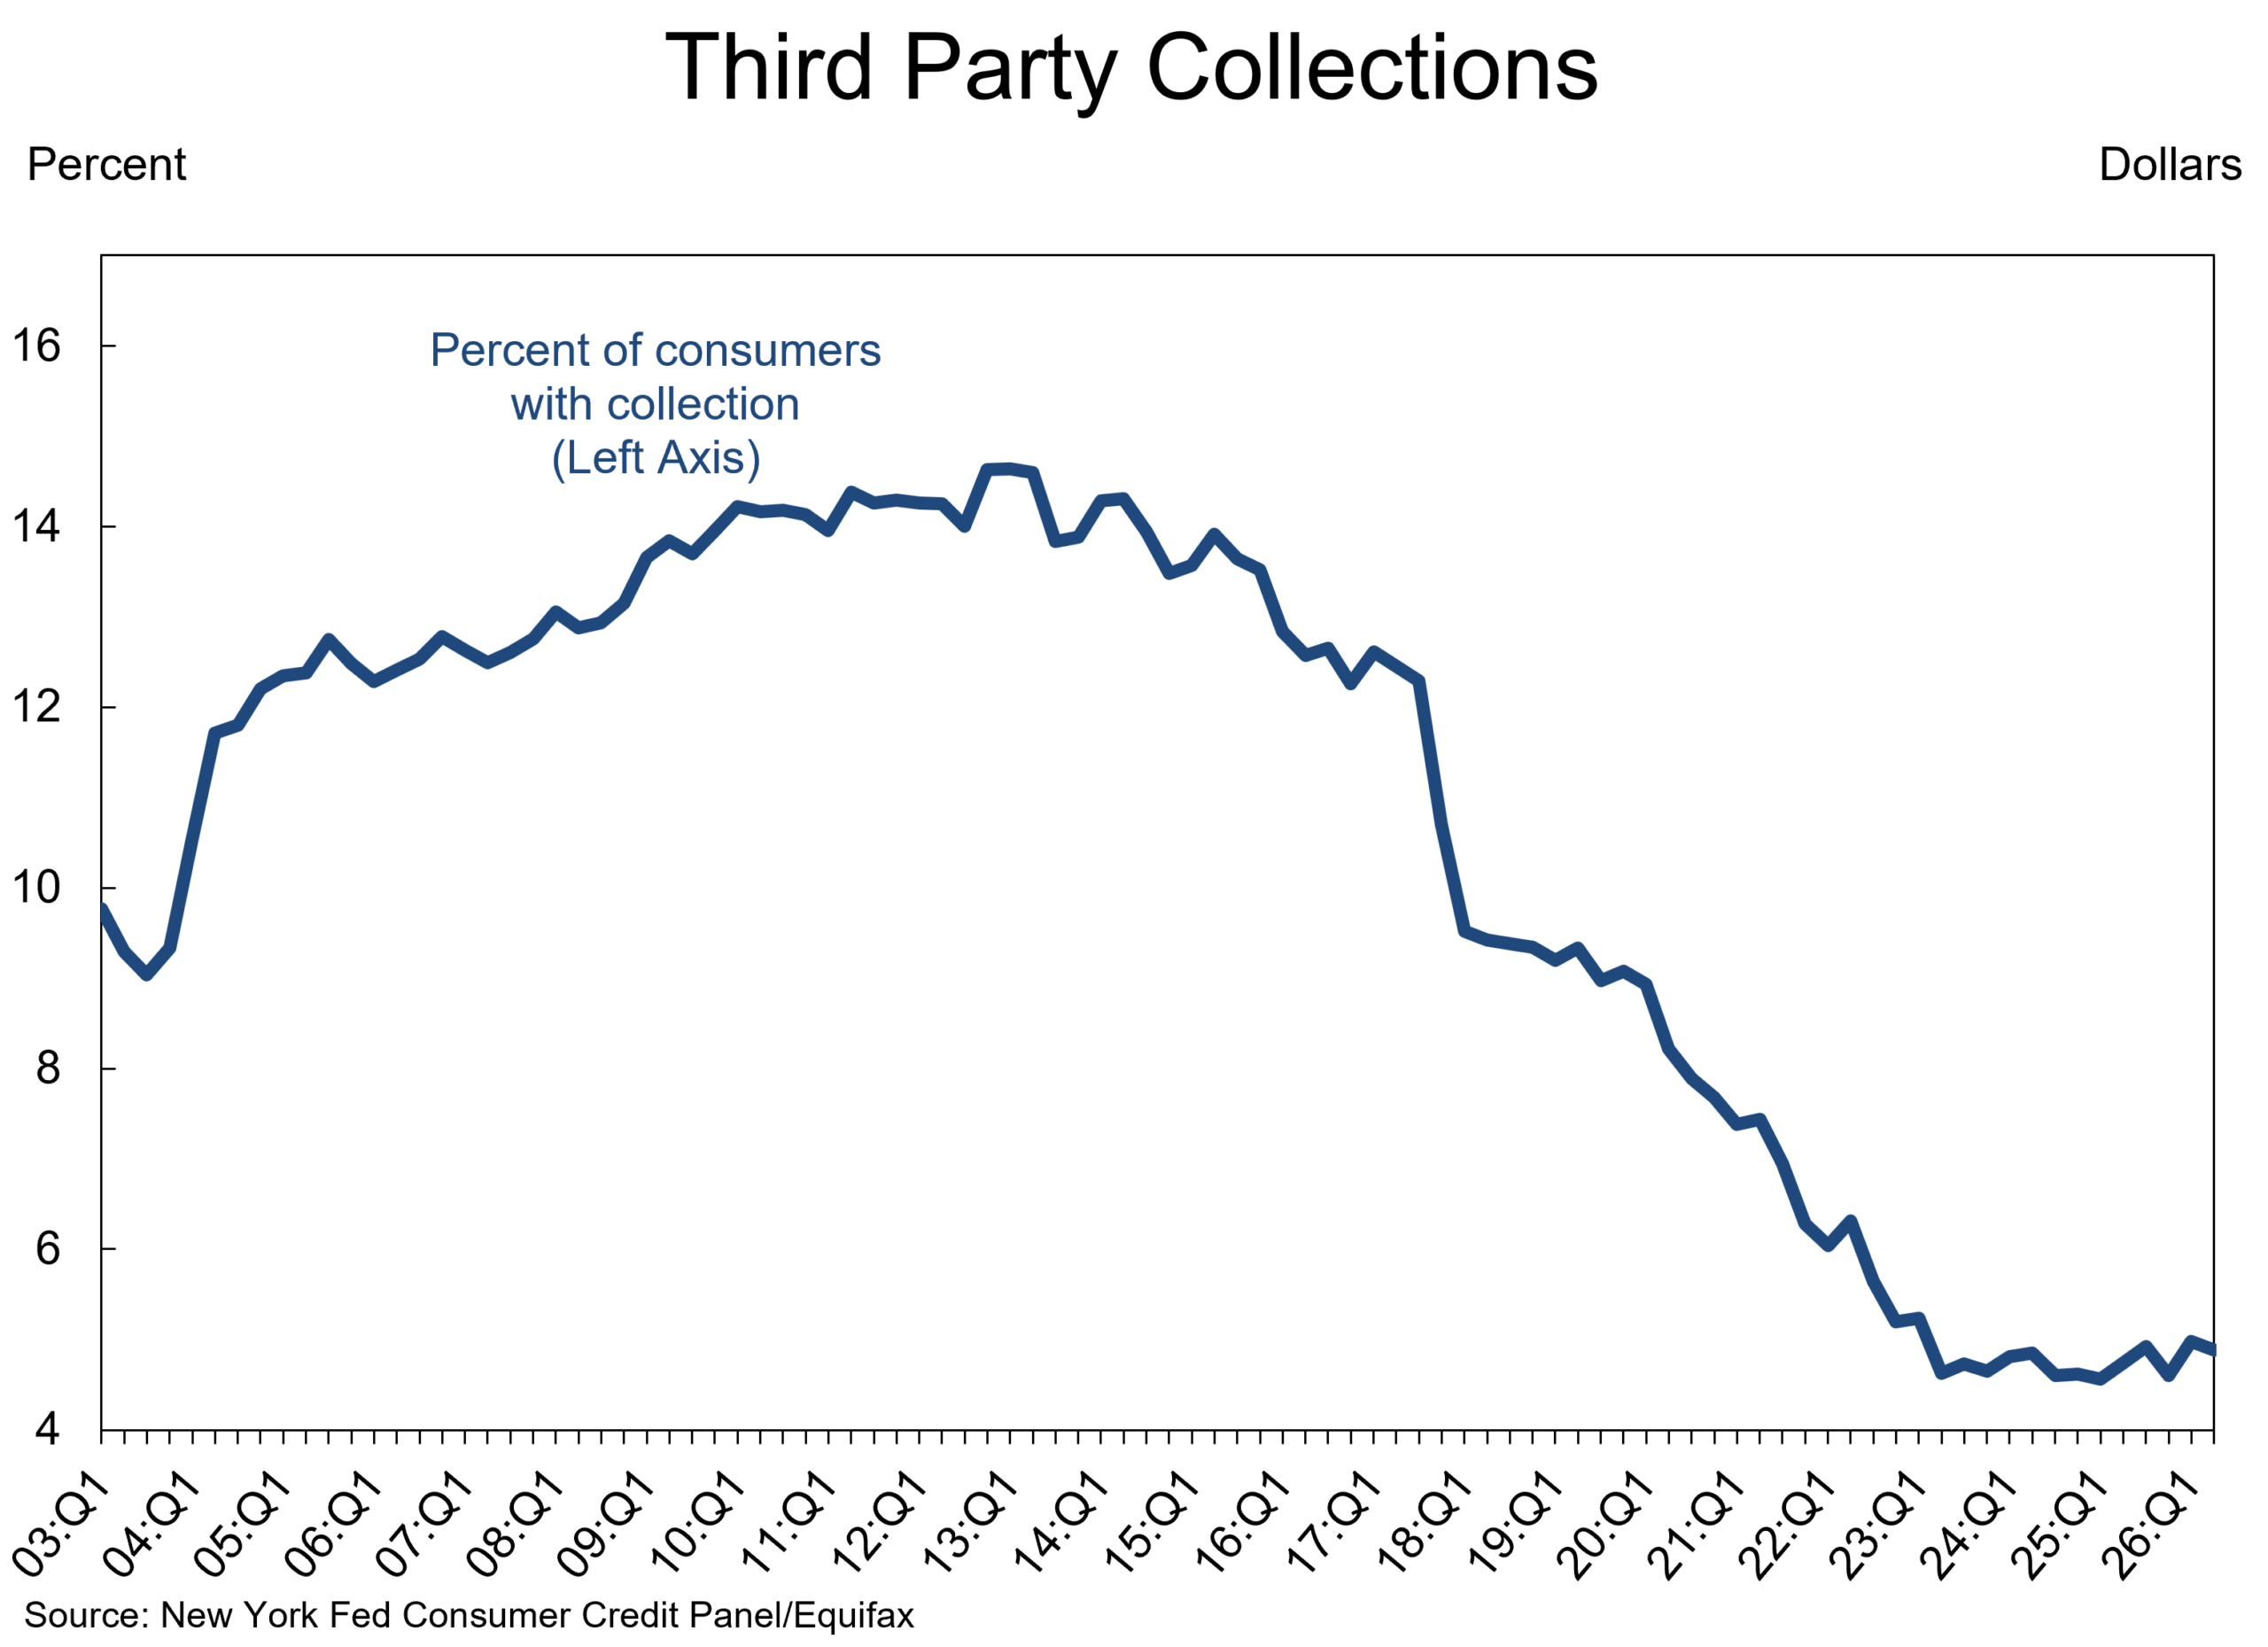
Another sign of low household stress: only 4.9% of consumers had third-party collections in Q2, versus 5.2% at the end of 2022 and an average of 9.1% in 2019.
There’s more.
- The number of consumer foreclosures fell 6.8% in Q2 to 55,000, leaving them 21% below 2019 levels.
- The number of consumer bankruptcies rose 10.3% to 137,000, but they’re still running 33% below 2019 levels.
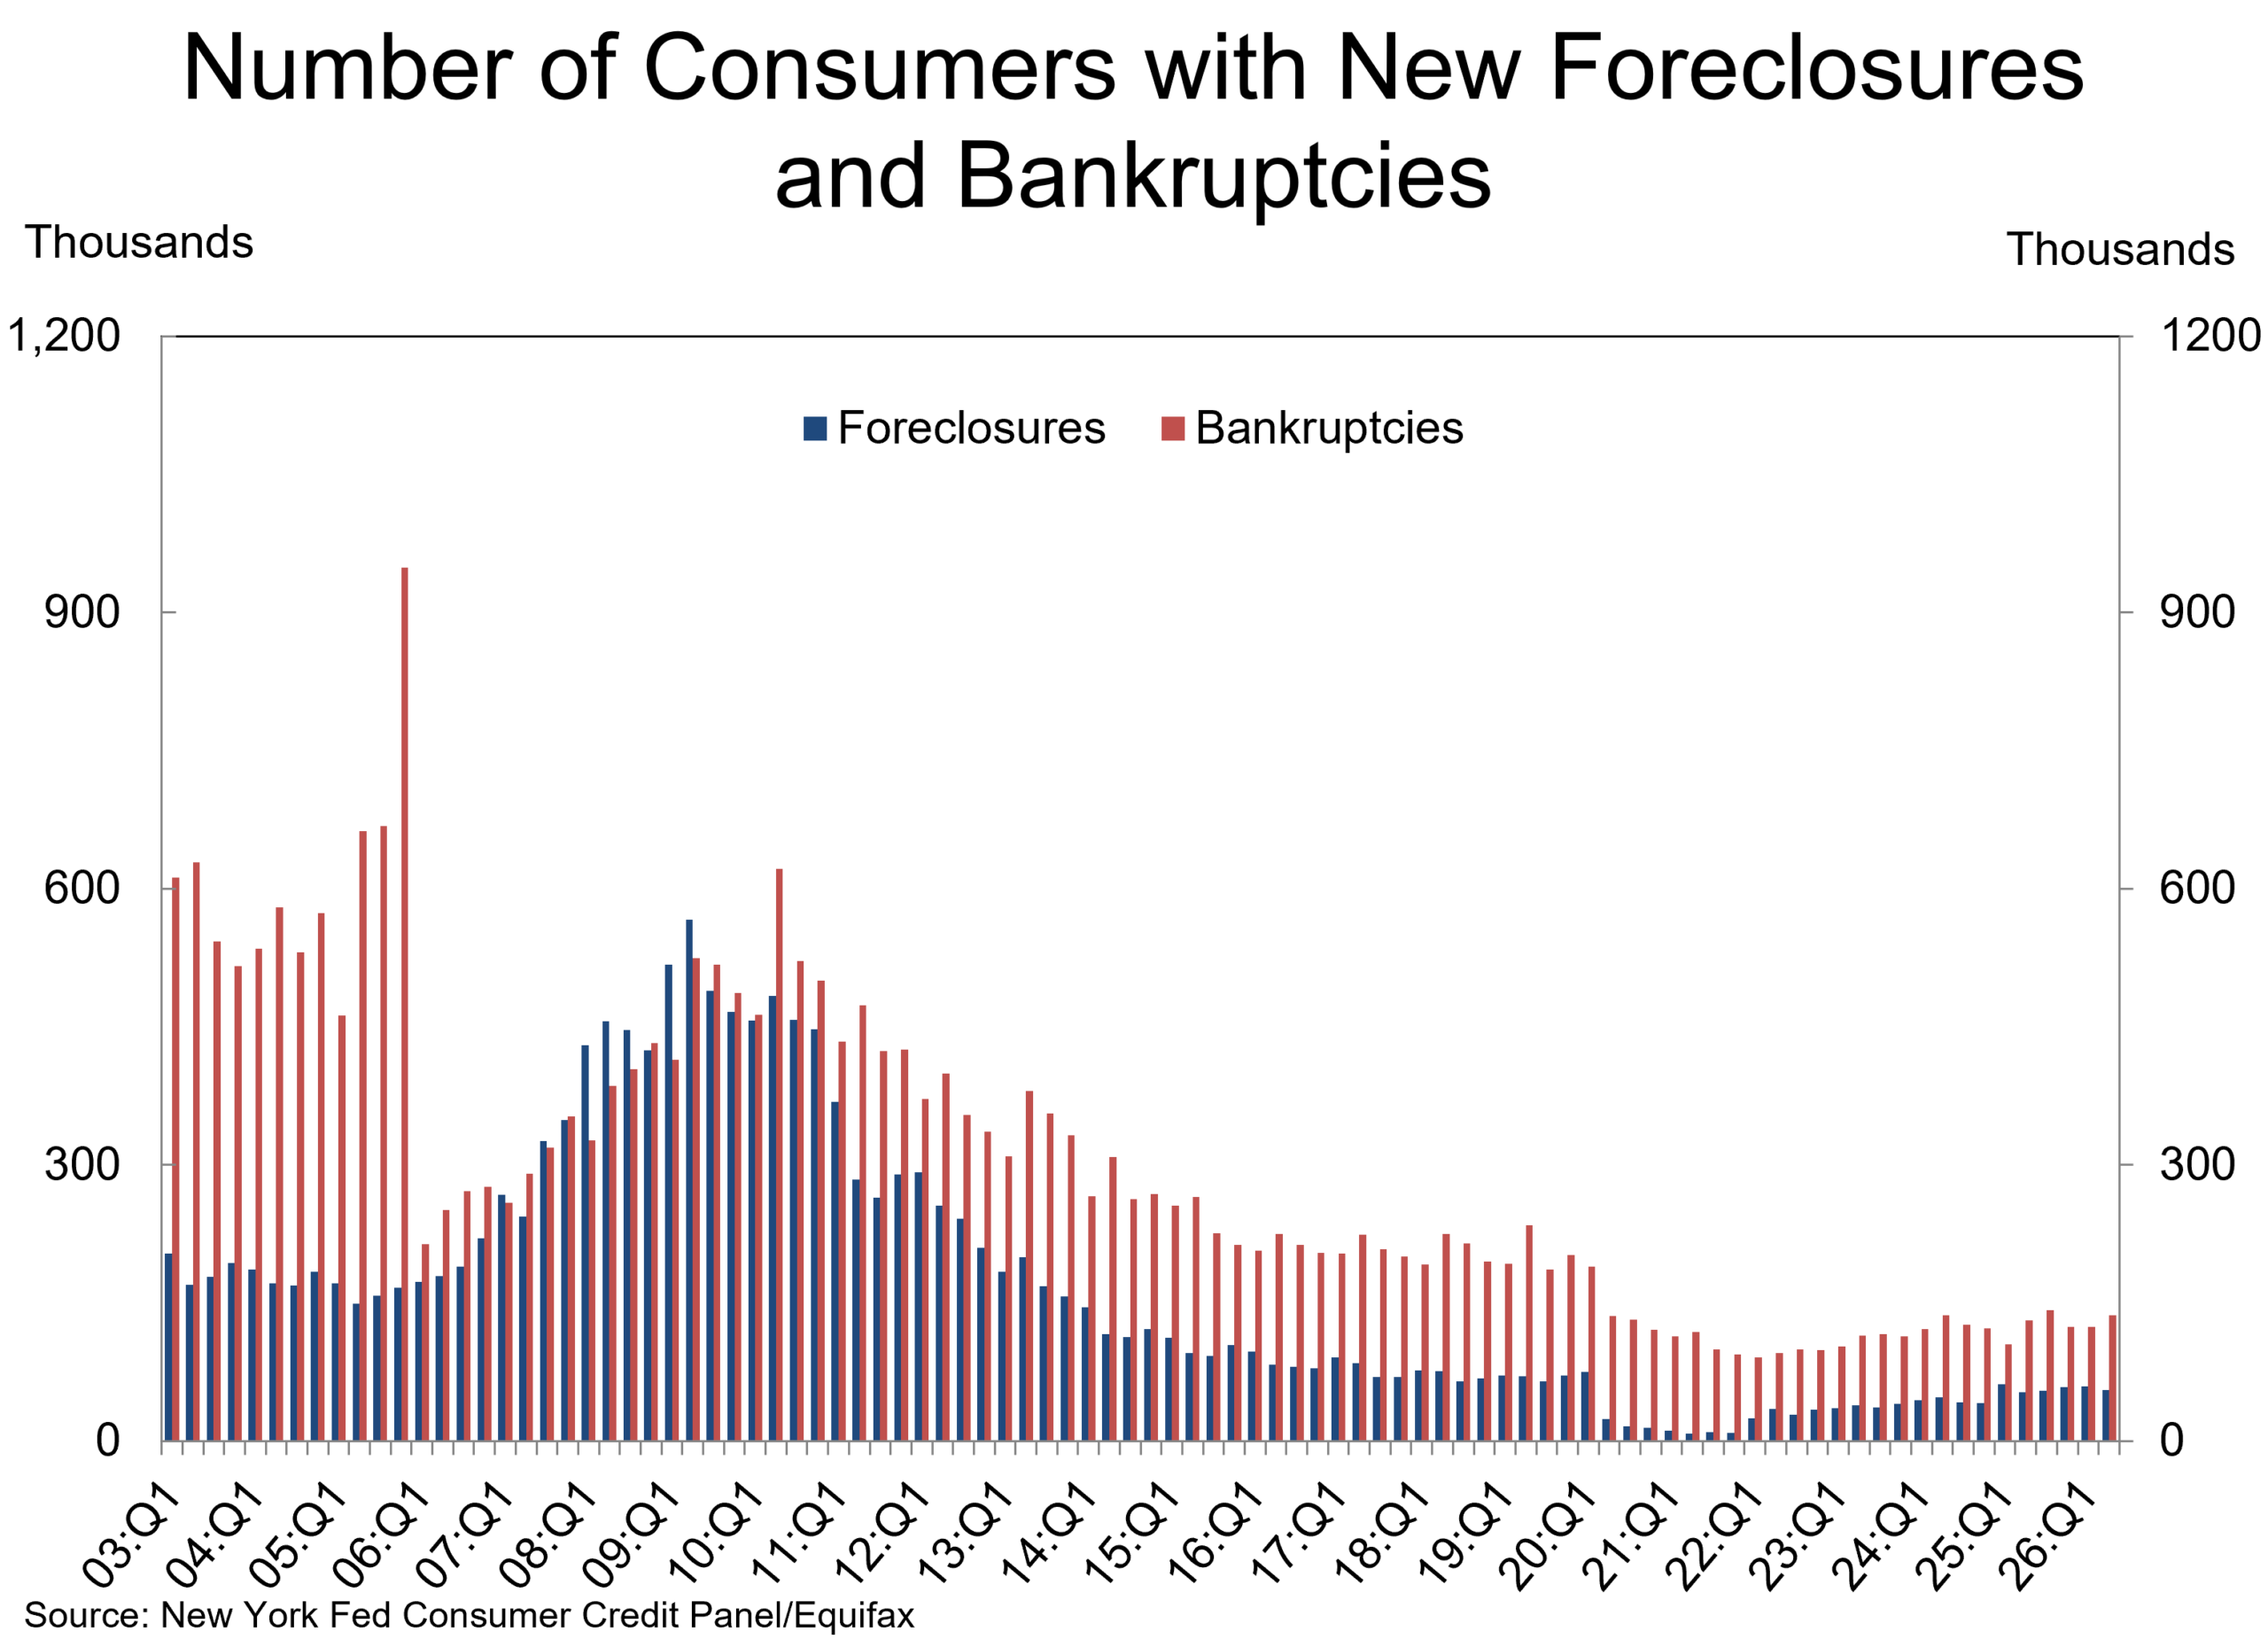
All of this points to household balance sheets that remain strong relative to history, even versus a solid period like 2019.
So yes, consumer spending is losing some momentum, especially with inflation biting. But slowing is not the same as breaking, and with household leverage, debt service, and delinquencies still relatively contained, there’s a lot more resilience here than the monthly headlines suggest. None of this means consumers are immune to a slowdown, especially if the labor market weakens. But if a recession does arrive, it’s hard to see household balance sheets as the source of the problem: they look more like a cushion than a vulnerability.
For more content by Sonu Varghese, Chief Macro Strategist, click here.
9077938.1. – 14AUG26A