
We’ve got a bit of a breather on the inflation front, with two consecutive benign readings. Headline CPI rose at an annualized pace of just 0.9% in July, after falling 5% in June, taking the 3-month annual pace to just 0.5%. Headline CPI is still up 3.4% from last year, reflecting an energy shock that reversed over the last couple of months. Stripping out volatile food and energy prices tells the same story, with core CPI running at a 1.6% annualized pace over the last three months and up 2.5% from last year.
The problem is that these soft readings, even within core CPI, don’t reflect broad-based disinflation. One big source of disinflationary pressure is housing, with rents running below the pre-pandemic trend. But that’s likely run its course, and it’s telling that CPI inflation remains elevated despite housing disinflation. Rents have an outsized impact on core CPI, which makes up over 40% of the basket, but less so on the Fed’s preferred inflation metric, core PCE, where housing accounts for about 17%. Things look much less benign there, with core PCE expected to run at a 2.7% annualized pace over the last three months and 3.3% over the last year.
It’s easy to get lost in aggregate inflation data, whether for goods or services. The reality is households face a broad-based inflation problem, likely driving poor consumer sentiment. Sometimes it’s useful to take off the economist/policy hat and look at things from a consumer perspective.
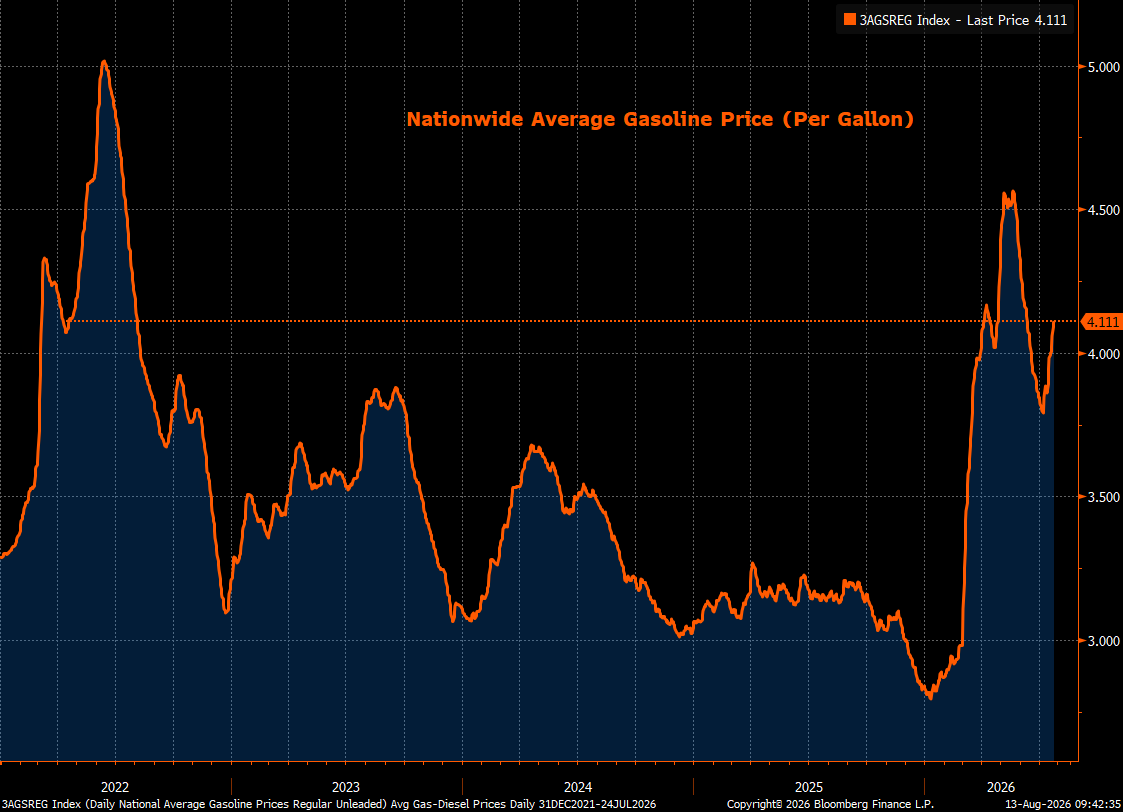
From a policy angle, it makes sense to exclude energy and food prices, as they tend to be volatile and don’t tell us much about the underlying trend. However, they account for a significant portion of household budgets. Take gasoline prices, which have been whipsawed by events in the Middle East. The crisis is far from resolved, and now the nationwide average gasoline price has climbed to $4.11/gallon, the highest level in two months. Average gasoline prices have never been above $4.0/gallon after August 12th in any previous year, ever.
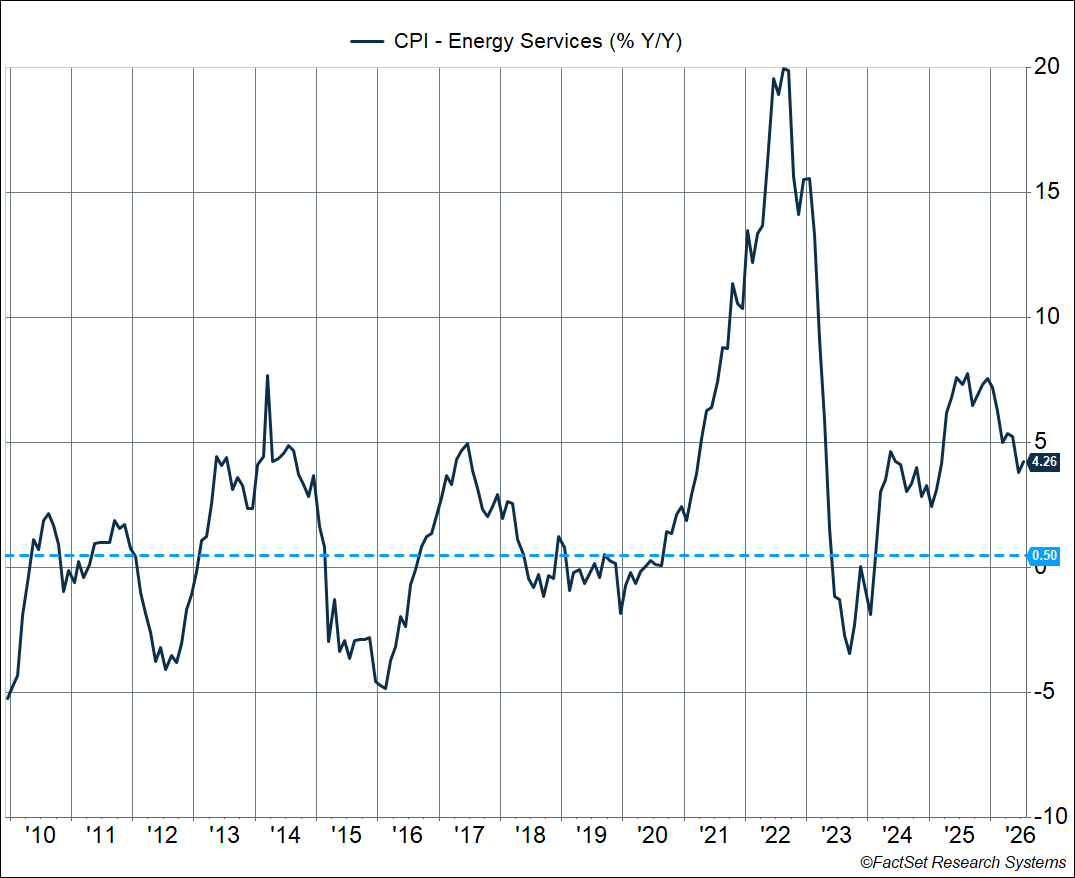
Then there’s energy services (electricity and piped gas utilities), which don’t help either. Household energy services are up 4.3% from last year – that’s eased from 7% last year, but the pace of price increases is still well above the 2010-2019 annual average of 0.5%. That’s the AI power-demand story showing up in household utility bills, and it doesn’t care which way oil prices go. There’s a reason why data centers have a political problem (especially in an election year).
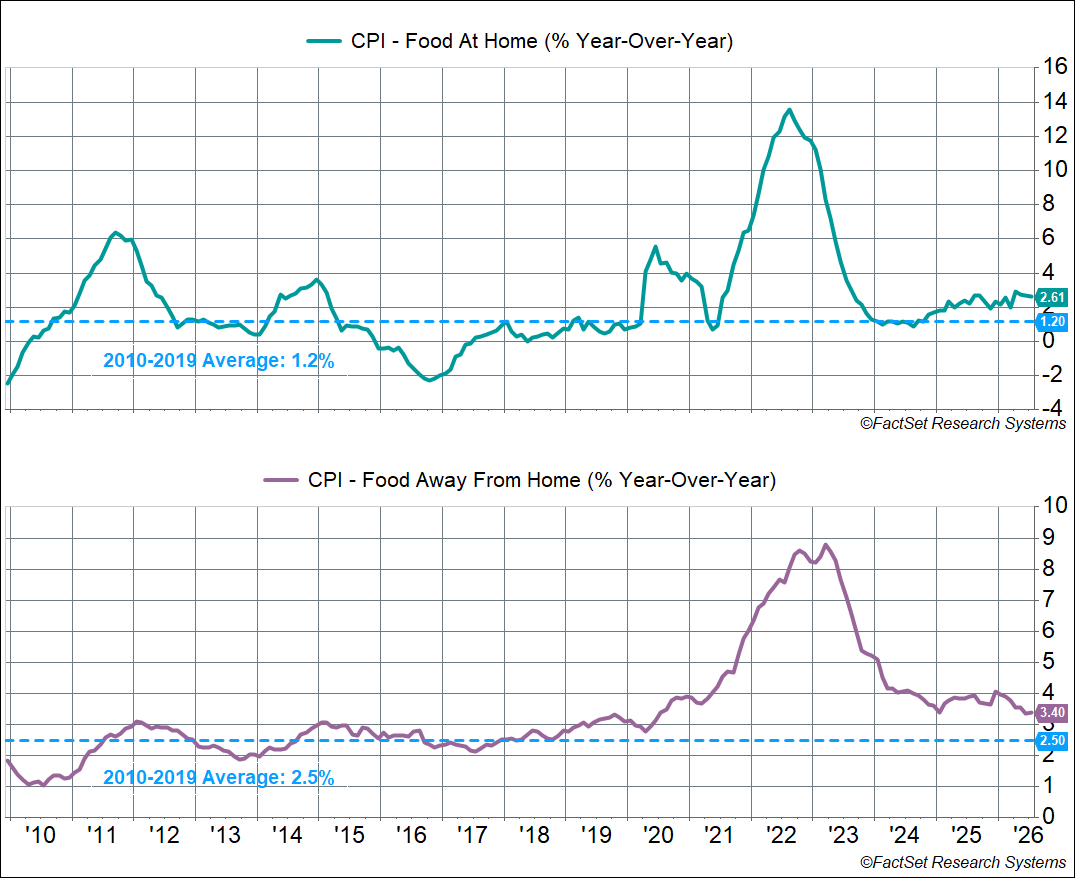
Food prices are also still running above their pre-pandemic pace:
- Food at home (groceries) is up 2.6% y/y, versus the 2010-2019 average of 1.2%
- Food away from home (restaurants and fast food) is up 3.4% y/y, versus the 2010-2019 average of 2.5%
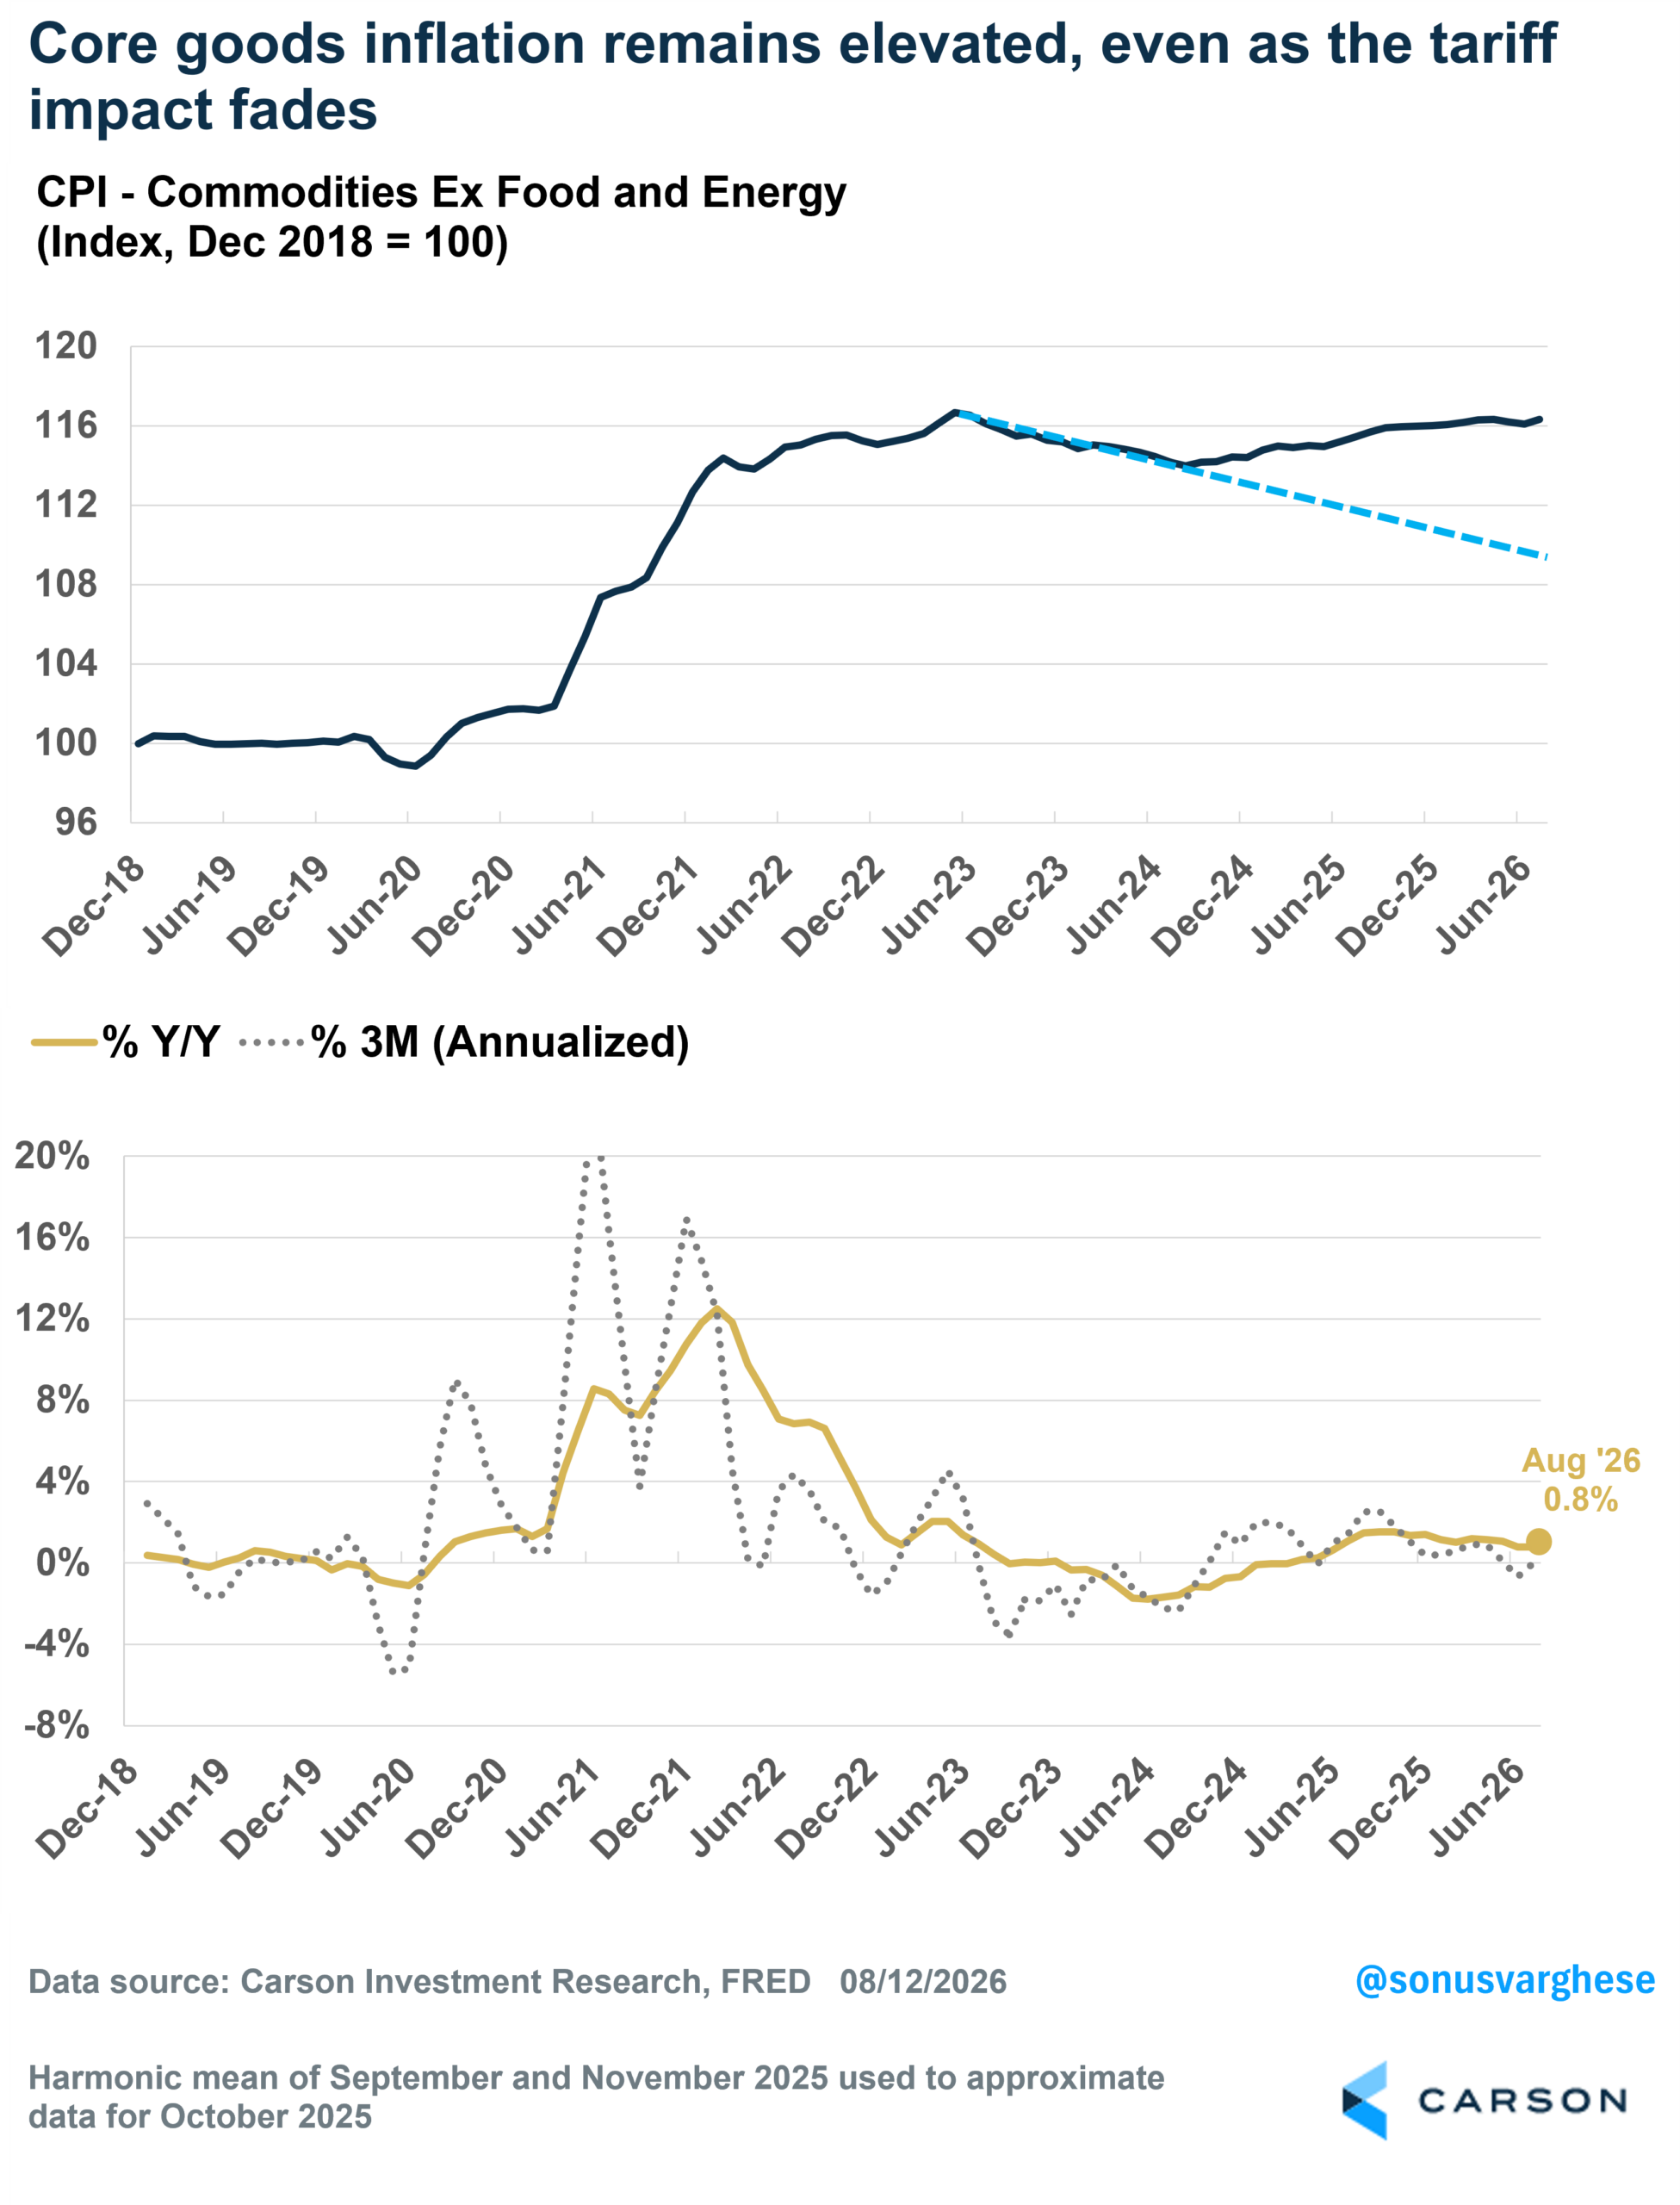
Other goods (“core goods”) prices have also been rising, with CPI for commodities excluding food and energy up 0.8% over the last twelve months. That may not seem like much, but from the mid-1990s through 2021, goods prices were falling. Even in 2017-2019, core goods prices fell 0.1% per year. Tariffs broke the 2023-2024 downward trend, and despite refunds going to companies, prices aren’t reverting to the pre-tariff trend line. Tariffs raised the level, and it’s sticking.
The good news is that the tariff impulse is fading, but AI-related bottlenecks are pushing up computer software and hardware prices. Prices for computers, smartphones, and even internet services rose at the fastest pace on record in July. AI isn’t cheap either, with CPI for computer software and accessories up 21% from a year ago.
One cut of inflation data Fed officials typically watch is core services excluding housing. The good news is we’re seeing softness here too, with the 3-month annualized pace collapsing to 1% (though the year-over-year pace is 2.9%). But we’ve seen this movie twice already. The 3-month pace fell to 0.5% in July 2024 and 0.1% in May 2025. Both times a handful of idiosyncratic items drove the decline; both times it reversed, and the 12-month trend never got back to 2%. This time, hotel prices and motor vehicle insurance are pulling core services inflation lower. That tailwind is unlikely to continue.

Stay on Top of Market Trends
The Carson Investment Research newsletter offers up-to-date market news, analysis and insights. Subscribe today!
"*" indicates required fields
The data cut I keep coming back to is one I wrote about in a blog earlier this year. Instead of looking at core services in aggregate, look at the individual everyday services households actually spend money on.
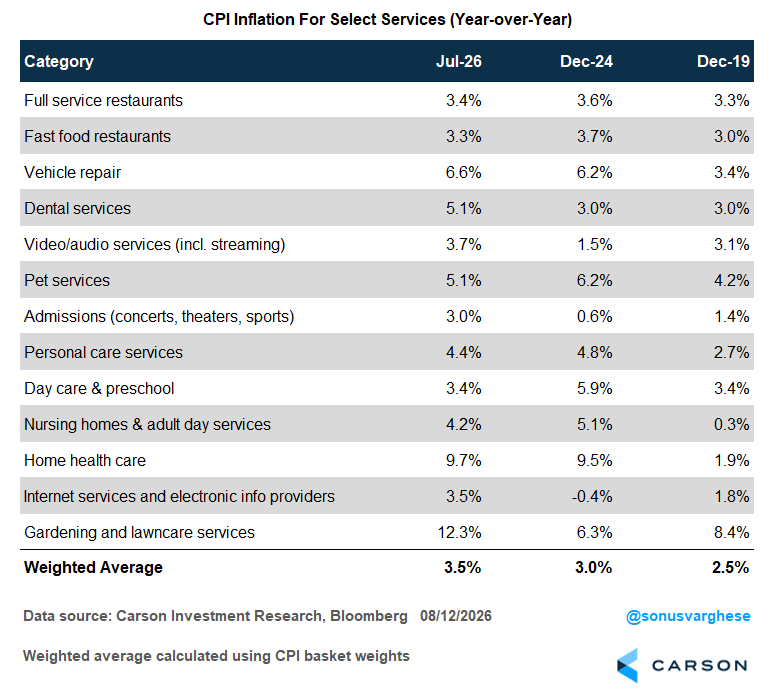
The weighted average across these 13 categories is running at 3.5% y/y. That compares to 3.0% at the end of 2024 and 2.5% at the end of 2019. So, these prices aren’t just running above pre-pandemic — they’ve accelerated over the past 18 months, even as aggregate core inflation eased.
And this isn’t a rounding error in the basket. These categories account for a combined weight of 12.4% of the overall CPI, or about 15.5% of the core CPI. A few standouts:
- Home health care: +9.7% y/y (versus 1.9% in Dec 2019)
- Gardening and lawn care services: +12.3% (8.4%)
- Vehicle repair: +6.6% (3.4%)
- Dental services: +5.1% (3.0%)
- Nursing homes and adult day services: +4.2% (0.3%)
The Labor Market Is Probably Tighter Than Payroll Data Suggests
What do these categories have in common? They’re labor-intensive, delivered locally, and can’t be imported, offshored, or automated. There’s no energy, tariff, or AI story here. The price of a lawn care visit or an hour of home health aide time is, to a first approximation, the wage bill.
So when home health care is running near 10% and lawn care above 12%, i.e., four to five times their pre-pandemic pace, that’s telling you something about wages at the lower end of the labor market. And it is not what slack looks like.
The implication is one I’ve held since the beginning of the year: the labor market is probably tighter than the payroll data suggest, at least in some areas. Weak hiring and a loose labor market aren’t the same thing. If labor supply in these occupations is shrinking, you can get soft payroll prints and accelerating wages at the same time. Home health aides, landscaping crews, and food service are exactly where reduced immigration bites hardest. That’s a supply story, and it shows up as inflation rather than unemployment. It’s also why I’m skeptical that we’ll see continued disinflation for core services. The labor cost pressure underneath these categories hasn’t gone anywhere.
The inflation problem continues, for households and for the Fed. Households obviously have no choice but to live with it, but it looks like the recent softness in inflation readings likely strengthens the case for doves on the committee who want to wait things out. We’re still in the camp that there won’t be rate hikes this year, but that also means we’ll continue to see inflation and the economy (and markets) run hot.
For more content by Sonu Varghese, Chief Macro Strategist, click here.
9075358.1. – 13AUG26A